
How to Create and Use a Gantt Chart for PhD Studies

A Gantt chart is a common tool used in the project management field. It is used for schedule planning of a project and its tasks and activities. It shows the tasks, their start and end dates, and the duration needed to complete them.
A PhD is a project and may last from as few as three years to as long as six years depending on the university and department a student is enrolled in.
In order to successfully complete a PhD program, one needs to plan when each of the tasks will be completed from the word go. A Gantt chart is very useful in doing this.
A PhD student can create one comprehensive Gantt chart or several smaller Gantt charts for each of the major deliverables.
This article discusses a Gantt chart for a general PhD program that has both coursework and dissertation components.
Benefits of a Gantt chart for planning PhD studies
Steps involved in creating a gantt chart for phd studies, how to effectively use the phd gantt chart, final thoughts on the phd gantt chart.
Creating a Gantt chart at the beginning of PhD studies has the following benefits:
- It is easy to create. A student can use the traditional pen-and-paper method or existing digital tools or softwares to create a Gantt chart.
- It is easy to read. The visual presentation of the Gantt chart makes it easy for the student to read and know what is expected of him at any point in time.
- A Gantt chart makes it easy to monitor progress of PhD studies. The user can choose to use different colors for tasks that have already been completed, tasks that are close to completion, and tasks that require more time and effort to complete.
- It forms the basis for monthly, weekly, and daily planning of the PhD studies. Depending on how detailed a student wants to go in terms of planning, the Gantt chart comes in handy when writing out the monthly, weekly and even daily plans.
Step 1: List all the deliverables expected of your PhD program. In this example, the PhD program has the following requirements:
- Coursework, divided into 4 modules each lasting 2 weeks. All 4 modules need to be completed within the first year of study.
- A comprehensive written exam at the end of the fourth module.
- An oral exam once a student passes the written exam.
- Submission of a concept note.
- Submission of a research proposal once a student passes the oral exam.
- Writing a business management case study.
- Three journal papers.
- At least two conference papers.
- A dissertation.
Step 2: For each of the requirements listed above, note the start and end dates. For the above example, the PhD program lasts a minimum of 3 years and a maximum of 6 years. Assuming the minimum of 3 years (beginning January 2021), the activities’ start and end dates are as follows:
| Year of study | Tasks/activities | Start and end dates |
|---|---|---|
| Year 1 | Module 1 | January 2021 |
| Module 2 | April 2021 | |
| Module 3 | July 2021 | |
| Module 4 | October 2021 | |
| Concept note | June 2021 | |
| Comprehensive exam | November 2021 | |
| Year 2 | Proposal defense | March 2022 |
| Business management case study | April – June 2022 | |
| Journal article 1 submitted to a journal | June 2022 | |
| Data collection and cleaning for dissertation | July – September 2022 | |
| Data analysis | October – November 2022 | |
| First conference paper presented | November 2022 | |
| First draft submitted | December 2022 | |
| Year 3 | Second conference paper presented | March 2023 |
| Two journal articles submitted to journals | May 2023 | |
| Revision and finalization of manuscript | January-October 2023 | |
| PhD viva | November 2023 |
Step 3: Using the above information, create the Gantt chart using Microsoft Word, Powerpoint or Excel.
The following are useful resources for creating a Gantt chart using:
- Microsoft Powerpoint: https://www.youtube.com/watch?v=wp0vr6OkW8Y
- Microsoft Excel: https://www.youtube.com/watch?v=00s5efQWrgU&t=10s
- Microsoft Word: https://www.youtube.com/watch?v=F90RdA5X4G0
The Gantt chart created from the above data is shown below. The chart was created using Microsoft Powerpoint.

Step 4: Once the Gantt chart is complete, print it out and hang it on the wall of your study room/area. This serves as a constant reminder of the tasks that need to be done at any point in time, as well as of the progress that has been made so far.
The greatest strength in using the Gantt chart for PhD studies lies in its ability to help one plan ahead. Using the Gantt chart above as an example, the user can plan as follows:
- At the beginning of every month, look at what is required of you. For instance, the student above needs to complete module one of the coursework and at the same time start working on proposal writing.
The student can plan for module one in advance by going through the course structure and expected readings, and reading in advance before the start of the module so that he is able to follow and understand what is being taught. If there are pre- and post-module exams, the student can also prepare for them in advance.
Preliminary tasks for proposal writing can include: discussing your proposed topic with your supervisor, and searching for and quick review of literature to identify the gap that your topic will be addressing. All these can be done in the first month before the actual proposal writing starts.
- The Gantt chart can help you identify the skills that are required for the successful completion of your dissertation. For instance, the student above is expected to write a Business Management case study by June of year 2.
If the student does not have case study writing skills, he can start looking for courses that teach case study writing and complete them way before the deadline for the case study. Same case for skills such as preparing and writing a journal paper, writing a conference paper, data analysis using softwares such as Stata, SPSS, NVivo etc.
- The Gantt chart can help you plan for academic-related events such as conferences.
In the example provided above, the student is expected to attend two scientific conferences (in November of year 2 and March of year 3) and make presentations.
The student can start looking for conferences related to his field that are held during the proposed times and mark the key dates and requirements of the conferences (for instance, abstract submission deadlines, abstract submission guidelines, registration deadlines etc).
- The Gantt chart can help you create monthly and weekly plans for longer tasks such as proposal writing.
In the above sample Gantt chart, proposal writing and defense spans a period of 15 months. By March of the second year, the student is expected to defend his proposal. This may seem like such a long period of time but in reality it is not. This is because it is not the only task that the student will undertake during this period. As a result, it is easier to focus on the tasks at hand and forget about the tasks that seem to have adequate time.
Proposal writing is a daunting task and requires constant reading and updating. To ensure that the student submits his proposal in time, he can create monthly and weekly plans for the task. An example of monthly planning for the proposal writing is provided in the table below:
| Month | Tasks |
|---|---|
| Month 1 – 3 | Literature search and review |
| Month 4 | Write chapter 1 |
| Month 5 | Share chapter 1 with supervisor for review |
| Month 6 | Address comments |
| Month 7 – 8 | Write chapter 2 |
| Month 9 | Share chapter 2 with supervisor for review |
| Month 10 | Address comments |
| Month 11 – 12 | Write chapter 3 |
| Month 13 | Share chapter 3 with supervisor for review |
| Month 14 | Address comments and finalize the proposal |
| Month 15 | Defend your proposal |
The monthly plan is based on assumptions, for instance, that the supervisor will review the document within the scheduled timeframe. This may or may not hold, depending on the supervisor.
It is therefore important to allow ample time for such factors that are out of your own control in order to ensure that the task is completed by the deadline.
The monthly plans can further be broken down into weekly (and even daily) plans, for instance:
- Number of papers to read per week (day).
- Number of words to write per week (day).
- How many citations and bibliographies to insert (update) every week (day).
- Number of additional articles to search and add to your library each week etc.
Each of these tasks contributes to the overall proposal writing and make the task completion easier and faster than waiting for the last few months to do it all at once.
A PhD is a medium- to long-term project depending on how long it takes to finish. It therefore requires effective and careful planning from the start of the program to ensure that each deliverable is completed within the stipulated time. The Gantt chart is an easy-to-create, and easy-to-use planning tool that can be used by all PhD students. Not only does it save the student time but it also gives him peace of mind knowing the progress of each and every task required.
Grace Njeri-Otieno
Grace Njeri-Otieno is a Kenyan, a wife, a mom, and currently a PhD student, among many other balls she juggles. She holds a Bachelors' and Masters' degrees in Economics and has more than 7 years' experience with an INGO. She was inspired to start this site so as to share the lessons learned throughout her PhD journey with other PhD students. Her vision for this site is "to become a go-to resource center for PhD students in all their spheres of learning."
Recent Content
SPSS Tutorial #12: Partial Correlation Analysis in SPSS
Partial correlation is almost similar to Pearson product-moment correlation only that it accounts for the influence of another variable, which is thought to be correlated with the two variables of...
SPSS Tutorial #11: Correlation Analysis in SPSS
In this post, I discuss what correlation is, the two most common types of correlation statistics used (Pearson and Spearman), and how to conduct correlation analysis in SPSS. What is correlation...
Gantt Chart for a Research Project Proposal: Step-by-step guide

In project management, there are few tools as effective and illuminating as the Gantt chart . This simple yet powerful visual tool is invaluable for anyone overseeing a complex task, including research project proposals. It is particularly beneficial in the early stages of a project, where meticulous planning is required to ensure that all elements of the project are understood, accounted for, and scheduled appropriately. Therefore, whether you're an academic researcher, a project manager in a corporate setting, or even a student planning your thesis, understanding how to create and use a Gantt chart can be a significant asset.
What is a Gantt Chart and what is it used for?
A Gantt chart, named after its creator, Henry Gantt, an American mechanical engineer and management consultant, is a type of bar chart that visually represents a project schedule. It was first developed in the early 20th century and has since become a staple in project management across various fields and industries. Today, it's used by project managers in sectors like construction, software development, research and development, and more.
At its core, a Gantt chart consists of two main components: tasks and time. The tasks related to the project are listed on the vertical axis, while the horizontal axis represents time. Each task is represented by a horizontal bar, the length of which corresponds to the duration of the task.
Make your own Gantt chart in Gleek .
Gantt charts are incredibly useful for planning and scheduling projects, tracking progress, and managing dependencies between tasks. They provide a clear visualization of the project timeline and help to identify potential bottlenecks and overlaps. This makes them an ideal tool for coordinating teams, allocating resources, and keeping stakeholders informed.
The versatility of Gantt charts solves numerous problems faced by project managers. They simplify complex projects by breaking them down into manageable tasks and visualizing their sequence and duration. This can help in avoiding over-scheduling, underestimating deadlines, and mismanaging resources.
Whether you're a seasoned project manager or a student working on a research proposal, mastering the use of Gantt charts can significantly streamline your project planning process and enhance your team's productivity.
Components needed for Research project proposal diagram
Creating an effective research project proposal diagram requires several key components. These elements provide a comprehensive overview of the project, including its timeline, tasks, and significant milestones.
Project Stages: Each stage of your research project should be clearly defined. This can include the literature review, methodology development, data collection and analysis, results compilation, proposal drafting, peer review, and final edits.
Timeline: The timeline provides a visual representation of the project's duration. It should outline the start and end dates of the project, as well as the estimated completion time for each stage.
Tasks: Each task within the project stages should be clearly outlined. This includes what needs to be done, who is responsible for it, and when it should be completed.
Milestones: Milestones mark significant achievements or phases in your project. These can help track progress and ensure that the project is moving forward as planned.
Dependencies: Dependencies show the relationship between different tasks. It's crucial to highlight how the delay in one task can impact others.
Status: The status of each task and stage helps monitor the project's progress. It can indicate whether a stage is completed, in progress, or yet to start.
Notes/Comments: Any additional information, observations, or feedback about the project can be included here. This could be insights gained during the research, changes made to the project plan, or issues that have arisen.
By incorporating these components into your diagram, you can create a well-structured, transparent, and efficient project proposal.
Creating a Research project proposal Gantt chart using the Gleek App
Step 1: launching gleek and selecting 'new diagram'.
First, launch Gleek.io in your web browser. Once you're in, select 'New Diagram' from the options available. In the diagram type, choose 'Gantt'.

Step 2: Defining Research Goals
The research project initiates with an active phase dedicated to defining research goals, which commenced on December 15, 2023, lasting for a week. This phase involves brainstorming, outlining objectives, and establishing the research's overarching scope.

Step 3: Literature Review Phase
Transitioning to the next stage, we have the completed 'Literature Review' phase spanning two weeks. This phase entails an in-depth analysis, sourcing relevant publications, synthesizing existing knowledge, and aligning it with the predefined research goals.

Step 4: Methodology Design Phase
Progressing to the 'Methodology Design' phase, currently active for three weeks, this stage intricately structures the research approach. It involves designing methodologies, frameworks, and strategies based on insights gleaned from the literature review, ensuring a robust research plan.

Step 5: Data Collection Phase
Following the planning stages is the critical 'Data Collection' phase, slated for four weeks. This phase involves meticulously gathering and assembling primary data, employing various methodologies such as surveys, experiments, or interviews, aligning with the established research framework.

Step 6: Data Analysis Phase
Post-data collection, the active 'Data Analysis' phase spans three weeks. This phase engages in thorough data examination, statistical analysis, and deriving insights from the accumulated information. It involves identifying patterns, correlations, or trends relevant to the research objectives.

Step 7: Results Compilation Phase
Subsequently, the 'Results Compilation' phase consolidates and organizes the analyzed data over two weeks, presenting it in a coherent format. This phase involves preparing comprehensive reports, graphs, or summaries, showcasing the findings derived from the data analysis stage.

Step 8: Drafting Proposal Phase
Advancing further, the active 'Drafting Proposal' phase, extending over three weeks, involves crafting the research proposal. It includes outlining the research problem, detailing methodologies, and structuring a cohesive proposal aligned with the project's objectives.

Step 9: Peer Review Phase
Upon completion of the draft, the two-week 'Peer Review' phase gathers insights and constructive feedback from peers or subject experts. It involves peer evaluations, discussions, and recommendations aimed at refining and enhancing the proposal's quality.

Step 10: Final Edits
Finally, the one-week active 'Final Edits' phase focuses on meticulous revisions, addressing feedback, and ensuring the proposal's completeness, accuracy, and compliance with set standards. This stage includes proofreading, formatting, and polishing the final document.

Step 11: Proposal Submission Milestone
The 'Proposal Submission' milestone, set for May 15, 2024, marks the conclusive stage, signifying the submission of the crafted and refined research proposal for evaluation and potential implementation.

Hurray, You Did It!
And there you have it! Your Research Project Proposal Gantt Chart is now complete.

This comprehensive diagram, with its clearly defined stages, tasks, timeline, dependencies, resources, and status, provides a holistic view of your research project. It not only serves as a visual representation of the entire project but also acts as a roadmap guiding you from the initial brainstorming phase to the final proposal submission. Utilizing such a diagram can greatly enhance your project planning and execution, ensuring all aspects are considered, dependencies are taken into account, and milestones are tracked. It fosters better coordination, communication, and understanding among team members, leading to more efficient and effective project management.
About Gleek.io
Gleek.io is a powerful tool that can further enrich your project planning needs. It's an intuitive app designed to help you visualize complex ideas, processes, and systems through various types of diagrams. Whether you need to create a flowchart, UML diagram, or even a Gantt chart like the one we've just built, Gleek.io makes the process straightforward and hassle-free.
With its keyboard-centric approach, Gleek.io allows you to create diagrams faster than traditional drag-and-drop tools. You can quickly jot down your ideas and see them evolve into structured diagrams in real-time, making it an ideal tool for brainstorming sessions, project planning, and presentations.
In conclusion, Gleek.io is more than just a diagramming tool. It's a platform that enables you to visualize your thoughts, communicate complex ideas simply, and manage your projects more effectively. Give it a try for your next project and experience the difference it can make!
Related posts
Beyond Traditional Planning: Top Gantt Chart Alternatives in 2024
Gantt chart critical path explained
Visual project management: Gantt Charts vs. Timelines explained
Pert vs. Gantt Charts: Choosing your project's blueprint
back to all posts
Creating awesome Gantt charts for your PhD timeline

It’s a common scenario: you have never heard about Gantt charts. Then, when writing a PhD application or planning your PhD timeline for the upcoming years, someone suggests: You should include a Gantt chart! No need to worry. Here is all you need to know about Gantt charts for your PhD timeline.
What are Gantt charts?
A Gantt chart is a visual representation of a project schedule and a widely used tool in project management.
Gantt charts are named after Henry Gantt. He lived from 1861-1919 and developed these types of charts as part of his work as a management consultant.
Why are Gantt charts frequently used for PhD timelines?
Gantt charts are frequently used to illustrate PhD timelines because doing a PhD essentially means creating, managing and implementing a project with many components over several years.
Furthermore, Gantt chart PhD timelines allow PhD students to track their progress. They can also help PhD students to stay on track with their work.
What information is included in Gantt charts for PhD timelines?
For a PhD based on published articles, different bars in a Gantt chart PhD timeline could for example represent individual papers. For a monograph, it may be smarter to focus on research stages.
How do you create a Gantt chart for your PhD timeline?
Creating a phd timeline gantt chart in microsoft excel, creating a phd timeline gantt chart in microsoft powerpoint.
Manually creating a PhD timeline Gantt chart in PowerPoint is a bit easier than in Excel. Therefore, I will explain the process here.
In the example below, I decided to plan PhD tasks for a year. Thus, 1 means January, 2 means February, 3 means March and so forth. The length of tasks is also indicated in months:
One more thing I did was changing the value of the axis, because I want to illustrate the months of a year. Thus, it was a bit weird that the horizontal axis started with 0 and ended with 13 while I needed 1-12 to indicate each month of a year. You can simply change this by clicking on the axis. On the righthand side, Format Axis will appear. Go to Axis Options , Bounds , and enter 1 for Minimum and 12 for Maximum .
Creating a PhD timeline Gantt chart in a Microsoft Word
Looks familiar? Yes! From here, it is basically the same process as editing the bar chart in PowerPoint.
Creating a PhD timeline Gantt chart with an online tool
Phd timeline gantt chart templates, best gantt chart template for phd timelines in microsoft excel.
A great way to create a detailed Gantt chart in Microsoft Excel is by using Microsoft’s free Gantt project planner template . The level of detail and functionality exceeds those of simple, manually created Gantt charts. This makes this type of Gantt chart especially useful to track detailed PhD progress.
Best Gantt chart template for PhD timelines in Microsoft PowerPoint
Best gantt chart template for phd timelines in microsoft word, phd timeline gantt chart examples, gantt chart phd timeline example in microsoft excel, gantt chart phd timeline example in microsoft powerpoint, gantt chart phd timeline example in microsoft word.
Using a weekly Gantt chart template from TemplateLab mentioned above, an example PhD timeline with weekly tasks and objectives could look, for instance, like this:
Master Academia
Get new content delivered directly to your inbox, 10 reasons not to do a master's degree, 9 smart questions to ask a professor about graduate school, related articles, asking for a recommendation letter from a phd supervisor, 24 popular academic phrases to write your abstract (+ real examples), how to benefit from chatgpt as an academic, 10 tips on how to use reference management software smartly and efficiently.
A PhD timeline for finishing quickly [Free Gantt Download]
Navigating the labyrinthine journey of a PhD program is no small feat.
From the day you step into your graduate program as a bright-eyed doctoral student, you’re immediately thrust into a complex weave of coursework, research, and milestones.
By the second year, you’ve transitioned from coursework to research, laying the groundwork for your dissertation—a pivotal component in your scholarly endeavour.
Come the third year, you face the critical oral examination, a hurdle that could make or break years of hard work.
But how does one streamline this multifaceted journey? The answer lies in a well-planned PhD timeline.
This blog serves as an invaluable guide for any PhD student looking to complete their doctoral studies efficiently, walking you through each milestone from coursework to graduation.
How to Begin with the PhD Timeline Planning?
Planning your PhD timeline is an essential first step in your PhD program.
Success in any PhD program depends, to a large extent, on effective time management and keeping track of progress through a thoughtfully crafted PhD timeline.
Start with outlining all your major requirements:
- coursework,
- dissertation,
- and the expected time needed for each task.
I also highly recommend factoring in failure time – give yourself a little bit of wiggle room for when things, invariably – go wrong.
It’s crucial to remain realistic about the time you can commit daily or weekly while keeping long-term goals in mind.
Regular check-ins on your PhD timeline and supervisor will help you stay on track and allow you to adapt if necessary.
Adjustments may be needed as you progress through your PhD program, but having a timeline as a guide can make the journey less daunting and more achievable.
Elements to include in a 3-year PhD timeline
The initial stage in this timeline typically involves coursework, often lasting one year, where the student engrosses themselves in advanced study in their chosen field.
Once the coursework is done (USA PhDs), they focus on proposing, conducting, and presenting their initial research.
By the end of the second year, most students should have a clear direction for their dissertation, a core component of the PhD process.
In this third and final year of the PhD timeline, the student focuses primarily on completing their dissertation, which involves collecting data, analyzing results, and organizing their research into a substantial, original, and cohesive document that contributes to contemporary knowledge in their field.
Regular reviews and modifications of the PhD timeline may also be necessary to accommodate various unpredictable circumstances, thus making this timeline both a guide and a flexible workplan.
It is a significant tool in successfully navigating the maze of becoming a PhD holder.
Create Your PhD Timeline for a 3 year completion
Creating a timeline for a 3-year PhD program requires careful planning, as you’ll have multiple milestones and tasks to complete.
This timeline may vary depending on your specific field, institution, or country, but here is a general outline you can use as a starting point:
| Year & Quarter | Activity/Milestone | Description | Outcome/Output |
|---|---|---|---|
| Admission & Onboarding | Formalities for joining the program, including orientation. | Official start of the program. | |
| Initial Literature Review | Familiarize yourself with the existing research in your field. | Foundation for your research. | |
| Coursework | Complete required or optional courses. | Credits/Education | |
| Research Proposal Outline | Develop a draft outline for your PhD proposal. | Outline for proposal | |
| Coursework & Seminars | Continue with coursework and attend relevant seminars. | Credits/Education | |
| Meet with Advisor | Discuss research interests and outline. | Feedback for refinement | |
| Complete Research Proposal | Finalize your research proposal with your advisor’s input. | Approved Proposal | |
| Ethics Approval (if needed) | Submit proposal for ethics approval if required. | Ethics Clearance |
| Year & Quarter | Activity/Milestone | Description | Outcome/Output |
|---|---|---|---|
| Data Collection | Start gathering data according to your proposal. | Initial Data | |
| Intermediate Review | Review progress with advisor. | Feedback for refinement | |
| Data Analysis | Start analyzing the collected data. | Preliminary Findings | |
| Draft Chapters | Start writing initial chapters of your thesis. | Draft Chapters | |
| Further Analysis | Conduct additional analysis if necessary. | Refined Findings | |
| Publish/Conference | Consider publishing initial findings or presenting at a conference. | Paper/Presentation | |
| Complete Data Collection | Finish gathering all necessary data. | Finalized Data | |
| Update Thesis Draft | Update your thesis draft with the complete analysis. | Updated Draft |
| Year & Quarter | Activity/Milestone | Description | Outcome/Output |
|---|---|---|---|
| Thesis Writing | Focus primarily on writing your thesis. | Near-final draft | |
| Peer Review | Have peers or mentors review the thesis draft. | Feedback for refinement | |
| Thesis Submission | Finalize and submit your thesis for review. | Submitted Thesis | |
| Defense Preparation | Prepare for your thesis defense. | Defense Presentation | |
| Thesis Defense | Defend your thesis in front of a committee. | Committee’s Decision | |
| Revisions (if needed) | Make any revisions recommended by the committee. | Final Thesis | |
| Final Submission | Submit the finalized thesis. | PhD Thesis | |
| Graduation | Complete any remaining formalities. | PhD Awarded |
Free Gantt chart excel template
Here is a free template you can modify for your own research:
Example Gantt chart for a USA PhD
Here are some common steps involved in completing a PhD, which I’ll use to create the Gantt chart:

- Orientation and Coursework (Semester 1) : Familiarization with the university, department, and coursework.
- Coursework (Semester 2) : Continued coursework and possible teaching/research assistantships.
- Select Advisor and Research Topic : Usually done towards the end of the first year or the beginning of the second year.
- Preliminary Research : Initial research and literature review.
- Complete Coursework (Semester 3) : Wrap up any remaining required courses.
- Research Proposal : Develop a full research proposal including methodology.
- Qualifying Exams : Exams to transition from a Ph.D. student to a Ph.D. candidate.
- Begin Research : Start of actual research based on the approved proposal.
- Conduct Research : Data collection, experiments, and analysis.
- Intermediate Review : A review to assess the progress of the research.
- Write Papers : Start writing papers and possibly publishing in journals.
- Finalize Research : Final experiments and data analysis.
- Write Dissertation : Writing the actual Ph.D. dissertation.
- Dissertation Defense : Defending the dissertation before the committee.
- Graduation : Completing all requirements and graduating.
Example Gantt chart for a UK, European and Australian PhD
For Ph.D. programs outside the United States, especially in Europe and some other parts of the world, students often go straight into research without the need for coursework. Here are some common steps for such programs:

- Orientation : Familiarization with the university and department.
- Select Advisor and Research Topic : Usually done at the beginning of the program.
Wrapping up
The journey to earning a PhD is complex and demanding, filled with academic milestones from coursework to research to dissertation writing.
The key to a smooth and efficient doctoral journey lies in well-planned time management—a structured PhD timeline.
This blog serves as an invaluable guide, offering detailed tips for planning out each academic year in both U.S. and international PhD programs. It emphasizes the importance of starting with an outline of major requirements and factoring in “failure time” for unforeseen challenges.
For those looking to navigate their PhD journey in three years or beyond, having a flexible but comprehensive timeline can be the compass that guides them successfully through the academic labyrinth.
Whether you’re just starting out or already deep into your research, the principles and strategies outlined here can help streamline your path to that coveted doctoral hood.

Dr Andrew Stapleton has a Masters and PhD in Chemistry from the UK and Australia. He has many years of research experience and has worked as a Postdoctoral Fellow and Associate at a number of Universities. Although having secured funding for his own research, he left academia to help others with his YouTube channel all about the inner workings of academia and how to make it work for you.
Thank you for visiting Academia Insider.
We are here to help you navigate Academia as painlessly as possible. We are supported by our readers and by visiting you are helping us earn a small amount through ads and affiliate revenue - Thank you!
2024 © Academia Insider

How to write a Research Proposal: Creating a Gantt chart
- Components of a research proposal
- Useful videos
- Common mistakes to avoid
- Sage Research Methods LibGuide This link opens in a new window
- Managing sources
- Request a literature search
- Research proposal - examples
- Creating a Gantt chart
- Free Apps for Research
- Academic writing
What is a Gantt chart
Some University departments require students to create a Gantt chart to represent a schedule for the research project. The Gantt chart shows the timelines of the various steps of the project including their dependencies and any resources needed . In other words, the chart depicts when an event is supposed to take place in your project by providing an outline regarding the order in which the various tasks need to be performed .
An example of a Gantt chart.

Gantt chart on Moodle
How to create a Gantt chart - videos
- << Previous: Research proposal - examples
- Next: Free Apps for Research >>
- Last Updated: Apr 30, 2024 1:02 PM
- URL: https://libguides.unisa.ac.za/research_proposal
5 Types of GANTT Charts for PhD
“GANTT chart is so crucial for PhDs. It helps them to divide, manage and arrange their PhD goals. Universities seek one from every student. So what are those 5 types of PhD GANTT charts that every PhDs need? Let’s find out.”
A doctorate is the highest academic honor that every graduate is willing to achieve. Unfortunately, only some can manage to go for it. The journey of PhD is full of hurdles and hassles that students are often unaware about.
It’s more an honor and thus difficult to achieve too but not impossible, certainly. Scholars often get stuck, fail and eventually drop their PhD, because of the lack of a single basic thing– planning. Every PhD is similar– Everyone has to do research, that’s it.
However, it’s so true that doing research in some fields– like life science and biology or any other STEM subject – is quite hard and lengthy. But the sheer process is the same. Students fail because they fail to structurize their work.
So how can we greatly succeed in our PhD endeavor? The answer is simple— by planning your work– not in mind, on paper actually in your daily life, for a year and the entire tenure of PhD. That looks nearly impossible, right?
Planning your entire PhD, research work and writing assignments aren’t that difficult. Using a GANTT chart or preparing your own, you can manage all the stuff easily. You can design your goals and track them for your entire PhD.
In this article, I’m gonna explain 5 types of PhD GANTT charts that every PhD student should know about.
Stay tuned.
5 Types of GANTT chart for PhD
36 months gantt chart for phd , phd gantt chart for research , gantt chart for thesis writing , gantt chart for daily schedule, progressive research chart.
Every scholar must have a 36-months (3-year) GANTT chart for their PhD. And let me tell you that universities also ask for one. So you must have it. Usually, the ideal PhD duration is 3 years, though students can ask for an extension.
Along with their research project, universities ask to submit a fully planned GANTT chart for 3 years. In this planner, you have to enlist all your goals, research work, objectives and progress you would make each month.
You have to decide and draw how much time you would give to each assignment/task. And accordingly, you have to work. Major goals in this chart would be
- Course work
- Pre-research work
- Research work
- Post-research work
- Thesis writing
- Research paper writing
- Thesis submission.
Each goal has an individual task too— For instance, during the pre-research phase one has to prepare their PhD research title, synopsis, and research project and send them for approval. I have enlisted all goals, individual tasks and time required to achieve each in this GANTT template. Download it.
Preparing this chart will help you to monitor, assist and track your PhD progress in a real-time manner. Keep in note that this is a kind of goal-achiever chart, mark each goal as “complete” you achieve.

Research has been such a crucial parameter in PhD. Every research starts with sample collection and ends with data collection. The stepwise process of PhD research included many other important steps.
One trait of research is ‘uncertainty’. Research is a highly unpredictable process, no one, literally– no one can predict the results and define the time frame. However, you have to make a time frame for your research.
Put simply, you have to allot time to every research goal, which certainly increases the probability of maximizing your chances of success. So what should be the process here?
Divide your research process into steps (our previous article will help with this). Understand the importance of each research goal and accordingly allot time. For example, 6 months for sample collection or 3 months for validation, etc.
Then go to the GANTT chart planner and prepare a chart for a research goal against the time required. You can also add other elements like real-time monitoring, color code and progress graph. That’s totally up to you.
Here I have one for you. Please visit it and download it.

This PhD research planner template would increase your chances of success.
Yet another crucial goal of any PhD is thesis writing, and it should progress simultaneously with your research. Meaning, you should have to write in your free time during/while you do lab research.
PhD thesis is a mountainous task of writing 200 pages– structured and organized assignment. Common thesis parts are– the introduction, review of literature, methodology, results and discussion, interpretation and references.
Besides many other things are also included in the thesis, to know more read this article— How to Write a PhD thesis?
As we aforesaid, research is an uncertain process but not writing. You can manage and control your PhD writing assignments by only preparing a single GANTT chart. Note that writing for PhD takes a huge proportion of your time.
So planning for writing a thesis is crucial too. Prepare a chart for thesis writing goals against the time required– For instance, 2 months for introduction, 7 months for review of the literature and so on.
Give each writing goal a different color and monitor the progress. Check out this GANTT chart for more detail.

What is the ultimate goal of any research scholar? To achieve the PhD degree, right? No. it’s to achieve the PhD degree in a given time. I.e. in three years. Hence, to complete such a huge task in a given time frame you have to manage things at a micro-level.
Zero-date planning and micro-management help you to get success in a quick time. Now, you may wonder how it’s possible. The simple answer is by planning every day, 365 days of the year 1,095 days of the entire tenure.
My ultimate advice to every PhD student who wishes to succeed in their research is to prepare and manage your daily schedule. The importance of a daily schedule and how to manage it is explained in our previous article, here it is— What should be a daily routine for PhD Students? Our proven checklist .
Plan your day on an excel sheet in the form of a GANTT chart. Try hard to follow it every day and you would see magical results in the long run. Daily planning (using this simple GANTT chart) helps every one of our PhD research students.
Prepare your daily schedule– activities you are doing, want to do and you have to do, give it a specific time and stamp it in the form of a chart. The fun part is you can use different colors to track your activities.
For example, Read if fails to achieve a goal or green for achieved goals. Take a quick look at one of my student’s GANTT daily charts.

Every PhD should have a progressive research chart there on their PhD. You have to lead it and apply to monitor how much progress you have done in your semester or in a year. It’s progressive means you have to update your goals, otherwise, it will consider it as “failed” and mark it as unachieved.
I plan to prepare one progressive and real-time chart, when you set a start and end date, it starts the tik-tik toward a deadline. I will update it later in this article.
Wrapping up
After reading all these, you wonder if it’s difficult to prepare all this stuff and manage. Let me tell you that you do not need to waste your time on such things. Just focus on your research. We already have “ready-to-use templates” in a single place.
Please visit this page to access a single or all GANTT chart. You can use it. I hope you like this article. Please share it and don’t forget to check out our templates.

Dr. Tushar Chauhan is a Scientist, Blogger and Scientific-writer. He has completed PhD in Genetics. Dr. Chauhan is a PhD coach and tutor.
Share this:

- Share on Facebook
- Share on Twitter
- Share on Pinterest
- Share on Linkedin
- Share via Email
About The Author
Dr Tushar Chauhan
Related posts.

10 Amazing Benefits of GANTT chart for PhD

How to Prepare a GANTT chart in a Google Sheet?
Leave a comment cancel reply.
Your email address will not be published. Required fields are marked *
Save my name, email, and website in this browser for the next time I comment.
Notify me of follow-up comments by email.
Notify me of new posts by email.
Proposal Template AI
Free proposal templates in word, powerpoint, pdf and more
Gantt Chart Research Proposal Template: A Comprehensive Guide + Free Template Download + How to Write it
A comprehensive guide to gantt chart research proposal template.
As a researcher, one of the essential tools in my arsenal is a well-crafted and organized research proposal . However, I often found that traditional proposal formats lacked a clear and visual representation of the project timeline and tasks. That’s why I turned to Gantt Chart Research Proposal Templates. These templates provide a structured framework for outlining the research scope, timeline, and resources required , all within the context of a Gantt chart. In this article, I will explore the importance of using a Gantt Chart Research Proposal Template , and how it differs from a standard proposal in terms of organization and visualization. So, let’s dive into the world of Gantt charts and how they can revolutionize the way we approach research proposals .
Gantt Chart Research Proposal Template
Title: the impact of social media on mental health, introduction.
The introduction should provide a brief overview of the research topic and its significance. It should also include the research question and objectives.
The growing use of social media has raised concerns about its potential impact on mental health. This research aims to investigate the relationship between social media use and mental health, with a focus on the psychological effects of excessive use and cyberbullying. The objectives of the study are to (1) assess the correlation between social media use and mental health issues, (2) identify the contributing factors to negative mental health outcomes, and (3) explore potential interventions to mitigate the negative impact of social media on mental health.
My advice on the introduction:
Ensure that the introduction clearly states the research question and objectives, and provides a compelling rationale for the study. It should effectively communicate the importance and relevance of the research topic to the audience.
Literature Review
The literature review should present a critical analysis of existing research and theories related to the topic. It should also identify gaps in the literature that the proposed study aims to address.
The literature review will examine previous studies on the relationship between social media use and mental health, including research on the potential psychological impacts of excessive use and cyberbullying. It will also explore theories and frameworks that explain the mechanisms through which social media may influence mental health outcomes. The review will highlight the gaps in the current literature, such as the need for more longitudinal studies and the exploration of potential interventions to promote positive mental health in the context of social media use.
My advice on the literature review :
Ensure that the literature review is comprehensive and critical, providing a synthesis of existing knowledge and identifying areas for further investigation. It should also demonstrate the theoretical and empirical foundation for the proposed study.
Methodology
The methodology section should outline the research design , data collection methods, and data analysis techniques . It should also provide a timeline for the proposed research activities.
This study will utilize a mixed-methods approach, combining quantitative surveys and qualitative interviews to gather data on social media use and mental health outcomes. The survey will be administered to a representative sample of social media users, while the interviews will involve individuals with personal experiences related to the research topic. Data analysis will involve statistical techniques for the quantitative data and thematic analysis for the qualitative data . The timeline for the research activities is presented in the Gantt chart below.
My advice on the methodology:
Ensure that the methodology is well-structured and aligned with the research objectives . It should provide a clear explanation of the research design and data collection procedures, as well as a realistic timeline for the proposed activities .
Gantt Chart
The Gantt chart should visually depict the timeline for the research activities, including the duration of each task and the deadlines for completion.
| Task | Duration | Deadline | |—————————-|———–|————-| | Literature review | 2 months | 10/15/2022 | | Survey design and testing | 1 month | 11/15/2022 | | Survey administration | 2 months | 01/15/2023 | | Data analysis | 3 months | 04/15/2023 | | Interview recruitment | 1 month | 05/15/2023 | | Interview data collection | 2 months | 07/15/2023 | | Data synthesis and writing | 3 months | 10/15/2023 |
My advice on the Gantt chart:
Use the Gantt chart to visually organize and schedule the research activities, providing a clear timeline for each task. Make sure to allocate sufficient time for data collection , analysis, and writing, and consider potential delays or unexpected challenges in the research process .
Download free Gantt Chart Research Proposal Template in Word DocX, Powerpoint PPTX, and PDF. We included Gantt Chart Research Proposal Template examples as well.
Download Free Gantt Chart Research Proposal Template PDF and Examples Download Free Gantt Chart Research Proposal Template Word Document
Download Free Gantt Chart Research Proposal Template Powerpoint
Gantt Chart Research Proposal Template FAQ
What is a gantt chart in a research proposal.
A Gantt chart is a visual representation of the timeline for a research project , which lays out the tasks, milestones, and timeframes for completing different aspects of the research.
How can I create a Gantt chart for my research proposal?
You can create a Gantt chart using various software tools such as Microsoft Excel, Project, or specialized project management software. There are also online Gantt chart creators that can help you build a Gantt chart for your research proposal .
What information should be included in a Gantt chart for a research proposal?
A Gantt chart for a research proposal should include tasks, start and end dates, duration of each task, dependencies between tasks, milestones, and responsible individuals or teams for each task.
Can I use a Gantt chart for my qualitative research proposal?
Yes, a Gantt chart can be useful for qualitative research proposals as well. It can help you plan and organize the various stages of your research, from literature review to data collection and analysis.
How detailed should the Gantt chart be for a research proposal?
The level of detail in the Gantt chart will depend on the complexity and duration of the research project. It should be detailed enough to provide a clear overview of the timeline and tasks involved, but not so detailed that it becomes overwhelming.
Is it necessary to include a Gantt chart in my research proposal?
While including a Gantt chart is not always mandatory, it can greatly enhance the clarity and organization of your research proposal . It demonstrates your understanding of the project’s timeline and shows that you have a well-thought-out plan for executing the research.
Can I update the Gantt chart during the course of the research project?
Yes, it’s important to regularly update the Gantt chart throughout the research project to reflect any changes in timelines, tasks, or dependencies. This will help you to stay on track and make adjustments as needed.
Related Posts:
- Research Proposal Template: A Comprehensive Guide +…
- Music Business Proposal Template: A Comprehensive…
- Academic Proposal Template: A Comprehensive Guide +…
- Fundraising Proposal Template: A Comprehensive Guide…
- Project Proposal Template: A Comprehensive Guide +…
- It And Software Proposal Template: A Comprehensive…
- Business Proposal Template: A Comprehensive Guide +…
- Proposal Template: A Comprehensive Guide + Free…
Get your demo today
/Blog%20Post/sharp_close_black_36pt_2x.png "gantt chart in phd research proposal")
Creating a Gantt Chart for Your Research Project Proposal

Crafting a successful research proposal demands careful planning. However, managing intricate projects with numerous tasks and deadlines can be challenging.
This is where the Gantt charts come into play. These powerful project management techniques offer a visual roadmap for your research proposal, transforming your intricate plan into a clear and concise document. By incorporating a Gantt chart, you not only streamline the planning process for yourself but also strengthen your proposal by demonstrating a meticulously structured and achievable project.
Let's explore the power of the Gantt chart for crafting robust research proposals and a step-by-step guide on how to create one.
Understanding Gantt Charts and their Application in Research Proposals
Gantt charts , developed by Henry Gantt, an American engineer and project management consultant, are powerful visual tools for project management. They represent project tasks as horizontal bars on a timeline, showing their duration and dependencies. This simple format provides a comprehensive overview of your research proposal development process.
In research proposals, Gantt charts are invaluable because they:
Visualize the Project Lifecycle: Understand the sequential steps involved, from literature review to data analysis and final edits.
Manage Task Dependencies: Identify tasks reliant on others' completion (e.g., data collection after finalizing research methodology).
Optimize Resource Allocation: Allocate essential resources, like software or equipment, to specific tasks within the timeline.
Crafting a Gantt Chart with Rework
Now that you understand the core functionality of Gantt charts, let's explore how to create one specifically for your research proposal. Here, we'll leverage the features of Rework.com , a comprehensive project management platform that streamlines the process.
Rework transcends the limitations of basic Gantt charts, offering functionalities that empower a more streamlined research proposal creation process. Here's how it empowers you:
Seamless Integration: Rework seamlessly integrates task management, workflow design, and progress tracking – all crucial aspects of building a strong research proposal.
Intuitive Interface: No technical expertise is required! Rework's user-friendly interface allows you to create and customize Gantt charts effortlessly.
Real-Time Collaboration: Facilitate effective teamwork and communication among your research team directly within the platform.
Streamlined Workflows: Design clear and concise workflows for each research stage, outlining tasks, deadlines, and responsible team members.
To showcase the power of Rework, let's take a brief look at what a research proposal Gantt chart might look like on the platform.

Each stage would then be broken down into specific tasks, with clear deadlines and assigned team members.
This level of organization and transparency not only strengthens your proposal but also paves the way for a smooth and efficient research journey.
Step-by-Step Guide: Constructing Your Research Proposal Gantt Chart
Having grasped the power of Gantt charts and the functionalities offered by Rework.com, let's embark on the exciting journey of building your research proposal Gantt chart! Here's a step-by-step guide to navigate the process:
1. Define Your Research Goals
This initial step lays the foundation for your entire project. Clearly outline your research topic, objectives, and desired outcomes. Having a well-defined objective will guide you in structuring the subsequent stages.
2. Break Down the Project into Stages
Identify the key stages involved in completing your research, such as literature review, data collection, data analysis, and proposal writing.
3. List Tasks Within Each Stage
Now, delve deeper into each research stage and meticulously list all the specific tasks that need to be completed. For instance, the "literature review" stage might involve tasks like identifying relevant academic databases, searching for articles, and summarizing key findings.
4. Estimate Task Durations
Allocate estimated timeframes for completing each individual task within your research stages. Consider factors like the complexity of the task and the resources available.
5. Identify Task Dependencies
Analyze the sequence of your tasks and pinpoint any dependencies. Remember the data analysis example? It can't begin until the data collection stage is complete. Mapping these dependencies in your Gantt chart ensures a smooth and logical workflow.
6. Utilize Rework's Features
Leverage the user-friendly interface of Rework to effortlessly create your Gantt chart. Input your research stages, tasks, and estimated durations. Rework will translate this information into a clear visual representation of your project timeline.
7. Assign Team Members
If you're working with a team, utilize Rework's functionalities to assign specific tasks to individual team members. This promotes accountability and ensures everyone is on the same page.
8. Track Progress & Make Adjustments
Monitor progress within Rework, identify any potential roadblocks that might arise, and be prepared to adjust your plan as needed. The flexibility of Rework allows you to adapt your Gantt chart to maintain optimal project flow.
By following these steps and utilizing Rework’s capabilities, you'll craft a robust research proposal Gantt chart. This visual roadmap not only streamlines your research journey but also presents a structured plan to potential funders or reviewers, increasing your proposal's success rate.
Advanced Techniques for Optimizing Your Research Proposal Gantt Chart
To elevate your Gantt chart's effectiveness, consider these advanced strategies:
Conditional Formatting: Implement conditional formatting within your Rework Gantt chart. This functionality allows you to utilize color coding to visually distinguish completed tasks from those nearing deadlines or overdue.
Task Annotations: Move beyond simple task listings – enrich them with context for increased clarity and professionalism. Utilize Rework's functionalities to add detailed annotations directly within your Gantt chart for each task. These annotations can incorporate specific instructions, relevant resources, or crucial reminders for team members.
Rework Reporting: Rework extends beyond Gantt chart creation; it empowers you to analyze project progress with robust reporting tools. Generate comprehensive reports that offer valuable insights into task completion rates, resource allocation, and overall project health. By identifying areas needing improvement or potential roadblocks early on, you can proactively adjust your plan and optimize research execution.
Crafting a compelling research proposal is crucial, but it doesn't have to be overwhelming. With Rework's intuitive interface and powerful features, creating a professional Gantt chart tailored to your proposal is straightforward. By leveraging Gantt charts, you'll showcase a well-structured and achievable project, increasing your proposal's impact and securing funding. Ready to streamline your research journey? Start building your Gantt chart with Rework today!
/Blog%20Post/jean-philippe-delberghe-75xPHEQBmvA-unsplash-1.jpg)
Cut costs with Rework. Do more with less.
/Blog%20Post/cta-image.png)

- All archive
- Mental Health
- Soft Skills
- Project Management
- For Switzerland
- Social Media
Select Page
Guidelines to draw a timeline of your PhD
2018 Nov 20 | Resource , Soft Skills | 0
In a previous article I talked about how project management can help reduce PhD students’ anxieties . Most of my PhD I felt very much confused. Sometimes I could not even say whether I was still in the beginning, somewhere in the middle or close to the end of it. Therefore, I suggested that supervisors and students should try to define a tangible objective early on in the doctoral process, and that they should have regular check-point meetings to adjusts plans in order to keep the student’s project on track. I also mentioned that it is highly important to clarify what the supervisors and students long-term expectations are .
In another article I talked about Gantt charts , a great project management tool to draw and visualize a project outline.
Do you see where we’re going here? Let’s draw a timeline of your PhD in the shape of a Gantt chart! I know, it’s in the title ;)
In this other article about Gantt charts, I explained that there are some drawbacks to keep in mind. Indeed, upfront planning techniques like Gantt charts tend to lack flexibility and when things don’t work as planned it can actually increase the feeling of failure, which is exactly what we want to avoid here.
So, does it even make sense to draw a timeline early on in the doctoral process? I believe it does! We can keep the drawbacks of Gantt charts in mind and draw such a timeline if we define guidelines of how to use it .
- Example & download
- Why draw a timeline?
- Guidelines for how to make & use the timeline throughout your PhD
1. Example & download:
I draw below an example for the institute where I did my PhD: the Institute of Biology at the University of Fribourg in Switzerland. Therefore, it is designed for a 4-year PhD program with annual committee meetings and for students who spend a lot of time performing lab experiments . However, it can be easily adapted to any field or any doctoral program.
You can download for free the Excel file I used to make this timeline by clicking here .
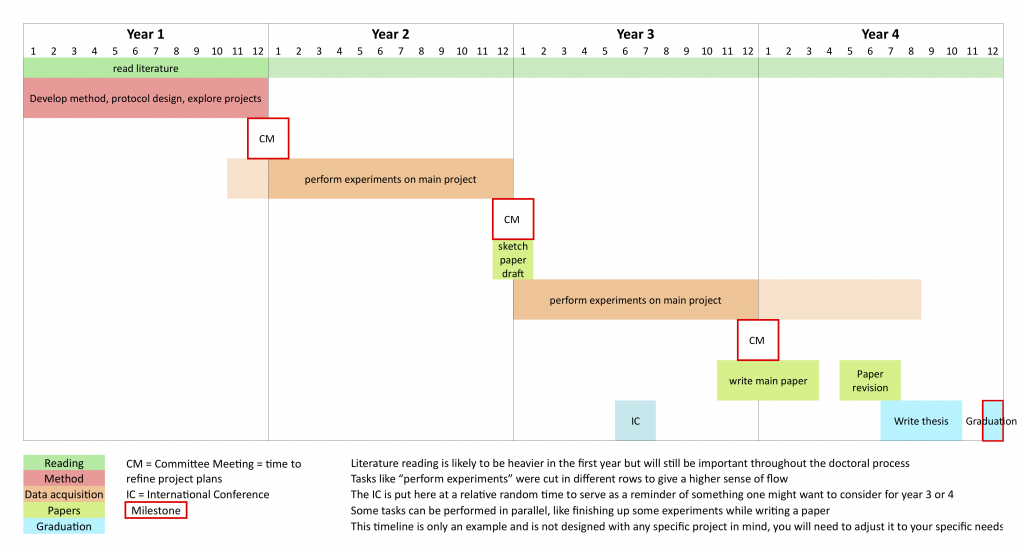
Because I want this to be a general example but also because it is such a long time scale, I kept the level of detail to the minimum to make it flexible and to avoid over-planning . The time for each task here is a very rough estimate, it is meant to be adapted to what you think is best for you or to what is expected in your doctoral program. Importantly, the uncertainty level is increasing with time . You don’t have to start writing a paper on the 11th month of your third year, maybe you’ll start much earlier or much later and it will be perfectly fine. This is just a broad overview to help visualize what the main steps are, but their exact length or when they should start will get clarified once you are closer to it.
2. Why draw a timeline?
To draw such a timeline and for it to be realistic and useful, you are going to ask very concrete questions, to yourself and to your supervisor , like what are the important steps, what are the milestones (technical milestones for developing a protocol, committee meetings, exams…), what are the risks, do you have only one project or do you have more, maybe one large risky project and one smaller safer project, and all other questions which are relevant to you.
Project management is effective if concrete questions are openly discussed. If your supervisor doesn’t bring up these questions with you, it might feel quite scary for you to ask for it. To help you find the courage to so, I believe that having such a timeline will provide you a highly visual and attractive medium to foster these discussions.
When I learned about Gantt charts at the beginning of my second year of PhD studies, I draw myself such a timeline, but I didn’t dare to discuss it with my supervisor. With no surprise things really didn’t work out the way I planned it. Supervisors by default have more experience than a junior PhD student so they should know better what is realistic, what is expected and how much upfront planning can be done depending on the project.
3. Guidelines for how to make & use the timeline throughout your PhD:
- I suggest that you draw a first version within the first two months of your PhD . But it’s never too late to start =)
- Take my example and adjust it , maybe you already have a clearly defined project, maybe not, maybe you don’t need to design a new method, maybe you’ve been included in someone else project with a clear short-term objective, maybe you think you should start drafting a paper earlier, go and adjust it to what feels right to you.
- Make sure to keep in mind that this chart is going to change many times until you graduate, stay flexible. This first timeline should only be an overview of the main steps which you expect in your PhD. It is here to give a direction, and if used regularly it can give a feeling of moving forward.
- Schedule a meeting with your supervisor to discuss this initial timeline ( still within the first two months ), ask the maximum of questions, clarify the maximum of points and make sure you both agree.
- Then whenever needed, go back to it and adjust it, maybe there is a great collaboration opportunity and for a few months you’ll be asked to put your main project aside and work fully on this collaboration, maybe your new protocol is working great and you’re already getting publishable data, maybe the protocol is not working well and you need to change strategy, how does it affect your timeline?
- Whenever a big change happens or whenever you feel too lost, schedule an extra meeting with your supervisor to specifically discuss the timeline and the long-term objectives. Hopefully it should give you a feeling of being on a track, even if it’s not the first one you pictured.
- I would suggest having such a discussion at least every 6 months .
This timeline is now a tool which is going to grow with you throughout your PhD. At first it is a rough overview of the main steps, if you keep it update with what you really do, at the end it will be a true overview of everything you’ve accomplished. Therefore, on top of guiding you through it, it will become a great tool to look back at your PhD experience once you’re finished.
Thanks for reading and I hope these ideas can help you :)
Make sure to read my previous article about Gantt charts where I explained that it can be used both for long-time scale like here, or on shorter time scale (like 2 months) with a higher level of detail.
Looking for more reading about project management for research? Have a look at the resource I made Project Management resource for PhD students and supervisors !
If you subscribe to the newsletter you’ll get my articles in full text directly in your inbox, no need to come on the website anymore, you might miss out my great pictures though… ^^
Thanks! Please check your email inbox or spam folder and click the link to confirm your subscription.
Related Posts

General info about Academic Funding for ECR in Switzerland

Where can I find soft skills training in academia?

Managing professional relationships

You’re an academic facing unemployment in Switzerland? The BNF is here to help you
Leave a reply cancel reply.
Your email address will not be published. Required fields are marked *
Subscribe to the newsletter
This site uses Akismet to reduce spam. Learn how your comment data is processed .
A Guide for Using Gantt Chart for Research Project
Are you embarking on a research project and feeling overwhelmed by the complexity of managing your tasks and timelines? Fear not! In this comprehensive guide, we will explore the power of Gantt charts for research projects. From crafting a research proposal to executing your project, Gantt charts can be your best friend. Let's dive into the world of Gantt charts and discover how they can streamline your research journey.
Understanding Gantt Charts for Research Projects
Before we delve into the practical aspects of using Gantt charts for research projects, let's start with the basics. What exactly is a Gantt chart, and how can it benefit your research endeavors?
What is a Gantt Chart?
A Gantt chart is a visual representation of a project schedule that displays tasks, their durations, and the relationships between them. This tool was originally developed by Henry L. Gantt in the 1910s, and it has since become a staple in project management across various fields, including research.
Benefits of Using Gantt Charts for Research Projects
- Clarity and Visualization: Gantt charts provide a clear and visual overview of your research project, making it easier to understand the sequence of tasks and their dependencies.
- Task Organization: You can break down your research into manageable tasks and allocate time for each one, ensuring that you stay on track.
- Timeline Management: Gantt charts help you set realistic deadlines and track your progress, preventing delays and ensuring you complete your project on time.
- Resource Allocation: You can allocate resources such as personnel, equipment, and funding to specific tasks, optimizing your research efficiency.
- Communication: Gantt charts are excellent communication tools. They allow you to share your project timeline with team members, advisors, or stakeholders, fostering transparency and collaboration.
Now that you understand the benefits of using Gantt charts for research projects , let's explore how to implement them effectively.
Creating a Gantt Chart for Your Research Proposal
Before you can dive into your research project, you'll likely need to prepare a research proposal to outline your objectives, methodology, and timeline. This is where a Gantt chart can be incredibly useful.
Step 1: Define Your Research Objectives
Begin by establishing a clear and concise delineation of your research goals and purposes.
What do you aim to achieve, and what are the key milestones? Break down your research into specific tasks or phases, such as literature review, data collection, analysis, and report writing.
Step 2: Identify Task Dependencies
Next, identify the dependencies between tasks. Certain tasks might require completion before others can commence. For instance, you might need to finish data collection before you can start data analysis. These dependencies will help you create a logical sequence for your Gantt chart.
Step 3: Estimate Task Durations
Estimate the duration of each task or phase. Be realistic in your estimates, considering factors like the complexity of the task and the resources available. It's better to overestimate than underestimate, as this will help you avoid unexpected delays.
Step 4: Create Your Gantt Chart
Now, it's time to create your Gantt chart . You can use specialized project management software like Microsoft Project, Excel, or online tools like Slikk.ai, Asana, or even dedicated Gantt chart software. In your Gantt chart, each task is represented as a horizontal bar, and the length of the bar corresponds to the task's duration. Task dependencies are indicated by the order of the bars.
Step 5: Review and Refine
Once you've created your initial Gantt chart, review it carefully. Ensure that it aligns with your research proposal and that the timeline is feasible. Make adjustments as needed.
Step 6: Share Your Proposal and Gantt Chart
Share your research proposal and Gantt chart with your advisor, committee members, or anyone involved in your project. Their feedback can be invaluable in refining your plan and ensuring its feasibility.
With your research proposal and Gantt chart in hand, you're ready to embark on your research project. But the journey doesn't end here; Gantt charts are equally essential for project execution and management.
Managing Your Research Project with Gantt Charts
As you transition from the proposal stage to the actual execution of your research project, your Gantt chart becomes a dynamic tool to keep you on track. Here's how to effectively manage your research project using Gantt charts:
Task Allocation
Assign specific tasks to yourself and your team members if applicable. Each person's responsibilities should be clearly defined in the Gantt chart. This ensures accountability and prevents confusion.
Timeline Monitoring
Regularly update your Gantt chart to reflect the progress of your project. As tasks are completed, mark them as such and adjust the timeline if necessary. If any delays occur, identify the reasons and take corrective action.
Resource Management
Keep an eye on resource allocation. Are you running low on a particular resource? Do you need to reallocate resources to meet project demands? Your Gantt chart can help you make informed decisions.
Communication and Collaboration
Share your Gantt chart with your team and stakeholders. It serves as a common reference point for everyone involved, fostering effective communication and collaboration. It's much easier to discuss project status and adjustments when you have a visual representation.
Risk Management
Identify potential risks to your project's timeline and address them proactively. If you anticipate delays or obstacles, have contingency plans in place. Your Gantt chart can include these contingencies, providing a safety net for your project.
Celebrate Milestones
As you reach important milestones in your research, take the time to celebrate your achievements. This not only boosts morale but also serves as a motivator for the next phase of your project.
Tips for Using Gantt Charts Effectively
To make the most of Gantt charts for your research project, here are some additional tips:
- Keep It Simple: While Gantt charts can become complex for large projects, strive to keep yours as simple as possible. Too much detail can make it difficult to read and maintain.
- Regular Updates: Don't let your Gantt chart become stagnant. Regularly update it to reflect the current status of your project.
- Use Colours: Use colors to differentiate tasks or highlight critical paths in your Gantt chart. This makes it easier to spot important information at a glance.
- Be Realistic: Set realistic deadlines and durations. Overloading your schedule can lead to burnout and project failure.
- Collaborative Tools: Consider using collaborative project management tools that allow multiple team members to update the Gantt chart in real time.
- Training: If you're working with a team, ensure that everyone understands how to read and update the Gantt chart. Offer training if necessary.
In the world of research projects, where meticulous planning and execution are paramount, Gantt charts are indispensable tools. They offer clarity, organization, and control over your project's timeline, making them essential for both research proposals and project management.
By following the steps outlined in this guide and implementing Gantt charts effectively, you'll be better equipped to tackle your research project with confidence. From defining your objectives to celebrating your achievements, Gantt charts are your trusty companions on the journey to research success.
So, the next time you embark on a research project, remember the power of the Gantt chart. It's not just a tool; it's your roadmap to research excellence. Happy researching!
Related articles
The future of hr: how human resources management systems are revolutionizing the workplace, managing multiple projects in your startup using slikk.ai, tracking key performance indicators (kpis) in your startup with slikk.ai, top project management software for marketing agencies in 2023, how slikk emerges as the ultimate time tracking software for agencies, one platform to boost productivity and collaboration.
Slikk helps you get more tasks done in less time. It's everything you need to work faster, communicate better, and improve productivity in a single workspace.

Get started
- Project management
- CRM and Sales
- Work management
- Product development life cycle
- Comparisons
- Construction management
- monday.com updates
How to use a Gantt chart for a research project
Using a Gantt chart for a research project can give all stakeholders a better understanding of timelines and the resources needed for each task. With all project activities neatly laid out within a timeline and every minor detail accounted for, a Gantt chart provides your team with the framework for successful project operations.
In this article, we’ll discuss a Gantt chart and how you can use it in a research project to maximize efficiency and promote greater transparency. We’ll also share how you can use monday.com’s project management Work OS to simplify the management of any research project further.
What is a Gantt chart?
A Gantt chart is a bar chart popularized in the early 1900s by Henry Gantt. It lets you establish a detailed project plan according to when you need each task completed.
If done correctly, a Gantt chart creates a realistic time frame for a project by establishing a start date for the whole project and each task. Then, you can pair these start dates with an estimation of how long the task will take, broken down by days, weeks, or months.
What makes a Gantt chart unique is that it establishes dependency relationships between all relevant tasks, which can help you better understand necessary workflows.
For example, let’s say you’re creating a research proposal. One of your tasks is to promote awareness and garner support for the proposal on social media. However, before you can do that, you need to create informational materials you can distribute and have the proposal outline ready for viewing. Since these necessities are clearly outlined in the Gantt chart, you can plan your project timeline accordingly.
How can you use a Gantt for research projects?
Research projects are vast undertakings that require a lot of your time, effort, and brain power. Sometimes it’s easy to get sidetracked or confused about what comes next in your research or how you should put it together.
A clear understanding of objectives and deadlines can help you organize even the most complex research project undertakings. Even better, a Gantt chart provides clear step-by-step instructions with dependency relationships marked to ensure every team member understands their responsibilities.
A Gantt chart ensures all research project team members clearly understand objectives, deadlines, and task dependency relationships.
Best practices for planning and scheduling a research project
Understanding the best practices for planning and scheduling a research project can help you get the most out of your Gantt chart . A few best practices include:
- Have a clear goal : Before sitting down to plan your research project, ask yourself some crucial questions. What are you trying to achieve? Why are you trying to achieve it? When do you need to complete it?
- Use scheduling tools : Use task and resource scheduling tools when possible to reduce the risk of human error.
- Get the team involved : Gather your team together for a brainstorming session, if possible, when developing a list of tasks required to meet your final objective.
- Consider dependency relationships : Consider the dependency relationships between objectives carefully and be realistic about time frames. Ensuring your team has enough time to successfully and thoroughly complete each task from the beginning sets your research project up for success.
- Identify potential issues : Identify risks and potential roadblocks in your schedule and have a backup plan for each to ensure a steady workflow with minimal pushbacks.
- Consider resource requirements : Consider the resources necessary to complete each task. Remember to include work hours as resources and schedule each team member appropriately to achieve objectives in the desired time frame.
- Plan for reporting : Assign specific times, or interval periods, for progress reports and compare these with your initial estimations. If these reports show alterations are necessary, don’t be afraid to make changes.
- Identify KPIs : Before the research project begins, identify key performance metrics and track them as you go to define your success clearly. You may find using a relevant tool or platform the easiest way to track performance metrics.
Having the right tools can increase efficiency, decrease downtime, and ensure objective deadlines are not only met but exceeded.
Managing research projects on monday.com
monday.com’s robust project management Work OS makes managing research projects easier by:
- Centralizing projects from start to finish : Our Work OS lets you centralize all projects from conception to completion, with customizable dashboards that show you the information you deem most important. Quickly assess risks, bottlenecks, and roadblocks to keep your research project moving forward.
- Streamlining project workflows : Streamline workflows by automating routine tasks and assigning teammates to the work they’re most qualified for. Then, track individual and project-wide progress in real-time with regular task updates. Use color coding to make task management even more straightforward.
- Enabling communication across teams : Our Work OS promotes communication between project members and across different teams, so all stakeholders know where things stand at all times. You can share documents, leave notes, and work together in real-time for more effective communication that allows you to exceed every deadline and meet every objective.
monday.com can provide your team with a Gantt chart view to make project management easier. Get started with monday.com’s powerful Work OS by building a research project workflow from scratch or try a few of our other templates for managing research projects easier.
Related templates
A basic Gantt chart can help you plan your research project in detail. On monday.com, you can add a Gantt View to any type of project board. Below are some of our recommended templates from our Template Center that you can use to fine-tune other essential aspects of your research project.
Keyword power tools template
Our Research Power Tools Template uses a Gantt chart format to help you visualize project timelines, manage project resources, and monitor each phase of your research projects from one platform.
Publication and journals template
Our Publications and Journals Template is an excellent tool for content publishing companies. You can use our template to:
- Manage your publication process: Our template enables whole-process management from submission to approval. Easily track article status and monitor writer workload to ensure you meet publishing deadlines.
- Visualize your publishing pipeline: Customizable dashboards allow you to receive a high-level overview of all current and upcoming articles and where they stand.
- Track individual contributions: Ensure each writer meets minimum contributions and isn’t given too large a workload by tracking individual contributions.
By now, you should have a working idea of Gantt charts and how they increase transparency and efficiency in project management. However, if you still have questions, we’ve answered a few FAQs below.
How do you create a dissertation in a Gantt chart?
To create a Gantt chart for a dissertation, you should first understand your timeline and deliverables. Once you’ve written these down, create detailed task lists of how you’ll accomplish each deliverable and consider dependency relationships between each. Finally, use the Gantt chart to outline your dissertation from start to finish.
What should be in a dissertation timeline?
In a dissertation timeline, you should include the following:
- Role assigning (if applicable)
- Research tasks
- Experiments, social or scientific (if applicable)
- Data collection and analysis
- First draft completion
- Submission to the advisor (first) and dean (at completion)
How do you create a Gantt chart in Word?
You can create a Gantt chart in Microsoft Word by:
- Opening a new Word document
- Change the document orientation from vertical to horizontal
- Insert a bar graph into your document
- Make format alterations as necessary to make the graph look like a Gantt chart
- Insert information and customize as necessary
Any team can increase transparency in their research projects with monday.com
Using a Gantt chart to create a detailed project timeline can help increase transparency and promote greater efficiency in your organization’s research projects.
When you pair a Gantt chart with monday.com’s robust project management system, you have the tools you need to meet deadlines, complete objectives, and exceed expectations.
Send this article to someone who’d like it.
My PhD journey in a Gantt chart incl. Open Science practices
Plan and monitor your PhD with a Gantt chart and include all of your activities in implementing Open Science practices to ensure efficiency and societal impact of your research work and efforts.
This Gantt chart provides you with an example and template plan for your Ph.D. from thesis proposal writing to the thesis defense.
Live spreadsheet: https://docs.google.com/spreadsheets/d/1mcOWgD1GQq294E8rBM_WQHz38ipUxFoa4unbaigONkw/
Start with planning your Holidays and annual leave - as this gets usually neglected and difficult to catch up on as your thesis progresses. The row for unforeseen absences from work will be empty to start with, but you will likely fill some cells as you progress, and Life happens. Having this section in the chart allows you to adjust your timeline accordingly. In your weekly calendar, also highlight public holidays of the country you work and live in and perhaps also your home country’s holidays, in case you want to plan for leave during that time to visit family and friends.
The ‘ Thesis ’ components range from proposal writing, preregistration, data management, thesis writing, and finally to defense. For a more detailed breakdown, add the explicit projects and experiments/studies with their respective workflow steps. In doing so, you will have a more realistic image of the time you have available to juggle two or more experiments and projects at a time during your thesis.
In the ‘ Events ’ section, you can list and map conferences you would like to attend, research and field visits, bar camps, retreats, and other work-related happenings.
Under ‘ Publications ’ goes everything you can make available to the public and/or other researchers under open publishing practices - Open Access, openly licensed, and as restricted as necessary or feasible. Manuscripts can be published both as so-called ‘preprint articles’ and if need be submitted to a journal. Choose the journal based on the scope of your work matching the journal’s scope of research fields and topics and if it has reasonably priced publishing fees (aka APC = article processing charges) if any. Preregistrations, research manuscripts (preprints), datasets, posters, presentations, images a.o. can all be published on field-/region-specific or generalist cross-disciplinary open repositories. Methods and protocols can equally be shared in public repositories or at https://www.protocols.io/ .
Finally, also add any coursework you participate in within the scope of your Ph.D.
In case of any questions about your available courses, contact us at https://calendly.com/access2perspectives/free-exploratory-session
Connections
- Hide Description
workflow bar chart

Gantt Chart Research Proposal
Proposal maker.

The #YouOnlyLiveOnce mindset thrives in the spirit of spontaneity and adventure. Although it can be fun, #YOLO will spell disaster outside the party scene. It is a terrible career and life advice that is equivalent to flushing your time and resources down the toilet. Smart and strategic project planning is the spine of every successful academic or business undertaking. Whether you are a student or a professional, you will benefit from mapping out your projects with Gantt charts and other progress-tracking illustrations. We have prepared the following pointers that will help you on your next big move.
21+ Gantt Chart Research Proposal Templates
Gantt charts are a useful productivity apparatus for project management. They are a bar chart derivative for task scheduling and progress tracking. The user plots the activity progress along the y-axis, with respect to the indicated time on the x-axis. The leftmost column contains the list of tasks while the top row displays project dates in uniform intervals. This chart is useful in visualizing the schedule of activities for your research proposals . When you use Gantt charts, you can monitor if your project goals are in sync with the actual work timeline.
1. Restaurant Gantt Chart Template

- Google Docs
- Google Sheets
Size: A4 & US Letter Sizes
You see the potential of a trend in increasing the revenue for your restaurant. How do you convince the management that your plan will work? Other than persuasive and well-researched content, your market research plan should contain a feasible work timetable. A realistic schedule of activities ensures that your proposed project is not just theoretical and that investing in it would not be a waste of resources. A Gantt chart works best for project timelines because it makes the project’s progress easy to monitor and relay. Add this template to your market research proposal!
2. Free Excel Gantt Chart Template

Size: A4 & US Sizes
The early Gantt charts were successful even before computers became mainstream in offices. Back then, you had to draw the charts manually. This means that when there would be revisions to the project proposals , you are required to recreate the entire diagram. The success of Gantt charts would not have survived the rigors of modern workspaces if there was no computer program for them. Fortunately, we have programs like Microsoft Excel and Apple Numbers where we can amend details without scrapping the entire chart. Get this free Gantt chart template now!
3. Free Progress Gantt chart with Events Template

There would be times that our project advisers would need a quick update on the progress of our research study. Give them a fast rundown of the development with this Gantt chart template! It gives a quick overview of the pace of the activities through percentage. It has a simple interface simple and is easy to navigate. You can also use this template when you’re presenting the progress of a specific task and its subtasks. Are you worried that adding a new activity might overlap with your previous assignments? Avoid that with this downloadable template!
4. Free Yearly Project Management Gantt Chart Template

Research, especially when it is an individual project, will challenge a person’s organization and project management competence. You will need to complete one task before you can proceed to another in your methodology . If you lag on one of your tasks, there will be a domino effect, and you will fall behind schedule. Even though some research studies can take a whole year or more, people usually find themselves short of time. Do not fall prey to this by being committing to a realistic schedule. Get started with this yearly Gantt chart template!
5. Free Sales Activity Gantt Chart Template

Instead of just plotting your research activity progress with respect to project dates, you can also monitor how much of the work is done! Although this is a sales activity template, you can use the same format for your research proposal . Each task is listed in the first column, while the percentage measures the amount of work done. With this monitoring format, you can picture the development of your research and the momentum of the activities. Boost your productivity with this free Gantt chart template now!
6. Free Marketing Plan Chart Template

With this Gantt chart template, make sure that you don’t fall behind your target deadlines again! The layout is specific down to the weeks of the month. You will be able to indicate at which week your research team started and completed the task. Did you hit the time allotted for each activity? The expected duration is placed next to the activity column for reference. You can use this template to present the schedule of events in your research proposal. The best part is that unlike other charts, you can keep updating this timeline during the entire project!
7. Free Basic Gantt Chart Template

The construction of the Hoover Dam started in 1931 and finished ahead of schedule. During the planning and construction, engineers referred to Gantt charts to keep track of the progress. Today, the charts are useful in different fields that need progress-tracking and project forecasts. It is helpful in your research proposals because you can define the timeline of your research as well as continually update the document for revisions. It is a reliable organization tool that you shouldn’t be sleeping on. Make use of such convenience in your research proposal with this template!
8. Free Monthly Gantt Chart Template

Gantt charts are an indispensable tool for project management. It gives you a birds-eye view of the entire research progress. Are you running out of time? Which of the following tasks can you adjust the schedule for? You can refer to it when you need to add or modify the activities. Monitor your progress better from start to end with this editable template! The design looks professional, and it won’t clash with the formality of your document. The landscape orientation lets you include more details into your timetable.
9. Research Proposal Gantt Chart Template

Size: 35 KB
10. Qualitative Research Proposal Gantt Chart Template

Size: 42 KB
11. Research Proposal Timeline Gantt Chart Template

Size: 38 KB
12. Nursing Research Gantt Chart Template

Size: 34 KB
13. Marketing Research Gantt Chart Template

14. Thesis Proposal Gantt Chart Template

Size: 30 KB
15. Sample Proposal Gantt Chart Template

Size: 37 KB
16. Medical Research Gantt Chart Template

17. Dissertation Research Gantt Chart Template

Size: 43 KB
18. Dissertation Proposal Gantt Chart Template

19. Business Research Gantt Chart Template

Size: 33 KB
20. Ph.D. Plan Gantt Chart

Size: 630 KB
Gantt charts are being used in doctoral dissertations as well. The attached PDF file is an example of a research timeline of a Ph.D. candidate. Most Gantt charts are in a landscape format to accommodate more content. The proponent structured his semestral schedule of activities in a monthly-basis. The designation of each main goal with different colors is smart. The chart shows that the proponent performed various activities under different goals per semester. Without a physical map, it is hard to picture the progress of his tasks. Like this Ph.D. candidate, organize your research endeavors with a Gantt chart!
21. Survey Planning Gantt Chart Sample

Size: 262 KB
Surveys are one of the effective methods of obtaining relevant information to answer queries. Despite its practicality and capacity to provide reliable data, the method isn’t a one-step process. You wouldn’t want to spend your resources on information that isn’t worth its price. You have to make sure that you get the right answers. You have to test the survey design first to a few people. Then there is still data analysis and report of findings. Is this method suitable for your research given the time available? Gain a reliable foresight by including a Gantt chart for your research proposal! Refer to this sample chart for guidance!
22. Task Gantt Chart Template

Size: 286 KB
A crammed research paper is not a good research paper . In the academe, students are given due dates to fulfill parts or sections of their thesis. Manage your deadlines well by tabulate your tasks and progress. By doing so, you can budget your time and adjust your working pace. Supplement your school hustle with a Gantt chart! It can be as straightforward as this sample, but its rewards on your scholastic performance are priceless!
Text prompt
- Instructive
- Professional
Generate a proposal for a new school recycling program
Compose a proposal for a school field trip to a science museum.
Example of Gantt Chart For Research Proposal
February 6, 2020
Dr Jana Martiskova
Click here to place an order for topic brief service to get instant approval from your professor.
Table of Contents
Gantt Chart For Research Proposal
Are you looking example of a Gantt Chart for a Research Proposal?
Do you know how to set up a gantt chart for the research proposal.
If you don’t know how to set up one then this article is definitely for you because here you will find a sample Gantt chart idea. The easy sample Gantt chart For Research Proposal given below describes the method break down in a very simple and effective way.
By following the steps you will very easily be able to construct your own chat on a research proposal in just a couple of hours. Learn how to personalize your work in the following steps given below. The sample can help you in formatting any types of chart models that you need to insert in your important projects.
Get customized research proposal along with Gantt Chart from our experts at a 25% discount and 100% chance to get approved
Find out about your projections in business strategies related to market fluctuations by following this chart.
By means of this chart, a proper analysis can be drawn out based on projected sales level in the market or these charts can easily be used as a plan out weekly timetable.
These projections just help to show any kind of breakdown that’s needed, it can be in days or weeks, or in a price commodity.
Learning these simple ways of making them, will not just clear the whole concept of the proposal you wish to put forward, but also help in selecting your instrument for approach in your dissertation,
The Gantt Chart has two sides showing, one is for the weaker side projection and the other is for any kind of increase in the value or percentage even shows progress on it.
This Gantt Chart For Research Proposal will always have a central point which is its balance level, and it can predict things on the basis of bar colors. You can easily make them by referring to the samples below.
EASY WAYS TO CONSTRUCT YOUR OWN GANTT CHART FOR ALL-PURPOSE
These websites have collected data from a specimen from many researchers on the basis of the social and commercial needs of the chart. You can refer to them for developing your own easy-to-go chart for multi-purpose.
Follow the guide to get yourself the best and easy tips to build your own Gantts Chart for research purposes.
Sample Gantt chart
That was a practical example for you to make a Gantt chart for a research proposal of your own. Just make sure, you are not using it as it is. Follow clicks by clicking to get your own Gantt Chart For Research Proposal.

That was a practical example for you to make a Gantt chart for a research proposal of your own. Just follow the easy steps to build the desired chart for your personal research or any other proposal, you are not using it as it is.
Paid Topic Mini Proposal (500 Words)
You will get the topics first and then the mini proposal which includes:
- An explanation why we choose this topic.
- 2-3 research questions.
- Key literature resources identification.
- Suitable methodology including raw sample size and data collection method
- View a Sample of Service
Note: After submitting your order please must check your email [inbox/spam] folders for order confirmation and login details. If the email goes in spam please mark not as spam to avoid any communication gap between us.
Get An Expert Dissertation Writing Help To Achieve Good Grades
By placing an order with us, you can get;
- Writer consultation before payment to ensure your work is in safe hands.
- Free topic if you don't have one
- Draft submissions to check the quality of the work as per supervisor's feedback
- Free revisions
- Complete privacy
- Plagiarism Free work
- Guaranteed 2:1 (With help of your supervisor's feedback)
- 2 Instalments plan
- Special discounts
WhatsApp and Get 35% off promo code now!
The Research Whisperer
Just like the thesis whisperer – but with more money, how to make a simple gantt chart.
In every grant application, I want to see a simple visual guide (a Gantt chart ) that shows what you are planning to do. It is the perfect time to plan your project clearly. It shows the assessors that you have thought about your research in detail and, if it is done well, it can serve as a great, convincing overview of the project.
Clearly, these charts are hard to do. If they were easy, more people would do them, right?
Here are five steps to create a simple guide to your research project.
1. List your activities
Make a list of everything that you plan to do in the project. Take your methodology and turn it into a step-by-step plan. Have you said that you will interview 50 people? Write it on your list. Are you performing statistical analysis on your sample? Write it down.

Check it against your budget. Everything listed in the budget should also be listed on your uber-list? Have you asked for a Thingatron? Note down that you will need to buy it, install it, commission it… What about travel? Write down each trip separately.
2. Estimate the time required
For each item on your list, estimate how long it will take you to do that thing. How long are you going to be in the field? How long will it take to employ a research assistant? Realistically, how many interviews can you do in a day? When will people be available?
Initial meeting: about 3 weeks to find a time. Desk audit: 4 months. Draft key elements: about 1 week each. Testing: about 1 week each, but can start organising as soon as first element is drafted. Write up: 2 months. Final report: no time, really – just need to find a time to meet.
Generally, I use weeks to estimate time. Anything that takes less than a week I round off to a week. Small tasks like that will generally disappear from the list when we consolidate (see Step 4). Then I group things together into months for the actual plan.
3. Put activities in order
What is the first thing that you are going to do? What will you do next? What will you do after that?
In the comments, Adrian Masters provided some great questions to help with this stage: What do I need to do by when? What do I need from others & when? How do I check that I am still on track?
One by one, put everything in order. Make a note of any dependencies; that is, situations where you can’t do one thing until another is started or finished. If the research assistant is going to do all the interviews, then the interviews can’t start until the research assistant is hired.
Where possible, you should eliminate as many as possible dependencies. For example, if you can’t find a decent research assistant, you will do the fieldwork yourself (but that might mean that work will be delayed until you finish teaching). It isn’t a necessary step to getting your time-line in order, but it is good project management practice.
In the comments, Amy Lamborg pointed out that you might want to work backwards . If you have a fixed end date, you might want to “…build back towards the project start date, then jiggle everything until it fits !” If you want an example of this, have a look at the post “ Work backwards “. It is about writing an application, but the principle of starting with the fixed end date and working backwards still applies.
4. Chunk it up
Now that you have an ordered list, and you know how long everything will take, you need to reduce the list without losing any specificity. At the same time, if you are combining tasks, you might want to add a bit of time as a contingency measure.
Meet with partners: 3 weeks. Review data protection regimes: 4 months. Draft three key elements: 3 months. Test three key elements: 3 months, with some overlap. Analyse test results and report: 3 months.
How you divide up your time depends on your project. If it is only one year long, you might list items by month. If your project is three years long, then you might list items by quarter. If you are planning over five years, you might break it down to six-month periods.
5. Draw me a picture
If you use project management software to manage your project, and you are comfortable with it, then use it to produce a summary of your project, too.
Most project management software (e.g. like Microsoft Project) will allow you to group activities into summary items. Chunk your tasks into major headings, then change the time interval to your months, quarters, half-years, or whatever you have chosen to use.
Or you can just draw it up with word-processing software (which is what I always do), spreadsheet software, or even hand-draw it.

Frankly, I don’t care – as long as it ends up in your application!
Also in the ‘simple grant’ series:
- How to write a simple research methods section .
- How to make a simple research budget .
Share this:
62 comments.
This is useful. I’m writing my first SERIOUS research proposal for my PhD. Obviously not something I’ve ever done before so all advice is greedily welcome.
My best advice – write something quickly and then get someone else to look at it. I’m a big fan of quick iterations to get started.
Your readers might be interested in Tom’s Planner ( http://www.tomsplanner.com ). It’s a very easy tool to help you create a schedule or project plan (and there is a free version). On our blog we have a bunch of guest blogs about planning your thesis or dissertation with a template and example to help you get started.
The free version is a farce you cannot print, export or do anything but view it online. So don’t waste time with this product it is not a real proof of concept.
Sometimes, when the chunks are too big, you end up failing to understand what’s in those chunks, then your estimate ends up WAY off when you realize the extra work you didn’t consider might go into a give task.
That looks like a useful technique for getting the right information together for a Gantt. I’d be interested in any techniques for step 5. It’s something I’ve done recently as part of my first year PhD report and I wrote about how I produced my Gantt chart here: http://phdtools.blogspot.com/2011/08/creating-gantt-charts.html
I can’t imagine many people use MS project to manage their entire PhD (I could be wrong?) therefore it seems a bit excessive to use it just for a Gantt chart. Equally I find Excel plots look a bit naff and it’s difficult to show linkages between items.
“I’m not looking for a tool to perform PERT or CPM or do resource levelling for me.”
Absolutely! I just want to plug in my info and get a simple image out. How hard is that?
I’m not a big fan of big-iron project management tools either. More time seems to go into managing the information than getting actual work done.
I do think that most group projects that are going to last twelve months or more could do with a simple project management tool, though. I’m a bit of a fan of Basecamp , even if it doesn’t draw Gantt charts.
Of course, everybody has to understand the tool and want to use it, which is a different matter.
Thanks for the post.
I’m currently trying my hand at project management software, but I seem to find it easier to simply write down stuff in a piece of paper before committing it to electronic format. Anybody else has the same issue?
Absolutely, Carlos. As someone who has managed a big project that included spending a lot of time wrangling MS Project, I’m a big fan of just scribbling it down on paper and then mocking it up in MS Word.
[…] How do you create a Gantt chart? The best advice we have seen is at the useful Research Whisperer blog, where they list 5 steps to creating your very own Gantt Chart in the post ‘How to make a simple Gantt chart’. […]
Excellent introduction to project planning. I’ve seen recent examples of project managers jumping into MS Project without this level of thinking, with predictable results.
Questions that should help (and which you would need to answer anyway when asked by seeking funding or approval) include: What do I need to do by when? What do I need from others & when? How do I check that I am still on track?
Build those answers into the simple paper approach above, and you’ll have covered the critical project basics (activities, resources, dependencies, scheduling, milestones and checkpoints)
Like Liked by 1 person
Thanks, Adrian.
I liked your questions so much, I added them into the original post. 🙂
An Excel bar chart is pretty much all you need to create a Gantt chart. Unless of course you intend to explore resourcing and costs.
Your info really helped me by doing my D.T ( Design Technology) homework. Thank You 🙂 Eirene Masri From Jordan, Amman
Thanks for your comment. It made me smile. 🙂
I haven’t been to Jordan for a very long time, but I had a great time when I was there.
[…] that you are going to do? What will you do next? What will you do after that? In the comments, Adrian Masters provided some great questions to help with this […]
Thanks for this particular piece of ‘whisper’… I was in a dire need of a ‘quickie’ method to make a simple Gantt Chart. 😀
Cheers, Yan London
No worries, Yan. Happy to help.
[…] Jonathan. “How to make a simple Gantt Chart” The Research Whisperer. 13 September […]
I have just gone through.Iam also planning to undertake a phd programme and would want to recieve guild as i make progress using gantt Chart
Reblogged this on Queer Fear: Alternative Gothic Literary and Visual Cultures and commented: Stumbled across this useful piece on the use of Gantt charts in research projects. I realise this may seem rather common knowledge to scientists but as a Arts and Humanities-based person I found it gave useful insights for new researchers.
Thanks, Hanoconnor.
I suspect that there are plenty of science people who don’t get any formal training in this, either.
good job. very helpful
[…] Read More At: https://theresearchwhisperer.wordpress.com/2011/09/13/gantt-chart/ […]
This is my first time using a Gantt chart in research paper.. hmm. thanks for the info. 🙂
Gantt charts are really useful. Thanks for posting this information about gantt charts. This is a very informative post and very helpful, too.
Thanks Jonathan. I have just completed my first Gantt chart for my Doctorate in Health. I was beginning to get a bit jumpy about some of the very involved instructions I had found previously so your ‘idiots guide’ was really helpful.
No worries, Ade.
Happy to help. Good luck with your doctorate.
I have been using a Gantt chart to plan and track my doctorate since I began last year. It’s just an Excel spreadsheet but suits my purposes, very simple. One thing I’ve found useful us to mark all the highlighted cells bright blue initially, for ‘future action’. Each week, I update that week’s column to green (completed) or red (overdue). This gives me good feedback not only about where I need to change the priorities on my current ‘to do’ list, but is a very satisfying display of how much I’ve already done.
I love Excel, postgradpanda. I reckon that seeing the blue change to green would be very satisfying.
Thanks for this.
[…] https://theresearchwhisperer.wordpress.com/2011/09/13/gantt-chart/ […]
Thanks for this. It helped me alot for doing our work schedule in research for short allotted time.
Ohh Thank God Jonathan for that!! you have no idea how much you saved my life.. I was having a real hard time planning my first ever research proposal Loved it alot.. Looking forward for much guidance along the path!!!
Sruti… (From a far far away land.. INDIA)!! 🙂
Thanks, Sruti
Happy to help.
Sruti was right. It’s very helpful to me as well. Saves me a lot of trouble. Keep it up Jonathan.
No worries, Paul
Are you a commercial representative for Ganttic, or did you link to them because you like them? Just wondering.
[…] published a short article about doing research in academia. Some of their articles are mundane (How to make a simple Gantt chart), whereas others are more esoteric (Hashing it over) and heartfelt (Academic […]
[…] out your timeline and your budget. Working up a Gantt chart for your project will force you to think about how long different phases of the project will take. This is important […]
list any six elements that go into the format of a research report?
Hi abukamara
I don’t have a set list. It depends who your audience is, and what sort of report you are writing.
I’m usually helping people to write grant applications, where the format is set by the funding agency. They make it pretty simple, really – they generally tell you exactly what they want.
[…] logframe analysis is well worth reading, while the Research Whisperer explains how to make a simple Gantt chart. And Mind Tools overviews a range of project scheduling tools as does this from MIT. Over at […]
[…] take you three or maybe three-and-a-half years. However, PhDs in my area rarely follow the sort of gantt chart anybody approving funding, ethics clearance or candidature milestones might approve. A tangent I […]
[…] How to make a simple Gantt chart – Jonathan O’Donnell. […]
Jonathan, i suppose that you should try more intuitive service) My experience in project management tells me there are a lot of comlicated tools such as MS Project. After years of searching and trying (Wrike, Liquid Planner, Smartsheet) i start using GanttPRO, especially because of its simplicity and high visibility. So try GanttPRO to facilitate workflow.
[…] O’Donnell, J 2011, How to make a simple Gantt chart, The Research Whisperer, weblog, 13 September, viewed 23 April 2017, < https://theresearchwhisperer.wordpress.com/2011/09/13/gantt-chart/> ;. […]
[…] research design is important. Following the steps outlined in O’Donnell’s (2011) blog How to make a simple Gantt Chart, I constructed this graph and a risk matrix to ensure that my time was used efficiently. […]
[…] Other tips on Gantt charts, including how to make one manually: https://theresearchwhisperer.wordpress.com/2011/09/13/gantt-chart […]
Thanks Jonathan! I am a grant writer, and your post is a great reminder that I should probably make a timeline visually appealing, like your hand-made Gantt. I’m going to do it!
I wanted to point out that for a grant funded project (which often has a specified end date by which the money must be spent), I often find myself making a timeline backwards. That is, I start creating the timeline from the specified end date, and then ask myself the questions that Adrian Masters posed: What do I need to do by when? What do I need from others & when? I build back towards the project start date, then jiggle everything until it fits!
BTW, did you know that in your text descriptions of the example timeline, the time is in weeks, but in your Gantt chart the time is in months? I have a feeling that you really meant for these to match….
Like Liked by 2 people
Thanks, Amy
This article has been viewed over 150,000 times, and you are the first person to point out the weeks / months issue. I’ve fixed it now (although it is a bit of a bodge).
I agree with the backwards process, so much so that I wrote a post about it: Work backwards . It is about the grant writing process, but the principle is the same.
This particular instance was one of those rare times when I truly didn’t have an end date, and could work out the actual time the project would take (surprise – it took longer).
I’ve added a bit into the post about working backwards. Thanks for that.
Proofreading touchdown? You just made my day! Thanks for this, and for Research Whisperer in general. I am probably not really your intended audience, but I get a lot of value from all the posts. You-all do good work!
[…] Research Whisperer. (2016). How to Make a Simple Gannt Chart.[online] Available at: https://theresearchwhisperer.wordpress.com/2011/09/13/gantt-chart/ [Accessed 14 Mar. […]
[…] O’Donnell, J 2011, ‘How to make a simple Gantt chart’, The Research Whisperer, 13 September, viewed 13 April 2018, < https://theresearchwhisperer.wordpress.com/2011/09/13/gantt-chart/> ;. […]
[…] you know how to make a simple Gantt […]
[…] How to make a simple Gantt chart: This article provides steps on making a Gantt chart (generally, not specific for PhD). […]
[…] “How to Make a Simple Gantt Chart,” by Jonathan O’Donnell on The Research Whisperer […]
[…] analysis of all their blog search terms. His analysis showed lots of people were looking for how to make a simple Gantt Chart. Jonathan’s excellent analysis left me wondering: what do readers think is ‘high value […]
If your university has the Microsoft suite of programs Viso (I think it is called) is easy to learn the basic functions to make a Gantt and the nice thing is that when you change a date the program moves the bars for you so fewer errors 🙂 winning.
Thanks, Wendy. Good advice.
[…] complex, messy, and not as linear as suggested by the timeline of activities we outline in project Gantt charts. During my doctorate, there were twists and turns as I made decisions around which literature to […]
[…] webinars should I register for? What about grants? Reading groups? Mentoring? How exactly does a research GANTT chart work (or does it)? How can I get research and writing done without sacrificing my entire summer on […]
[…] my various projects. This method was originally inspired by two academic Gantt chart enthusiasts (one, two). However, I found that the traditional way of setting up a gantt chart (with the projects on […]
Leave a comment Cancel reply
This site uses Akismet to reduce spam. Learn how your comment data is processed .

- Already have a WordPress.com account? Log in now.
- Subscribe Subscribed
- Copy shortlink
- Report this content
- View post in Reader
- Manage subscriptions
- Collapse this bar
- How it works

Gantt Chart for Dissertation – Important Ingredient for Dissertation Success
Published by Ellie Cross at January 26th, 2023 , Revised On October 9, 2023
A dissertation is an important part of academic life. You may have spent a lot of time thinking about it, researching it, and writing it. And because of that, you want to put your best foot forward.
You want to make sure that your dissertation is well-organized, easy to read, and compelling. One way you can do this is by using a Gantt chart for your dissertation.
Gantt Chart for Dissertation
The Gantt chart is one of the most important and useful tools for dissertation writing or even in project management. It enables the planner to develop a detailed schedule showing all the planned work, activities, milestones, and deliverables.
The Gantt chart is not just a simple table with dates, but it is a graphical representation of a project plan that can be used to show relationships between tasks. For example, the Gantt chart shows when something has to be done and how long it takes to finish this task. It also shows how long other tasks take before they can start or after they are completed.
The basic concept behind the Gantt chart is that there must be sufficient time allocated for each task within a given time scale so that there is no interference between different tasks being carried out simultaneously by students.
With the help of a research Gantt chart , you can create a visual roadmap that shows how your project will be completed. This is especially important when you have many tasks to complete.
When Using a Gantt Chart for a Dissertation?
Gantt charts are really helpful for project management. It is often used in business management, engineering and construction, software development, and other fields where projects must be managed.
Sometimes, it is possible to use these charts even if there are no deadlines set for your tasks. This can be useful if you want to understand how much time different types of activities take and how they affect each other.
We use them because they help us visualize our workload and plan our resources accordingly:
- They help us see which activities depend on each other so we can better coordinate them.
- They allow us to see what parts of our project are delayed easily.
- They show whether or not we have enough resources at our disposal.
- They help us decide when we should reschedule some activities if necessary.
How Can ResearchProspect Help?
ResearchProspect writers can send several custom topic ideas to your email address. Once you have chosen a topic that suits your needs and interests, you can order for our dissertation outline service which will include a brief introduction to the topic, research questions , literature review , methodology , expected results , and conclusion . The dissertation outline will enable you to review the quality of our work before placing the order for our full dissertation writing service!
How to Create a Gantt Chart
Creating a Gantt chart for a dissertation is simple. First, you need to enter your task names, durations, and start dates into an Excel spreadsheet and then use the built-in tools to insert a Gantt chart. There are the following steps:
- Start with a blank Gantt chart and customize it according to your needs.
- Add tasks in the form of boxes that represent activities in your project plan. If more than one person is involved in an activity, add lines between them for each step in the process.
- Add resources (people or equipment) by clicking on the “Resources” tab at the top of the page, selecting from a drop-down menu, or typing in a name manually if you know it already. You can also search for specific names from here if needed and assign resources to tasks by clicking on them once they’ve been added.
- Use different colours for each task or phase of your project. This makes it easy to see at a glance whether each phase is on track or behind schedule.
Dissertation Planning Template
You can plan your dissertation with the dissertation planning template. This is not a strict structure. It is just a guide. You can adapt it to suit your needs as long as you clearly understand what you want to achieve before you start writing.
The Dissertation Planning Template has Five Main Sections:
Introduction – and overview of the problem and why it is important.
Research question(s) – clearly defined research questions will be investigated during the project.
Objectives – specific objectives that need to be met to achieve the research goals. These may include several smaller objectives (e.g., data collection methods).
Literature review – an analysis of existing literature related to your topic and any gaps in understanding. This section should also include any relevant theory (e.g., theories from other disciplines) and methodologies used within those disciplines which could be applied to your project (if applicable).
Methodology – an outline of how you will address each research objective in relation to your chosen methodology.
Why Choose a Dissertation Gantt Chart Template?
There are many reasons why you would want to use a Gantt chart for a dissertation template rather than creating one yourself:
They Save Time
Creating a dissertation Gantt chart takes time, effort, and knowledge using Microsoft Excel or PowerPoint software. Therefore, you may find it easier to use an existing template instead of creating one from scratch if you do not have much experience with these programs.
They Look Professional
Gantt chart templates will make your final presentation look more professional using the best dissertation.
Gantt Charts Help Prevent Problems from Arising.
By using a Gantt chart template, you can spot potential problems before they arise. Such as missing deadlines or conflicting tasks and taking action immediately.
Frequently Asked Questions
What is a gantt chart for a dissertation.
A Gantt Chart for a dissertation is a visual timeline that outlines the research tasks, milestones, and deadlines. It helps students plan and manage their dissertation projects efficiently.
You May Also Like
Achieving a 95% on your dissertation? We reveal insider tips & discuss if it’s even possible. Aim for dissertation excellence!
From 10,000 to 20,000 words for undergraduates, 15,000 to 50,000 words for masters, and 50,000 to 100,000 words or more for PhD.
Find out all you need to know about paraphrasing and how paraphrasing is essential in essay and assignment writing here.
USEFUL LINKS
LEARNING RESOURCES

COMPANY DETAILS

- How It Works
Gantt Chart Templates for Research Project Proposals
Are you a project manager with an upcoming research proposal to tackle? If so, there's no doubt that constructing a Gantt chart is essential for your success. Not only do they provide visibility into the timeline of any project, they also offer insights into resources and dependencies needed to achieve goals on time. We know how challenging it can be to create this type of complex chart manually, which is why we've compiled a list of our favorite Gantt charts templates specifically designed for research projects! Read on to learn more about each template and how incorporating them into your workflow will benefit you or your team.
Project Roadmap Gantt Chart Template

The Project Roadmap Gantt Chart Template by ClickUp is a must-have for any research proposal. This simple, clear template allows you to map out the entire project from start to finish in an easy-to-follow format. With this template, it's easy to visualize tasks and deadlines, resources required and dependencies between tasks. Plus, with its built-in integration with Google Sheets, you can easily and quickly share your project timeline with other stakeholders.
Try Template
Business plan gantt chart template.

If you're creating a research project proposal for a business, the Business Plan Gantt Chart Template by ClickUp is the perfect tool. This professional-looking template provides a visual representation of your timeline and includes key milestones to help plan your proposal. Not only can you track progress at each stage of the process, but it also allows you to easily adjust timelines if deadlines shift or resources become unavailable. It's the perfect solution for a business project proposal plan!
Project Deliverables Gantt Chart Template

Don't let your research proposal slip through the cracks! The Project Deliverables Gantt Chart Template by ClickUp is the perfect tool for managing deadlines and tasks associated with any project. This template helps you track progress at each stage of the process, ensuring that all deliverables are met on time and within budget. Plus, its intuitive design allows you to quickly make changes as needed, without sacrificing accuracy. Make sure your research project is a success with the Project Deliverables Gantt Chart Template!
Waterfall Project Management Proposal Gantt Chart Template

The Waterfall Project Management Proposal Gantt Chart Template by ClickUp is the perfect tool for any project manager. This template is specifically designed to help you manage complex tasks in a sequential manner, so that each task is completed one-by-one without any overlap. With this template, it's easy to plan out the timeline of the project, as well as tasks and resources needed throughout the process. Make sure your research proposal is a success with this template!
Construction Management Plan Gantt Chart Template

The Construction Management Plan Gantt Chart Template by ClickUp is the perfect tool for managing large-scale construction projects. This template helps you keep track of all tasks, resources and deadlines associated with a project from start to finish. Plus, its intuitive design makes it easy to adjust timelines as needed without sacrificing accuracy or detail. Make sure to present this during your next project proposal, to ensure success!
Related Templates
- Project Proposal Whiteboard Template
- Gantt Proposal Template
- Creative Agency Proposal Template
- Campaign Proposal Template
- Marketing Proposal Template
One app to replace them all
24/7 support
Weekly updates
Secure and compliant
99.9% uptime
- Affiliate & Referrals
- Product Roadmap
- On-Demand Demo
- ClickUp University
- Consultants
- Gantt Chart
- Native Time Tracking
- Automations
- Integrations
- Kanban Board
- vs Airtable
- vs Basecamp
- vs MS Project
- vs Smartsheet
- Software Team Hub
IMAGES
VIDEO
COMMENTS
Steps involved in creating a Gantt chart for PhD studies. Step 1: List all the deliverables expected of your PhD program. In this example, the PhD program has the following requirements: Coursework, divided into 4 modules each lasting 2 weeks. All 4 modules need to be completed within the first year of study.
The 'Proposal Submission' milestone, set for May 15, 2024, marks the conclusive stage, signifying the submission of the crafted and refined research proposal for evaluation and potential implementation. Hurray, You Did It! And there you have it! Your Research Project Proposal Gantt Chart is now complete. Make your own Gantt chart in Gleek.
Creating a PhD timeline Gantt chart in Microsoft PowerPoint . Manually creating a PhD timeline Gantt chart in PowerPoint is a bit easier than in Excel. Therefore, I will explain the process here. First, you need to open a blank PowerPoint slide. Then click on Insert (1.), then Chart (2.). A popup will appear.
Example Gantt chart for a USA PhD. Here are some common steps involved in completing a PhD, which I'll use to create the Gantt chart: Year 1. ... Research Proposal: Develop a full research proposal including methodology. Qualifying Exams: Exams to transition from a Ph.D. student to a Ph.D. candidate.
Some University departments require students to create a Gantt chart to represent a schedule for the research project. The Gantt chart shows the timelines of the various steps of the project including their dependencies and any resources needed.In other words, the chart depicts when an event is supposed to take place in your project by providing an outline regarding the order in which the ...
The image of 36 months GANTT chart plan for a PhD. PhD GANTT chart for research . Research has been such a crucial parameter in PhD. Every research starts with sample collection and ends with data collection. The stepwise process of PhD research included many other important steps. One trait of research is 'uncertainty'.
A Comprehensive Guide to Gantt Chart Research Proposal Template. As a researcher, one of the essential tools in my arsenal is a well-crafted and organized research proposal.However, I often found that traditional proposal formats lacked a clear and visual representation of the project timeline and tasks. That's why I turned to Gantt Chart Research Proposal Templates.
Having grasped the power of Gantt charts and the functionalities offered by Rework.com, let's embark on the exciting journey of building your research proposal Gantt chart! Here's a step-by-step guide to navigate the process: 1. Define Your Research Goals. This initial step lays the foundation for your entire project.
How to Propose/Report PhD Research progress with Gantt Charts! #GanttChart #PhDProductivity #PhDTips (long title)MANAGE PHD PROJECTS WITH GANTT CHARTS | In t...
Guidelines for how to make & use the timeline throughout your PhD. 1. Example & download: I draw below an example for the institute where I did my PhD: the Institute of Biology at the University of Fribourg in Switzerland. Therefore, it is designed for a 4-year PhD program with annual committee meetings and for students who spend a lot of time ...
Hi! This is my first ever video and I talk about one of my favourite planning tools: The Gantt Chart! This is an introductory video and I made this as an aid...
Step 4: Create Your Gantt Chart. Now, it's time to create your Gantt chart. You can use specialized project management software like Microsoft Project, Excel, or online tools like Slikk.ai, Asana, or even dedicated Gantt chart software. In your Gantt chart, each task is represented as a horizontal bar, and the length of the bar corresponds to ...
You can create a Gantt chart in Microsoft Word by: Opening a new Word document. Change the document orientation from vertical to horizontal. Insert a bar graph into your document. Make format alterations as necessary to make the graph look like a Gantt chart. Insert information and customize as necessary.
Tips on managing stress. Try not to worry about things outside your control. Identify the sources of stress in your life (stressors) Talk to someone (friend, supervisor, University. counsellor ...
Plan and monitor your PhD with a Gantt chart and include all of your activities in implementing Open Science practices to ensure efficiency and societal impact of your research work and efforts. This Gantt chart provides you with an example and template plan for your Ph.D. from thesis proposal writing to the thesis defense. Start with planning ...
21+ Gantt Chart Research Proposal Templates. Gantt charts are a useful productivity apparatus for project management. They are a bar chart derivative for task scheduling and progress tracking. The user plots the activity progress along the y-axis, with respect to the indicated time on the x-axis. The leftmost column contains the list of tasks ...
The easy sample Gantt chart For Research Proposal given below describes the method break down in a very simple and effective way. By following the steps you will very easily be able to construct your own chat on a research proposal in just a couple of hours. Learn how to personalize your work in the following steps given below.
The Benefits of Using a Dissertation Gantt Chart. No one knows the feeling of sitting in front of a blank whiteboard, trying to figure out how to write a dissertation. The process can seem daunting and overwhelming, but using a Gantt Chart can make the entire process much easier. A Gantt Chart is simply a chart that helps you plan and track ...
Draft key elements: about 1 week each. Testing: about 1 week each, but can start organising as soon as first element is drafted. Write up: 2 months. Final report: no time, really - just need to find a time to meet. Generally, I use weeks to estimate time. Anything that takes less than a week I round off to a week.
A Gantt chart is a great way to visually "explain" your project timeline in a grant proposal. This may be called a "Project Timeline" or "Project Schedule" in a proposal. ... Research Center B. ONLINE PRESENCE Create project website by January 10, 2011. It will be updated continuously throughout the grant period.
The Gantt chart is one of the most important and useful tools for dissertation writing or even in project management. It enables the planner to develop a detailed schedule showing all the planned work, activities, milestones, and deliverables. The Gantt chart is not just a simple table with dates, but it is a graphical representation of a ...
The Project Roadmap Gantt Chart Template by ClickUp is a must-have for any research proposal. This simple, clear template allows you to map out the entire project from start to finish in an easy-to-follow format. With this template, it's easy to visualize tasks and deadlines, resources required and dependencies between tasks.
Image 2 of 2. PhD Planning Gantt Chart Excel Template. $5.00. For the cost of a single coffee, gain access to my Gantt chart template, designed to help you to stay on top of your PhD commitments and be more effective when organising your projects! This simple yet dynamic excel template can be used to map out your remaining PhD duration, predict ...