This site uses cookies to optimize functionality and give you the best possible experience. If you continue to navigate this website beyond this page, cookies will be placed on your browser. To learn more about cookies, click here .

The Monitoring and Evaluation Toolkit
This section asks:
What is a case study?
- What are the different types of case study ?
- What are the advantages and disadvantages of a case study ?
- How to Use Case Studies as part of your Monitoring & Evaluation?

There are many different text books and websites explaining the use of case studies and this section draws heavily on those of Lamar University and the NCBI (worked examples), as well as on the author’s own extensive research experience.
If you are monitoring/ evaluating a project, you may already have obtained general information about your target school, village, hospital or farming community. But the information you have is broad and imprecise. It may contain a lot of statistics but may not give you a feel for what is really going on in that village, school, hospital or farming community.
Case studies can provide this depth. They focus on a particular person, patient, village, group within a community or other sub-set of a wider group. They can be used to illustrate wider trends or to show that the case you are examining is broadly similar to other cases or really quite different.
In other words, a case study examines a person, place, event, phenomenon, or other type of subject of analysis in order to extrapolate key themes and results that help predict future trends, illuminate previously hidden issues that can be applied to practice, and/or provide a means for understanding an important research problem with greater clarity.
A case study paper usually examines a single subject of analysis, but case study papers can also be designed as a comparative investigation that shows relationships between two or among more than two subjects. The methods used to study a case can rest within a quantitative, qualitative, or a mixture of the two.

Different types of case study
There are many types of case study. Drawing on the work of Lamar University and the NCBI , some of the best-known types are set out below.
It is best not to worry too much about the nuances that differentiate types of case study. The key is to recognise that the case study is a detailed illustration of how your project or programme has worked or failed to work on an individual, hospital, school, target community or other group/ economic sector.
- Explanatory case studies aim to answer ‘how’ or ’why’ questions with little control on behalf of researcher over occurrence of events. This type of case studies focus on phenomena within the contexts of real-life situations. Example: “An investigation into the reasons of the global financial and economic crisis of 2008 – 2010.”
- Descriptive case studies aim to analyze the sequence of interpersonal events after a certain amount of time has passed. Studies in business research belonging to this category usually describe culture or sub-culture, and they attempt to discover the key phenomena. Example: Impact of increasing levels of funding for prosthetic limbs on the employment opportunities of amputees. A case study of the West Point community of Monrovia (Liberia).
- Exploratory case studies aim to find answers to the questions of ‘what’ or ‘who’. Exploratory case study data collection method is often accompanied by additional data collection method(s) such as interviews, questionnaires, experiments etc. Example: “A study into differences of local community governance practices between a town in francophone Cameroon and a similar-sized town in anglophone Cameroon.”
- Critical instance : This examines a single instance of unique interest, or serves as a critical test of an assertion about a programme, problem or strategy. The focus might be on the economic or human cost of a tsunami or volcanic eruption in a particular area.
- Representative : This relates to case which is typical in nature and representative of other cases that you might examine. An example might be a mother, with a part-time job and four children, living in a community where this is the norm
- Deviant : This refers to a case which is out of line with others. Deviant cases can be particularly interesting and often attract greater attention from analysts. A patient with immunity to a particular virus is worth studying as that study might provide clues to a possible cure to that virus
- Prototypical : This involves a case which is ahead of the curve in some way and has the capacity to set a trend. A particular African town or city may be a free bicyle loan scheme and the experiences of that town might suggest a future path to be followed by other towns and regions.
- Most similar cases : Here you are looking at more than one case and you have selected two cases which have a preponderance of features in common. You might for example be looking at two schools, each of which teaches boys aged from 11-15 and each of which charges similar fees. They are located in the same country but are in different regions where the local authorities devote different levels of resource to secondary school education. You may have a project in each of these areas and you may wish to explain why your project has been more successful in one than the other.
- Most dissimilar cases : these are cases which are, in most key respects, very different and where you might expect to find different outcomes. You might for example select a class of top-ranking pupils and compare it with a class of bottom-ranking puils. This could help to bring out the factors that contribute to or detract from academic success.
Advantages and Disadvantages of Case Study Method
- It helps explain how and why a phenomenon has occurred, thereby going beyond numerical data
- It allows the integration of qualitative and quantitative data collection and analysis methods
- It provides rich (or ‘thick) detail and is well suited to capturing complexities of real-life situations and the challenges facing real people
- Case studies (sometimes illustrated with quotations from beneficiairies/ stakeholder and with photographs) are often included as boxes in project reports and evaluations, thereby adding adding a human dimension to an otherwise dry description and data.
- Case studies may offer you an opportunity to gather evidence that challenges prevailing assumptions about a research problem and provide a new set of recommendations applied to practice that have not been tested previously.
Disadvantages
- Case studies may be marked by a lack of rigour (e.g. a study may not be sufficiently in-depth or a single case study may not be sufficient)
- Single case studies may offer very little basis for generalisations of findings and conclusions.
- Case studies often tend to be success stories (so they may involve a degree of bias).
Where to next?
Click here to return to the top of the page, here to return to step 3 (Data checking) and here to see a short worked example of a metrics-based evaluation.
- UoN Digital Repository Home
- Journal Articles
- Faculty of Engineering, Built Environment & Design (FEng / FBD)
Monitoring and evaluation: an urban project case study in Kenya
Collections.
- Faculty of Engineering, Built Environment & Design (FEng / FBD) [1463]
Academia.edu no longer supports Internet Explorer.
To browse Academia.edu and the wider internet faster and more securely, please take a few seconds to upgrade your browser .
Enter the email address you signed up with and we'll email you a reset link.
- We're Hiring!
- Help Center

Monitoring and Evaluation in the Public Sector: A Case Study of the Department of Rural Development and Land Reform in South Africa

Since the publication of the Government-Wide Monitoring and Evaluation Policy Framework (GWM&EPF) by the Presidency in South Africa (SA), several policy documents giving direction, clarifying context, purpose, vision, and strategies of M&E were developed. In many instances broad guidelines stipulate how M&E should be implemented at the institutional level, and linked with managerial systems such as planning, budgeting, project management and reporting. This research was undertaken to examine how the „institutionalisation‟ of M&E supports meaningful project implementation within the public sector in South Africa (SA), with specific reference to the Department of Rural Development and Land Reform (DRD&LR). This paper provides a theoretical and analytical framework on how M&E should be “institutionalised”, by emphasising that the IM&E is essential in the public sector, to both improve service delivery and ensure good governance. It is also argued that the M&E has the potential to support meaningful implementation, promote organisational development, enhance organisational learning and support service delivery.
Related Papers
James Malesela
The global context provides an important platform for governments to build and sustain their M&E systems by adopting the best practices and lessons. Monitoring and evaluation (M&E) in South African government has gradually been recognised as a mechanism to enhance good governance. The advent of framework for the government-wide M&E inculcates a culture of reflection and importance of keeping track of the policy, programme or project implementation. M&E form an indispensable part of public management and administrative tools accessible for managers to improve the business processes of the institution. M&E therefore provides a significant panacea for the growing pressure on the institutions to enhance good governance. The principles of good governance comprise accountability, transparency, rule of law, public participation, responsiveness and effectiveness. These principles correlate precisely with the values governing public administration enshrined in the Constitution of the Republic of South Africa, 1996. They serve as standards and indicators to monitor and measure performance. The relevance of monitoring, evaluation and good governance in Public Administration is inevitable. M&E cuts across the generic administrative and managerial functions of public administration while good governance demonstrates/exhibits the outcome of functional M&E.
Niringiye Ignatius
Philipp Krause
Roan Neethling , daniel meyer
The 1994 democratic rule and Constitution of 1996 shaped the way in which service delivery would be transformed in South Africa. This was done by developing new structures and policies that would ultimately attempt to create equity and fairness in the provision of services within the municipal sphere to all residents. This article analyses the perceptions of business owners regarding the creation of an enabling environment and service delivery within one of the best performing municipalities in Gauteng: the Midvaal Local Municipal area. A total of 50 business owners were interviewed by means of a quantitative questionnaire. Data were statistically analysed by using descriptive data as well as a chi-square cross tabulation. The results revealed that the general perception of service delivery is above acceptable levels. However, in some categories the business owners were less satisfied regarding land use and zoning process and regulations. Overall, the business owners felt that the local government was creating an enabling environment for business to prosper. No significant statistical difference was found regarding perceptions of service delivery and the enabling environment, between small and large businesses in the study area. This type of analysis provides the foundation for improved service delivery and policy development and allows for future comparative analysis research into local government. The research has also placed the relationship between good governance, service delivery and the creation of an enabling environment in the spotlight.
Zwelibanzi Mpehle
Gerrit Van der Waldt
Paschal ResearchTrainers
Lebogang L Nawa
The institutionalisation of cultural policy has, to date, become an effective tool for cultureled development in some parts of the world. South Africa is yet to fully embrace this phenomenon in its developmental matrix. While the government has introduced certain strategies, such as the Integrated Development Plan (IDP), to coordinate its post-apartheid development imperatives across all of its spheres, role players, such as politicians, town planners and developers, continue to carry on with their subjective approaches to development, without culture as the mediator. This perpetuates the fragmentation of spatial landscapes and infrastructure networks in these areas along racial and cultural lines. This article suggests that South Africa may benefit from formulating local, cultural policies for the revitalisation of decaying cities into new integrated, liveable and vibrant residential, business and sporting environs.
The principal question this study aims to answer is why and how a left-of-centre government not hobbled by heavy external leverage, with developmental state precedents, potentially positive macroeconomic fundamentals, and well-developed alternative policies for housing and urban reconstruction came to settle on a conservative housing policy founded on ‘precepts of the pre-democratic period’. Arguably, this policy is even more conservative than World Bank strictures and paradigms, whose advice the incoming democratic government ‘normally ignored’ and ‘tacitly rejected’. The study, which spans the period from the early 1990s to 2007, commences from the premise that housing is an expression and component of a society’s wider development agenda and is bound up with daily routines of the ordering and institutionalisation of social existence and social reproduction. It proposes an answer that resides in the mechanics and modalities of post-apartheid state construction and its associated techniques and technologies of societal penetration and regime legitimisation. The vagaries and vicissitudes of post-Cold War statecraft, the weight of history and legacy, strategic blundering, and the absence of a cognitive map and compass to guide post-apartheid statecraft, collectively contribute to past and present defects and deformities of our two decade-old developmentalism, writ large in our human settlements. Alternatives to the technocratic market developmentalism of our current housing praxis spotlight empowering shelter outcomes but were bastardised. This is not unrelated to the toxicity of mixing conservative governmentalities (neoliberal macroeconomic precepts, modernist planning orientations, supply-side citizenship and technocratic projections of state) with ‘ambiguated’ counter-governmentalities (self-empowerment, self-responsibilisation, the aestheticisation of poverty and heroic narratives about the poor). Underscored in the study is the contention that state developmentalism and civil society developmentalism rise and fall together, pivoting on (savvy) reconnection of economics and politics (the vertical axis of governance) and state and society (the horizontal axis). Without robust reconfiguration and recalibration of axes, the revamped or, more appropriately, reconditioned housing policy – Breaking New Ground – struggles to navigate the limitations of the First Decade settlement state shelter delivery regime and the Second Decade’s (weak) developmental state etho-politics. The prospects for success are contingent on structurally rewiring inherited and contemporary contacts and circuits of power, influence and money in order to tilt resource and institutional balances in favour of the poor. Present pasts and present futures, both here and abroad, offer resources for more transformative statecraft and sustainable human settlements, but only if we are prepared to challenge the underlying economic and political interests that to date have, and continue to, preclude such policies. History, experience and contemporary record show there are alternatives – another possible and necessary world – via small and large steps, millimetres and centimetres, trial and error.
RELATED PAPERS
UCT Master's Dissertation Series no. 5
Pieter U Pretorius
Myo Naing , Anne Mc Lennan
Jacob Fatile
Masters Degree Thesis
Stephen Baguma
Zukiswa Kota , Monica Hendricks , Eric Matambo
David Schaub-Jones
IOSR Journals
Kobus Muller , daniel meyer , Malcolm Wallis , Jacobus S Wessels , Liezel Lues , Xolile Thani , Thandi Matsiliza , melody brauns , Frederik M Uys
Rick de Satgé
Sonia Bakweleng Malapane
chris landsberg
Shikha Vyas-Doorgapersad
Inge Amundsen
Fanie Cloete
Carmen Alpin
Andrea Juan
Globalizations 12 (2)
The Future of Evaluation
Laila El Baradei , Nermine Wally , Doha Abdelhamid
Anil Kanjee , Yusuf Sayed
Tam O'Neil
African Evaluation Journal
Development Bank of Southern AfricaOperations …
Cherrel Africa
Francois B van Schalkwyk , Stefaan Verhulst , Glenn Maail , Piovesan Federico , Silvana Fumega
BRIDGE, IDS, Brighton
Bridget Byrne
Liz David-Barrett
Dr C L Pieterse
Ross R Worthington
Thabang Mpande
Victoria Awiti
Tristan Gorgens
University of Sussex. Doctoral thesis
Blanca Lopez
Robert Cameron
RELATED TOPICS
- We're Hiring!
- Help Center
- Find new research papers in:
- Health Sciences
- Earth Sciences
- Cognitive Science
- Mathematics
- Computer Science
- Academia ©2024
- Case Study Evaluation Approach
- Learning Center
A case study evaluation approach can be an incredibly powerful tool for monitoring and evaluating complex programs and policies. By identifying common themes and patterns, this approach allows us to better understand the successes and challenges faced by the program. In this article, we’ll explore the benefits of using a case study evaluation approach in the monitoring and evaluation of projects, programs, and public policies.
Table of Contents
Introduction to Case Study Evaluation Approach
The advantages of a case study evaluation approach, types of case studies, potential challenges with a case study evaluation approach, guiding principles for successful implementation of a case study evaluation approach.
- Benefits of Incorporating the Case Study Evaluation Approach in the Monitoring and Evaluation of Projects and Programs
A case study evaluation approach is a great way to gain an in-depth understanding of a particular issue or situation. This type of approach allows the researcher to observe, analyze, and assess the effects of a particular situation on individuals or groups.
An individual, a location, or a project may serve as the focal point of a case study’s attention. Quantitative and qualitative data are frequently used in conjunction with one another.
It also allows the researcher to gain insights into how people react to external influences. By using a case study evaluation approach, researchers can gain insights into how certain factors such as policy change or a new technology have impacted individuals and communities. The data gathered through this approach can be used to formulate effective strategies for responding to changes and challenges. Ultimately, this monitoring and evaluation approach helps organizations make better decision about the implementation of their plans.
This approach can be used to assess the effectiveness of a policy, program, or initiative by considering specific elements such as implementation processes, outcomes, and impact. A case study evaluation approach can provide an in-depth understanding of the effectiveness of a program by closely examining the processes involved in its implementation. This includes understanding the context, stakeholders, and resources to gain insight into how well a program is functioning or has been executed. By evaluating these elements, it can help to identify areas for improvement and suggest potential solutions. The findings from this approach can then be used to inform decisions about policies, programs, and initiatives for improved outcomes.
It is also useful for determining if other policies, programs, or initiatives could be applied to similar situations in order to achieve similar results or improved outcomes. All in all, the case study monitoring evaluation approach is an effective method for determining the effectiveness of specific policies, programs, or initiatives. By researching and analyzing the successes of previous cases, this approach can be used to identify similar approaches that could be applied to similar situations in order to achieve similar results or improved outcomes.
A case study evaluation approach offers the advantage of providing in-depth insight into a particular program or policy. This can be accomplished by analyzing data and observations collected from a range of stakeholders such as program participants, service providers, and community members. The monitoring and evaluation approach is used to assess the impact of programs and inform the decision-making process to ensure successful implementation. The case study monitoring and evaluation approach can help identify any underlying issues that need to be addressed in order to improve program effectiveness. It also provides a reality check on how successful programs are actually working, allowing organizations to make adjustments as needed. Overall, a case study monitoring and evaluation approach helps to ensure that policies and programs are achieving their objectives while providing valuable insight into how they are performing overall.
By taking a qualitative approach to data collection and analysis, case study evaluations are able to capture nuances in the context of a particular program or policy that can be overlooked when relying solely on quantitative methods. Using this approach, insights can be gleaned from looking at the individual experiences and perspectives of actors involved, providing a more detailed understanding of the impact of the program or policy than is possible with other evaluation methodologies. As such, case study monitoring evaluation is an invaluable tool in assessing the effectiveness of a particular initiative, enabling more informed decision-making as well as more effective implementation of programs and policies.
Furthermore, this approach is an effective way to uncover experiential information that can help to inform the ongoing improvement of policy and programming over time All in all, the case study monitoring evaluation approach offers an effective way to uncover experiential information necessary to inform the ongoing improvement of policy and programming. By analyzing the data gathered from this systematic approach, stakeholders can gain deeper insight into how best to make meaningful and long-term changes in their respective organizations.
Case studies come in a variety of forms, each of which can be put to a unique set of evaluation tasks. Evaluators have come to a consensus on describing six distinct sorts of case studies, which are as follows: illustrative, exploratory, critical instance, program implementation, program effects, and cumulative.
Illustrative Case Study
An illustrative case study is a type of case study that is used to provide a detailed and descriptive account of a particular event, situation, or phenomenon. It is often used in research to provide a clear understanding of a complex issue, and to illustrate the practical application of theories or concepts.
An illustrative case study typically uses qualitative data, such as interviews, surveys, or observations, to provide a detailed account of the unit being studied. The case study may also include quantitative data, such as statistics or numerical measurements, to provide additional context or to support the qualitative data.
The goal of an illustrative case study is to provide a rich and detailed description of the unit being studied, and to use this information to illustrate broader themes or concepts. For example, an illustrative case study of a successful community development project may be used to illustrate the importance of community engagement and collaboration in achieving development goals.
One of the strengths of an illustrative case study is its ability to provide a detailed and nuanced understanding of a particular issue or phenomenon. By focusing on a single case, the researcher is able to provide a detailed and in-depth analysis that may not be possible through other research methods.
However, one limitation of an illustrative case study is that the findings may not be generalizable to other contexts or populations. Because the case study focuses on a single unit, it may not be representative of other similar units or situations.
A well-executed case study can shed light on wider research topics or concepts through its thorough and descriptive analysis of a specific event or phenomenon.
Exploratory Case Study
An exploratory case study is a type of case study that is used to investigate a new or previously unexplored phenomenon or issue. It is often used in research when the topic is relatively unknown or when there is little existing literature on the topic.
Exploratory case studies are typically qualitative in nature and use a variety of methods to collect data, such as interviews, observations, and document analysis. The focus of the study is to gather as much information as possible about the phenomenon being studied and to identify new and emerging themes or patterns.
The goal of an exploratory case study is to provide a foundation for further research and to generate hypotheses about the phenomenon being studied. By exploring the topic in-depth, the researcher can identify new areas of research and generate new questions to guide future research.
One of the strengths of an exploratory case study is its ability to provide a rich and detailed understanding of a new or emerging phenomenon. By using a variety of data collection methods, the researcher can gather a broad range of data and perspectives to gain a more comprehensive understanding of the phenomenon being studied.
However, one limitation of an exploratory case study is that the findings may not be generalizable to other contexts or populations. Because the study is focused on a new or previously unexplored phenomenon, the findings may not be applicable to other situations or populations.
Exploratory case studies are an effective research strategy for learning about novel occurrences, developing research hypotheses, and gaining a deep familiarity with a topic of study.
Critical Instance Case Study
A critical instance case study is a type of case study that focuses on a specific event or situation that is critical to understanding a broader issue or phenomenon. The goal of a critical instance case study is to analyze the event in depth and to draw conclusions about the broader issue or phenomenon based on the analysis.
A critical instance case study typically uses qualitative data, such as interviews, observations, or document analysis, to provide a detailed and nuanced understanding of the event being studied. The data are analyzed using various methods, such as content analysis or thematic analysis, to identify patterns and themes that emerge from the data.
The critical instance case study is often used in research when a particular event or situation is critical to understanding a broader issue or phenomenon. For example, a critical instance case study of a successful disaster response effort may be used to identify key factors that contributed to the success of the response, and to draw conclusions about effective disaster response strategies more broadly.
One of the strengths of a critical instance case study is its ability to provide a detailed and in-depth analysis of a particular event or situation. By focusing on a critical instance, the researcher is able to provide a rich and nuanced understanding of the event, and to draw conclusions about broader issues or phenomena based on the analysis.
However, one limitation of a critical instance case study is that the findings may not be generalizable to other contexts or populations. Because the case study focuses on a specific event or situation, the findings may not be applicable to other similar events or situations.
A critical instance case study is a valuable research method that can provide a detailed and nuanced understanding of a particular event or situation and can be used to draw conclusions about broader issues or phenomena based on the analysis.
Program Implementation Program Implementation
A program implementation case study is a type of case study that focuses on the implementation of a particular program or intervention. The goal of the case study is to provide a detailed and comprehensive account of the program implementation process, and to identify factors that contributed to the success or failure of the program.
Program implementation case studies typically use qualitative data, such as interviews, observations, and document analysis, to provide a detailed and nuanced understanding of the program implementation process. The data are analyzed using various methods, such as content analysis or thematic analysis, to identify patterns and themes that emerge from the data.
The program implementation case study is often used in research to evaluate the effectiveness of a particular program or intervention, and to identify strategies for improving program implementation in the future. For example, a program implementation case study of a school-based health program may be used to identify key factors that contributed to the success or failure of the program, and to make recommendations for improving program implementation in similar settings.
One of the strengths of a program implementation case study is its ability to provide a detailed and comprehensive account of the program implementation process. By using qualitative data, the researcher is able to capture the complexity and nuance of the implementation process, and to identify factors that may not be captured by quantitative data alone.
However, one limitation of a program implementation case study is that the findings may not be generalizable to other contexts or populations. Because the case study focuses on a specific program or intervention, the findings may not be applicable to other programs or interventions in different settings.
An effective research tool, a case study of program implementation may illuminate the intricacies of the implementation process and point the way towards future enhancements.
Program Effects Case Study
A program effects case study is a research method that evaluates the effectiveness of a particular program or intervention by examining its outcomes or effects. The purpose of this type of case study is to provide a detailed and comprehensive account of the program’s impact on its intended participants or target population.
A program effects case study typically employs both quantitative and qualitative data collection methods, such as surveys, interviews, and observations, to evaluate the program’s impact on the target population. The data is then analyzed using statistical and thematic analysis to identify patterns and themes that emerge from the data.
The program effects case study is often used to evaluate the success of a program and identify areas for improvement. For example, a program effects case study of a community-based HIV prevention program may evaluate the program’s effectiveness in reducing HIV transmission rates among high-risk populations and identify factors that contributed to the program’s success.
One of the strengths of a program effects case study is its ability to provide a detailed and nuanced understanding of a program’s impact on its intended participants or target population. By using both quantitative and qualitative data, the researcher can capture both the objective and subjective outcomes of the program and identify factors that may have contributed to the outcomes.
However, a limitation of the program effects case study is that it may not be generalizable to other populations or contexts. Since the case study focuses on a particular program and population, the findings may not be applicable to other programs or populations in different settings.
A program effects case study is a good way to do research because it can give a detailed look at how a program affects the people it is meant for. This kind of case study can be used to figure out what needs to be changed and how to make programs that work better.
Cumulative Case Study
A cumulative case study is a type of case study that involves the collection and analysis of multiple cases to draw broader conclusions. Unlike a single-case study, which focuses on one specific case, a cumulative case study combines multiple cases to provide a more comprehensive understanding of a phenomenon.
The purpose of a cumulative case study is to build up a body of evidence through the examination of multiple cases. The cases are typically selected to represent a range of variations or perspectives on the phenomenon of interest. Data is collected from each case using a range of methods, such as interviews, surveys, and observations.
The data is then analyzed across cases to identify common themes, patterns, and trends. The analysis may involve both qualitative and quantitative methods, such as thematic analysis and statistical analysis.
The cumulative case study is often used in research to develop and test theories about a phenomenon. For example, a cumulative case study of successful community-based health programs may be used to identify common factors that contribute to program success, and to develop a theory about effective community-based health program design.
One of the strengths of the cumulative case study is its ability to draw on a range of cases to build a more comprehensive understanding of a phenomenon. By examining multiple cases, the researcher can identify patterns and trends that may not be evident in a single case study. This allows for a more nuanced understanding of the phenomenon and helps to develop more robust theories.
However, one limitation of the cumulative case study is that it can be time-consuming and resource-intensive to collect and analyze data from multiple cases. Additionally, the selection of cases may introduce bias if the cases are not representative of the population of interest.
In summary, a cumulative case study is a valuable research method that can provide a more comprehensive understanding of a phenomenon by examining multiple cases. This type of case study is particularly useful for developing and testing theories and identifying common themes and patterns across cases.
When conducting a case study evaluation approach, one of the main challenges is the need to establish a contextually relevant research design that accounts for the unique factors of the case being studied. This requires close monitoring of the case, its environment, and relevant stakeholders. In addition, the researcher must build a framework for the collection and analysis of data that is able to draw meaningful conclusions and provide valid insights into the dynamics of the case. Ultimately, an effective case study monitoring evaluation approach will allow researchers to form an accurate understanding of their research subject.
Additionally, depending on the size and scope of the case, there may be concerns regarding the availability of resources and personnel that could be allocated to data collection and analysis. To address these issues, a case study monitoring evaluation approach can be adopted, which would involve a mix of different methods such as interviews, surveys, focus groups and document reviews. Such an approach could provide valuable insights into the effectiveness and implementation of the case in question. Additionally, this type of evaluation can be tailored to the specific needs of the case study to ensure that all relevant data is collected and respected.
When dealing with a highly sensitive or confidential subject matter within a case study, researchers must take extra measures to prevent bias during data collection as well as protect participant anonymity while also collecting valid data in order to ensure reliable results
Moreover, when conducting a case study evaluation it is important to consider the potential implications of the data gathered. By taking extra measures to prevent bias and protect participant anonymity, researchers can ensure reliable results while also collecting valid data. Maintaining confidentiality and deploying ethical research practices are essential when conducting a case study to ensure an unbiased and accurate monitoring evaluation.
When planning and implementing a case study evaluation approach, it is important to ensure the guiding principles of research quality, data collection, and analysis are met. To ensure these principles are upheld, it is essential to develop a comprehensive monitoring and evaluation plan. This plan should clearly outline the steps to be taken during the data collection and analysis process. Furthermore, the plan should provide detailed descriptions of the project objectives, target population, key indicators, and timeline. It is also important to include metrics or benchmarks to monitor progress and identify any potential areas for improvement. By implementing such an approach, it will be possible to ensure that the case study evaluation approach yields valid and reliable results.
To ensure successful implementation, it is essential to establish a reliable data collection process that includes detailed information such as the scope of the study, the participants involved, and the methods used to collect data. Additionally, it is important to have a clear understanding of what will be examined through the evaluation process and how the results will be used. All in all, it is essential to establish a sound monitoring evaluation approach for a successful case study implementation. This includes creating a reliable data collection process that encompasses the scope of the study, the participants involved, and the methods used to collect data. It is also imperative to have an understanding of what will be examined and how the results will be utilized. Ultimately, effective planning is key to ensure that the evaluation process yields meaningful insights.
Benefits of Incorporating the Case Study Evaluation Approach in the Monitoring and Evaluation of Projects and Programmes
Using a case study approach in monitoring and evaluation allows for a more detailed and in-depth exploration of the project’s success, helping to identify key areas of improvement and successes that may have been overlooked through traditional evaluation. Through this case study method, specific data can be collected and analyzed to identify trends and different perspectives that can support the evaluation process. This data can allow stakeholders to gain a better understanding of the project’s successes and failures, helping them make informed decisions on how to strengthen current activities or shape future initiatives. From a monitoring and evaluation standpoint, this approach can provide an increased level of accuracy in terms of accurately assessing the effectiveness of the project.
This can provide valuable insights into what works—and what doesn’t—when it comes to implementing projects and programs, aiding decision-makers in making future plans that better meet their objectives However, monitoring and evaluation is just one approach to assessing the success of a case study. It does provide a useful insight into what initiatives may be successful, but it is important to note that there are other effective research methods, such as surveys and interviews, that can also help to further evaluate the success of a project or program.
In conclusion, a case study evaluation approach can be incredibly useful in monitoring and evaluating complex programs and policies. By exploring key themes, patterns and relationships, organizations can gain a detailed understanding of the successes, challenges and limitations of their program or policy. This understanding can then be used to inform decision-making and improve outcomes for those involved. With its ability to provide an in-depth understanding of a program or policy, the case study evaluation approach has become an invaluable tool for monitoring and evaluation professionals.
Leave a Comment Cancel Reply
Your email address will not be published.
How strong is my Resume?
Only 2% of resumes land interviews.
Land a better, higher-paying career

Jobs for You
Information coordinator – usaid guatemala planning and program support office.
- United States (Remote)
Director of Market Influence
- Atlanta, GA, USA
- Habitat for Humanity International
CLA Coordinator/Report Officer
- Bosnia and Herzegovina
Director of Collaborating, Learning, and Adapting (CLA) – Bosnia and Herzegovina
Senior transition and closeout consultant, global health technical and mission support (gh-tams), intern – pricing and budget.
- United States
Research Technical Advisor
- South Bend, IN, USA (Remote)
- University of Notre Dame
YMELP II Short-Term Technical Assistance (STTA)
Water, sanitation and hygiene advisor (wash) – usaid/drc.
- Democratic Republic of the Congo
Health Supply Chain Specialist – USAID/DRC
Chief of party – bosnia and herzegovina, project manager i, business development associate, director of finance and administration, request for information – collecting information on potential partners for local works evaluation.
- Washington, USA
Services you might be interested in
Useful guides ....
How to Create a Strong Resume
Monitoring And Evaluation Specialist Resume
Resume Length for the International Development Sector
Types of Evaluation
Monitoring, Evaluation, Accountability, and Learning (MEAL)
LAND A JOB REFERRAL IN 2 WEEKS (NO ONLINE APPS!)
Sign Up & To Get My Free Referral Toolkit Now:
Let your search flow
Explore perspectives, what is a perspective.
Perspectives are different frameworks from which to explore the knowledge around sustainable sanitation and water management. Perspectives are like filters: they compile and structure the information that relate to a given focus theme, region or context. This allows you to quickly navigate to the content of your particular interest while promoting the holistic understanding of sustainable sanitation and water management.
Monitoring and evaluation - TARA (case study)
Executive Summary
This case study supports and illustrates the theoretic factsheet "Monitoring and evaluation (safe water business)" with practical insights.
TARA going from informal, to paper to a mobile app - M&E evolution in India

Informal infrequent M&E
TARAlife produces and sells liquid chlorine to purify drinking water, produced with Antenna Foundation ’s WATA™ technology converting salt and water with a simple electrolysis process into sodium hypochlorite (chlorine). When TARA started producing and selling chlorine branded Aqua+ (see picture) via its social enterprise TARAlife Pvt. Ltd. in 2012, TARA did not have a systematic M&E system in place to monitor sales and business activities. The head of TARAlife simply contacted each local partner by phone on an irregular basis to collect sales figures.
Paper-based
Recognising the importance of collecting customer and sales data in a more systematic way, TARA designed its first M&E system in 2013. This was a sales record booklet which included sections for customer data, sales data, and marketing materials. This system was not functioning properly, because each franchisee filled out the booklet slightly differently and the data were also not reported back to TARA headquarters consistently. This made the data from different regions and last mile agents difficult to compare. At the same time, TARA’s channel partners were having difficulties in managing their Aqua+ stocks, which was causing delayed orders and expired stocks.
To address both the issues of sales management as well as stock management, TARA started developing a mobile application, with support from a consultant. The app aims to make the sales reporting more user-friendly, more consistent and quicker. When developing the app, TARA realized that it could also be used to collect customer and impact-related data to assess the social, health and financial impacts of TARA's interventions. Together with IRC, the framework for the app (see figure below) was developed based on the following four objectives:
- Retain & increase database of Aqua+ customers
- Track and record impact of intervention on health/overall quality of life
- Decrease or minimise sales lost and inventory costs
- Extend the application of the system to other products than Aqua+ over the long run
The key functions of the application are the following:
- Data collected through the app by micro franchisees: details about customers, micro franchisees, customer purchasing behaviour, baseline survey of potential new customers (i.e. current water disinfection practices, existing health status, medical expenses, etc.), and product feedback from customers.
- Analysis of the data captured with the application: real-time tracking of sales and micro franchisee performance in terms of meeting sales targets.
- Implementation of the data used: send reminders to customers about purchasing TARA products and send periodic messages about safe water awareness.
- Conduct an impact assessment survey (post intervention survey after 6 months of purchase).

The development of the mobile application is completed and it is about to enter the pilot test phase with micro franchisees at TARA Akshar locations in the state of Eastern Uttar Pradesh, India. The results from the pilot test are expected by 2018.
Lessons learnt from digitalising M&E
- Paper-based M&E has the advantage that surveys do not need to have access to a source of electricity, which can be advantageous in non-electrified rural areas.
- Paper-based M&E is more time-consuming as to get a clear overview and statistics data has to be fed into computers. During such process mistakes can occur and falsify data.
- The launch of the app-based M&E brings different advantages along: Data is now homogenously compiled and can soundly be tracked back to microfranchisees. It easily allows to make comparisons between regions, products and salespeople on a daily basis.
- App-based M&E allows to be adapted to a variety of products and can be duplicated when necessary.
- App-based M&E improve attractiveness of a safe water initiative or safe water enterprise for investments as impact is soundly collected and can be easily presented and accessed externally also.
Recommendations for implementing an app-based M&E system
- Developing and integrating app-based M&E is time-consuming and has its costs that have to be taken into account when reflecting on starting such project in your safe water initiative.
- In a long-term perspective is the use of app-based M&E inevitable as tendencies are in place of donors and impact investors to have sound track access to data and this if possible on a daily basis.
Safe Water and Jobs - Creating Access to Safe Water in India through Women-Led Service Delivery Models
Taralife sustainability solutions pvt. ltd, alternative versions to, perspective structure.
- Case Studies
You Might Be Interested In
- SDG Background
- Background on "bottom of the pyramid"
- Scaling Safe Water - The Need for an Industry Facilitator
- Operation and Maintenance
You want to stay up to date about water entrepreneurship?
Subscribe here to the new Sanitation and Water Entrepreneurship Pact (SWEP) newsletter!

Contenidos de la ficha
Get regular updates on the latest innovations in SSWM, new perspectives and more!
Do you like our new look?
We'd love to know what you think of the new website – please send us your feedback.
Comparte con otros
Subscribe to our newsletter.
Loading metrics
Open Access
Peer-reviewed
Research Article
Public health policy impact evaluation: A potential use case for longitudinal monitoring of viruses in wastewater at small geographic scales
Roles Conceptualization, Data curation, Formal analysis, Investigation, Methodology, Validation, Visualization, Writing – original draft, Writing – review & editing
Affiliation Department of Civil and Environmental Engineering, Stanford University, Stanford, California, United States of America
Roles Data curation, Validation, Writing – review & editing
Roles Investigation, Methodology, Writing – review & editing
Affiliations Department of Civil and Environmental Engineering, Stanford University, Stanford, California, United States of America, Codiga Resource Recovery Center, Stanford University, Stanford, California, United States of America
Roles Investigation, Methodology, Supervision, Writing – review & editing
Roles Conceptualization, Data curation, Funding acquisition, Methodology, Project administration, Resources, Supervision, Validation, Writing – original draft, Writing – review & editing
* E-mail: [email protected]
- Elana M. G. Chan,
- Amanda Bidwell,
- Zongxi Li,
- Sebastien Tilmans,
- Alexandria B. Boehm
- Published: June 3, 2024
- https://doi.org/10.1371/journal.pwat.0000242
- Reader Comments
Public health policy impact evaluation is challenging to study because randomized controlled experiments are infeasible to conduct, and policy changes often coincide with non-policy events. Quasi-experiments do not use randomization and can provide useful knowledge for causal inference. Here we demonstrate how longitudinal wastewater monitoring of viruses at a small geographic scale may be used in a quasi-experimental design to evaluate the impact of COVID-19 public health policies on the spread of COVID-19 among a university population. We first evaluated the correlation between incident, reported COVID-19 cases and wastewater SARS-CoV-2 RNA concentrations and observed changes to the correlation over time, likely due to changes in testing requirements and testing options. Using a difference-in-differences approach, we then evaluated the association between university COVID-19 public health policy changes and levels of SARS-CoV-2 RNA concentrations in wastewater. We did not observe changes in SARS-CoV-2 RNA concentrations associated with most policy changes. Policy changes associated with a significant change in campus wastewater SARS-CoV-2 RNA concentrations included changes to face covering recommendations, indoor gathering bans, and routine surveillance testing requirements and availability.
Citation: Chan EMG, Bidwell A, Li Z, Tilmans S, Boehm AB (2024) Public health policy impact evaluation: A potential use case for longitudinal monitoring of viruses in wastewater at small geographic scales. PLOS Water 3(6): e0000242. https://doi.org/10.1371/journal.pwat.0000242
Editor: Ricardo Santos, Universidade Lisboa, Instituto superior Técnico, PORTUGAL
Received: February 2, 2024; Accepted: May 5, 2024; Published: June 3, 2024
Copyright: © 2024 Chan et al. This is an open access article distributed under the terms of the Creative Commons Attribution License , which permits unrestricted use, distribution, and reproduction in any medium, provided the original author and source are credited.
Data Availability: Wastewater data are publicly available through the Stanford Digital Repository ( https://doi.org/10.25740/ch598gf0783 ).
Funding: This work was supported by the Provost’s Office of Stanford University to ABB with additional support from the Sergey Brin Family Foundation to ABB. The funders had no role in study design, data collection and analysis, decision to publish, or preparation of the manuscript.
Competing interests: The authors have declared that no competing interests exist.
1. Introduction
Nonpharmaceutical interventions (NPIs) aim to reduce the spread of an infectious disease in a community, especially when the community has little immunity to the pathogen or a vaccine is not yet available [ 1 ]. Examples of NPIs implemented in the United States at the start of the coronavirus disease 2019 (COVID-19) pandemic include face mask mandates, stay-at-home orders, non-essential business closures, and large gathering bans [ 2 ]. Although NPIs intended to benefit communities by flattening the epidemic curve—that is by reducing the peak number of cases and burden on the health care system—the implementation of NPIs also led to economic consequences and tolls on social well-being [ 3 – 5 ]. Governments and institutional leadership are tasked with balancing public health, social well-being, and economic prospects in the face of epidemics. Causal evidence can help policymakers and leaders make better-informed decisions in dire situations.
Following the initial wave of the pandemic, several studies empirically assessed the impact of NPIs on health-related outcomes. These studies suggested that NPIs reduced the spread of severe acute respiratory disease syndrome coronavirus 2 (SARS-CoV-2) virus, with school and workplace closures, business restrictions, large gathering bans, and mask mandates among the most impactful [ 6 – 10 ]. A review of the methodologies used by these studies found that around half analyzed raw outcome data and half analyzed computed outcome data (i.e., raw outcome data was used to compute another outcome) [ 11 ]. The most common raw outcomes analyzed were clinical surveillance reports (e.g., confirmed cases or deaths) and human mobility (e.g., tracking of mobile phones) [ 11 ]. The most common computed outcomes analyzed were COVID-19 growth rate and effective reproduction number [ 11 ].
Although clinical surveillance and mobile phone tracking are the most common sources of data used to evaluate NPIs, these data are not without biases and limitations. Counts of confirmed cases depend on clinical testing capacity and clinical testing rates, and deaths that occur outside of hospitals may be underreported [ 6 – 8 , 10 , 11 ]. Furthermore, clinical testing behaviors have drastically changed with the availability of self-administered antigen tests which are not reported to health departments [ 12 ]. Mobility data through tracking of mobile phones are unaffected by changes in clinical testing, but these data are not always publicly accessible, biased towards individuals who opt into location history sharing, and may not be a reliable proxy for SARS-CoV-2 transmission dynamics [ 13 , 14 ]. Wastewater monitoring, which gained heightened attention during the COVID-19 pandemic, is a promising data source because it does not suffer some of the limitations of clinical surveillance and mobility data for epidemiological inference.
Wastewater monitoring refers to the analysis of a sample of wastewater, which represents a pooled biological sample of the contributing population, for concentrations of infectious disease markers. Wastewater monitoring data capture contributions from both symptomatic and asymptomatic individuals and are not influenced by clinical testing availability or clinical test-seeking behaviors [ 15 ]. Studies reported that concentrations of SARS-CoV-2 RNA in wastewater solids are temporally correlated with laboratory-confirmed incident COVID-19 cases [ 16 – 19 ]. Several studies also demonstrated that wastewater monitoring can be used at geographic scales smaller than a sewershed (i.e., the population serviced by a wastewater treatment plant) to gain insight about COVID-19 incidence [ 20 – 32 ]. A potential use case for wastewater monitoring at subsewershed scales is to assess the impact of public health policies.
The World Health Organization (WHO) suggests sampling at finer spatial scales when using wastewater monitoring data to inform targeted control interventions [ 15 ]. Previous studies evaluating NPIs using clinical surveillance or mobility data were mostly conducted at national or subnational scales, and few of these studies investigated variation in the impact of NPIs on health-related outcomes among subpopulations [ 11 ]. NPIs may be more or less impactful in a subpopulation compared with the general population (e.g., due to different interaction patterns) or public health goals may differ among subpopulations (e.g., universities aim to maximize on-campus activity) [ 33 ]. Wastewater monitoring data may be well-suited to objectively assess NPIs, particularly among subpopulations and when clinical testing rates are low.
In this study, we evaluate the potential use case of wastewater monitoring data to empirically assess the impact of NPIs on the spread of COVID-19 among a university population. We begin by assessing the correlation between wastewater concentrations of SARS-CoV-2 RNA and reported COVID-19 incidence at Stanford University and evaluate changes to this correlation over time. Next, we evaluate the association between COVID-19 public health policies implemented at Stanford University and changes in wastewater concentrations of SARS-CoV-2 RNA using a difference-in-differences (DiD) approach. DiD is a quasi-experimental design commonly used in econometrics—although it was first used in 1854 by the English physician John Snow for epidemiologic purposes—that assesses the impact of an intervention on an outcome without the use of randomization [ 34 – 36 ]. DiD designs have been used by previous studies to empirically evaluate the causal effects of COVID-19 policies on clinical or mobility outcomes [ 37 – 44 ].
We used wastewater SARS-CoV-2 RNA monitoring data, COVID-19 case surveillance data, and dates associated with changes to campus COVID-19 public health policies between 29 July 2021 to 9 August 2023. During this timeframe, the residential communities for undergraduate and graduate students at Stanford University were open for all students to physically reside on campus. All calculations and statistical analyses were conducted in R (R Foundation for Statistical Computing version 4.1.3). This study was approved by the Stanford Institutional Review Board (IRB) for human subject research (IRB-59746). We did not obtain consent from individuals to preserve anonymity, and we did not have access to personally identifiable information during or after data collection.
2.1 Wastewater monitoring data
We used wastewater monitoring data from the Codiga Resource Recovery Center (CR2C) and the Palo Alto Regional Water Quality Control Plant (RWQCP) for this analysis. CR2C is a pilot scale wastewater treatment facility that services a portion of the Stanford University campus (California, USA). Buildings serviced include academic buildings and student and faculty housing; hospitals and clinics affiliated with the medical school are not serviced by CR2C (Fig A in S1 Text ) [ 45 , 46 ]. CR2C services approximately 10,000 people with an estimated daily flow of approximately 0.5 million gallons of wastewater each day [ 20 , 46 ]. CR2C is a subsewershed of the sewershed serviced by RWQCP which is operated by the City of Palo Alto (California, USA). RWQCP services approximately 236,000 people and treats approximately 20 million gallons of wastewater each day for Los Altos, Los Altos Hills, Mountain View, Palo Alto, Stanford University, and the East Palo Alto Sanitary District (Fig A in S1 Text ) [ 47 ].
Prospective, longitudinal wastewater sampling from CR2C and RWQCP began July 2021 and October 2020, respectively, and is currently ongoing. Briefly, wastewater settled solids are collected from both CR2C and RWQCP for laboratory processing. Settled solids samples at CR2C are generated from a 24-hour time proportional composite sample of the wastewater influent that is allowed to settle. Settled solids samples at RWQCP are “grab” samples from the primary clarifier; these samples are essentially composite samples because solids in the primary clarifier collect over 12–24 hours [ 48 ]. Six samples per week are collected from CR2C; seven samples per week are collected from RWQCP. Sampling from CR2C was temporarily reduced to two samples per week between 1 November 2022 and 31 December 2022. Details about sampling and processing methods used to measure the RNA targets, including quality assurance and quality control metrics, are registered in protocols.io [ 49 – 51 ] and have been described previously by Wolfe et al. [ 52 ] and Boehm et al. [ 53 ], so they are not repeated herein. Measurements and reporting in those other publications follow Environmental Microbiology Minimal Information (EMMI) guidelines. For this analysis, we used concentrations of the SARS-CoV-2 RNA N gene in wastewater settled solids in gene copies (gc) per gram (g) dry weight (gc/g), both unnormalized (N) and normalized by pepper mild mottle virus (PMMoV) RNA concentrations in wastewater settled solids in gc/g (N/PMMoV). The N gene target is located near the frequently used N2 assay target [ 54 ], and we have confirmed no mutation in the genomic target over the course of the pandemic [ 19 ]. PMMoV is a commonly used marker of wastewater fecal strength, and based on a mass balance model N/PMMoV should scale with disease incidence rate [ 18 , 55 , 56 ]. We used data between 29 July 2021 and 9 August 2023 (CR2C: 590 days; RWQCP: 736 days). The measured N gene concentration was below the limit of detection (approximately 1,000 gc/g) in 29 samples from CR2C. No samples from RWQCP were below the limit of detection. We imputed half the limit of detection (500 gc/g) for the N gene concentration for samples below the limit of detection. There were no non-detects for PMMoV in the dataset. Data from RWQCP between 16 November 2020 and 31 December 2022 have been published previously by Boehm et al. [ 53 ] and are publicly available through the Stanford Digital Repository ( https://doi.org/10.25740/cx529np1130 ) [ 57 ]. Data from CR2C are novel and not published elsewhere. All wastewater monitoring data used in this study are publicly available through the Stanford Digital Repository ( https://doi.org/10.25740/ch598gf0783 ) [ 58 ].
2.2 COVID-19 case surveillance data
Reported COVID-19 cases (hereafter “case data”) among students residing in the CR2C subsewershed are available from Stanford University. The date assigned to the positive test result is the date of specimen collection. We used case data between 29 July 2021 and 9 August 2023 for this analysis. The campus case data include positive test results from both student-reported self-administered antigen tests and laboratory-based PCR tests through the university’s surveillance testing program. The university’s surveillance testing program required vaccinated students to test once per week (twice per week for unvaccinated students) through 7 April 2022. Free, optional laboratory-based PCR testing continued to be available for students through 18 June 2023, so any cases thereafter were exclusively from student-reported self-administered tests. The CR2C subsewershed includes faculty and staff housing, but nonstudents residing in the CR2C subsewershed are not included in the university’s case data. Data provided by the state of California did not identify any COVID-19 cases in nonstudent housing areas during our entire analysis period.
2.3 Campus COVID-19 public health policies
Dates and details of changes to Stanford University’s COVID-19 public health policies were obtained from Stanford COVID-19 Health Alerts [ 59 ]. There were 15 unique dates on which campus COVID-19 public health policies changed during the study period ( Table 1 ). We categorized policies into three groups: masking (i.e., those involving the use of face coverings), mobility (i.e., those involving movement or gathering of individuals), and testing (i.e., those relating to laboratory-based surveillance testing). We included testing policies because we hypothesize that surveillance testing requirements and availability affect the number of asymptomatic cases interacting with the general university population and, in turn, SARS-CoV-2 transmission on campus. We further differentiated policies between those that enforced rules (i.e., restrictions) and those that relaxed existing rules (i.e., relaxations). More information about each policy is included in Table A in the S1 Text .
- PPT PowerPoint slide
- PNG larger image
- TIFF original image
https://doi.org/10.1371/journal.pwat.0000242.t001
2.4 Correlation analysis
Incident COVID-19 cases within the CR2C subsewershed were reported daily, whereas between 2–6 wastewater samples per week were collected and analyzed from CR2C during the analysis period. Clinical case surveillance data may further contain reporting biases on weekends. To compare the two time series, we calculated weekly average N concentrations, N/PMMoV concentrations, and incident COVID-19 cases for each epidemiological week (Sunday through Saturday). Neither raw nor log 10 -transformed weekly average N or N/PMMoV concentrations from CR2C were normally distributed (Shapiro-Wilk normality test, p < 0.01), so we used Kendall’s tau correlation to test the null hypothesis that weekly average wastewater SARS-CoV-2 RNA concentrations and weekly average incident COVID-19 cases in the CR2C subsewershed are not temporally correlated. We tested this null hypothesis using both unnormalized (N) and normalized (N/PMMoV) wastewater concentrations. We used the KendallTauB function from the DescTools R package to compute the 95% confidence interval for each tau estimate [ 60 ].
We further conducted three subgroup correlation analyses. First, we grouped the data by whether wastewater sample or clinical specimen collection occurred during the academic year (autumn, winter, or spring quarter) or nonacademic year (summer quarter). We used the date halfway between the last day of classes of the previous quarter and first day of classes of the following quarter to define the start and end of quarters [ 61 ]. Second, we grouped the data by whether wastewater sample or clinical specimen collection occurred before or after the requirement for laboratory-based surveillance testing was suspended for vaccinated and boosted students (7 April 2022) ( Table 1 ). The laboratory-based surveillance testing program required fully vaccinated students to test once a week (twice a week for unvaccinated students) and therefore intended to capture both symptomatic and asymptomatic cases through routine testing. Third, we grouped the data by whether wastewater sample or clinical specimen collection occurred before or after 1 May 2022 [ 19 ]. This date represents a point in time when self-administered COVID-19 antigen tests, the results of which are not reportable to health departments, were widely available [ 12 , 19 ]. For each subgroup, we grouped weekly average wastewater concentrations and incident case counts based on the end date of the epidemiological week. In total, we conducted 14 correlation analyses using subsets of the same datasets to test the same null hypothesis, so we used an alpha value of 0.05 / 14 = 0.004 to account for multiple hypothesis testing when interpreting the p-value associated with each tau estimate.
2.5 Policy impact evaluation
We used PMMoV-normalized wastewater concentrations for the remainder of the analysis as the correlation between incident COVID-19 cases and wastewater SARS-CoV-2 RNA concentrations were similar using N and N/PMMoV, and a mass balance model suggests the N/PMMoV ratio should scale with incidence rate [ 56 ]. PMMoV is also a conceptually valid normalization approach because (1) PMMoV is an indigenous wastewater virus and therefore may better correct for differences in virus recovery than an exogenous recovery control that is seeded into the sample such as bovine coronavirus (BCoV) and (2) PMMoV is of dietary origin and therefore can control for differences in the fecal strength of the wastestream [ 55 , 56 ]. To assess the association between campus COVID-19 public health policies and changes in N/PMMoV measurements at CR2C, we used a difference-in-differences (DiD) approach. For the DiD design, we assumed policies went into effect at midnight on the date of implementation (day = 0). We defined the pre-treatment period as the 14 days before a policy was implemented (days -14 to -1) and the post-treatment period as the 14 days after a policy was implemented (days 0 to 13). We chose 14 days because 14 days is the maximum incubation period for SARS-CoV-2 and people who shed SARS-CoV-2 RNA typically do so at the start of infection [ 62 – 66 ]. We assumed the RWQCP sewershed represents a reasonable comparison group for the CR2C subsewershed. With the exception of the East Palo Alto Sanitary District, RWQCP services cities in Santa Clara County, which is the same county that Stanford University is located in. Santa Clara County entered the least restrictive “Yellow Tier” of California’s Blueprint for a Safer Economy on 19 May 2021, which lifted most local orders [ 67 ]. Moreover, California met the criteria under the Blueprint for a Safer Economy to fully reopen the economy on 15 June 2021 [ 68 ]. Regular sampling began at CR2C on 29 July 2021; therefore, we assumed policies implemented by Stanford University thereafter ( Table 1 ) were only applicable to the CR2C subsewershed population and not the greater RWQCP sewershed population. The two exceptions were 3 August 2021 and 2 March 2022 because Santa Clara County also issued the same policies ( Table 1 ) [ 69 , 70 ]. Non-policy events, such as emergence of novel SARS-CoV-2 variants, may also affect SARS-CoV-2 transmission; however, CR2C and RWQCP are in the same geographic area, so we assumed most non-policy events occurred around the same time and are therefore accounted for in the DiD design. Further justification for using RWQCP as a comparison group is included in the S1 Text .
We used a multivariable linear regression model to implement our DiD approach ( Eq 1 ) [ 71 ]. A value of 0 for time represents the pre-treatment period (days -14 to -1), and a value of 1 represents the post-treatment period (days 0 to 13). A value of 0 for treated represents the untreated group (RWQCP), and a value of 1 represents the treated group (CR2C). The coefficient of the interaction between time and treated ( β 3 ) represents the DiD estimator, or the average treatment effect on the treated (ATT) [ 35 , 71 ]. In this study, a positive ATT value suggests a policy was associated with an increase in wastewater N/PMMoV concentrations; a negative ATT value suggests a policy was associated with a decrease in wastewater N/PMMoV concentrations. We recorded β 3 (the ATT) and the p-value associated with β 3 for each policy in Table 1 except for the two policies that Santa Clara County also issued (see above). R code for the DiD analysis is available through the Stanford Digital Repository ( https://doi.org/10.25740/ch598gf0783 ) [ 58 ].
3. Results and discussion
3.1 correlation between wastewater concentrations of sars-cov-2 rna and incident covid-19 cases.
Between 29 July 2021 and 9 August 2023, wastewater N gene concentrations from CR2C ranged from not detected to 2.4 x 10 6 gc/g (mean: 1.3 x 10 5 gc/g, median: 4.4 x 10 4 gc/g) ( Fig 1A ). PMMoV-normalized wastewater concentrations ranged from not detected to 5.0 x 10 −3 (mean: 2.4 10 −4 , median: 6.4 x 10 −5 ) ( Fig 1B ). Reported daily incident COVID-19 cases within the CR2C subsewershed ranged from 0 cases to 420 cases (mean: 52 cases, median: 15 cases) ( Fig 1C ). Over the entire analysis period (the week ending on 31 July 2021 through the week ending on 12 August 2023), weekly average wastewater SARS-CoV-2 RNA concentrations were positively and significantly correlated with weekly average incident COVID-19 cases using unnormalized N gene concentrations but not significantly when using normalized N gene concentrations ( Table 2 ). The subgroup analyses suggest the correlation between wastewater SARS-CoV-2 RNA concentrations and incident COVID-19 cases changed over time.
(A) N gene concentrations in gene copies per dry gram dry weight (gc/g), (B) N/PMMoV concentrations, and (C) incident COVID-19 cases over time. Gray circles represent measurements; error bars are one standard deviation. Gray triangles indicate measurements outside of the range shown on the plot. Black lines connect weekly average values. The shaded area corresponds to the nonacademic year. The dashed lines correspond to the date the surveillance testing requirement was suspended (7 April 2022) and the date of widespread availability of self-administered COVID-19 antigen tests in the region (1 May 2022).
https://doi.org/10.1371/journal.pwat.0000242.g001
https://doi.org/10.1371/journal.pwat.0000242.t002
Weekly average wastewater SARS-CoV-2 RNA concentrations were positively and significantly correlated with weekly average incident COVID-19 cases during the academic year using both unnormalized and normalized N gene concentrations; this correlation was not statistically significant during the nonacademic portion of the year ( Table 2 ). The decrease in students on campus and increase in nonresidential visitors during the nonacademic portion of the year may explain the lack of a statistically significant correlation during the nonacademic year. The COVID-19 case data only include reported student cases residing within the CR2C subsewershed, but infected, nonresidential visitors may still contribute viral RNA to the wastewater that flows to CR2C.
Weekly average wastewater SARS-CoV-2 RNA concentrations were positively and significantly correlated with weekly average incident COVID-19 cases before the suspension of surveillance testing using both unnormalized and normalized N gene concentrations; this correlation was not statistically significant after the suspension of surveillance testing using normalized N gene concentrations only ( Table 2 ). The required, laboratory-based surveillance testing program intended to capture both symptomatic and asymptomatic cases through routine testing. Thus, fewer asymptomatic cases may have been captured in the case data after surveillance testing was suspended which may explain the lack of a statistically significant correlation after this policy change.
Lastly, weekly average wastewater SARS-CoV-2 RNA concentrations were positively and significantly correlated with weekly average incident COVID-19 cases before the widespread availability of self-administered antigen tests using both unnormalized and normalized N gene concentrations; this correlation was not statistically significant after the widespread availability of self-administered antigen tests ( Table 2 ). Positive, laboratory-based PCR tests are reportable under state-disease reporting laws [ 72 ]; however, self-reporting of self-administered antigen test results is voluntary. The widespread availability of self-administered antigen tests may have contributed to underreporting of cases which may explain the lack of a statistically significant correlation after the change in testing options.
It is not possible to deduce the main driver for the change in correlation between wastewater SARS-CoV-2 RNA concentrations and incident COVID-19 cases over time, but we suspect the change is due to several factors including changes in routine COVID-19 surveillance testing requirements, changes in test reporting, and overall decreases in PCR test-seeking behaviors as the pandemic continues [ 19 , 73 – 75 ]. Studies suggest that virus shedding patterns differ among SARS-CoV-2 variants [ 76 – 79 ], so changes in SARS-CoV-2 variants over time could be another reason for the change in correlation over time. We also did not consider lead-lag time effects between wastewater monitoring and case surveillance data as done in other studies [ 16 , 80 ], so future work could investigate how lead-lag time effects between wastewater monitoring and case surveillance data have changed over the course of the pandemic. Nonetheless, wastewater monitoring data are independent of test-seeking behaviors or test reporting patterns so may be a less biased tool for monitoring public health, particularly in periods characterized by low test-seeking and reporting rates.
3.2 Association between campus COVID-19 public health policies and changes in wastewater concentrations of SARS-CoV-2 RNA
Because the reliability of campus COVID-19 case data changed over the course of the study period at Stanford University, we used campus wastewater monitoring data from CR2C to evaluate the impact of COVID-19 public health policies at Stanford University using a DiD approach. Table 3 summarizes the average treatment effect on the treated (ATT) and associated p-value for each unique date associated with a change in campus COVID-19 public health policies as estimated using Eq 1 . The two policies that were also implemented by the greater Santa Clara County were omitted from the analysis. Dates associated with a significant change (p ≤ 0.05) in wastewater N/PMMoV concentrations are shaded (red if ATT > 0 and blue if ATT < 0). A depiction of the DiD approach using the date when indoor events and gatherings were allowed to resume (28 January 2022) as an example is shown in Fig 2 . In total, we analyzed 13 unique dates on which at least one change in campus COVID-19 public health policies went into effect. Most policy change dates (n = 8) were not associated with a significant change in wastewater N/PMMoV concentrations at CR2C. Five policy change dates were associated with a significant change in wastewater N/PMMoV concentrations ( Table 3 and Fig B in S1 Text ). These five dates included policies from all categories (masking, mobility, testing); three dates corresponded to policy relaxations, one corresponded to a policy restriction, and one corresponded to both a policy relaxation and restriction.
(A) Daily N/PMMoV concentrations at the Codiga Resource Recovery Center (CR2C) and Palo Alto Regional Water Quality Control Plant (RWQCP) over the 14 days before and after the policy change (denoted by the dotted line). Concentrations are displayed on a log 10 scale. (B) Average log 10 (N/PMMoV) concentration at CR2C and RWQCP across the 14 days before and after the policy change. The counterfactual average log 10 (N/PMMoV) concentration at CR2C post-policy was estimated based on the time trend observed at RWQCP. The difference between the observed and counterfactual average log 10 (N/PMMoV) concentration at CR2C post-policy represents the average treatment effect on the treated (ATT). Here, a positive ATT value suggests that the policy change was associated with an increase in wastewater N/PMMoV concentrations at CR2C.
https://doi.org/10.1371/journal.pwat.0000242.g002
https://doi.org/10.1371/journal.pwat.0000242.t003
We did not expect policy relaxations to be associated with a significant change in wastewater N/PMMoV concentrations because these policy types are not intended to curb virus transmission. Eight dates exclusively corresponded to a policy relaxation, and five of them were not associated with a change in N/PMMoV concentrations. However, three of these dates were associated with a significant change in N/PMMoV concentrations. There was a significant increase in N/PMMoV concentrations associated with allowing indoor gatherings to resume (28 January 2022), which suggests that indoor gatherings are high-risk activities for SARS-CoV-2 transmission on campus. Indoor gatherings are known to promote SARS-CoV-2 transmission [ 81 ]. There was a significant decrease in N/PMMoV concentrations associated with suspending the surveillance testing requirement for students (7 April 2022), and then a significant increase in N/PMMoV concentrations associated with ending optional, free, laboratory-based PCR testing for employees (24 March 2023). These results are difficult to reconcile with expectations.
We expected policy restrictions to be associated with a significant decrease in wastewater N/PMMoV concentrations because these policy types are intended to curb virus transmission. Four dates exclusively corresponded to a policy restriction, but only one of these dates was associated with a significant change in N/PMMoV concentrations (recommending face coverings outdoors and prohibiting indoor parties on 2 September 2021). This date was associated with a significant increase rather than decrease in N/PMMoV concentrations, which could suggest these restrictive policies did not curb virus transmission on campus. Both a policy relaxation (revised travel guidelines) and policy restriction (surveillance testing required for all faculty, staff, and postdoctoral scholars) were implemented on the remaining date associated with a significant change in N/PMMoV concentrations (20 September 2021). This date was associated with a significant decrease in N/PMMoV concentrations; it is not possible to disentangle the individual causal effects of different policy types implemented on the same day.
Limitations of the DiD analysis may impact the interpretation of results and explain why some results did not align with expectations. First, policies may not be associated with immediate effects on outcomes [ 82 ]. The policy restrictions we considered may be associated with long-term effects on N/PMMoV concentrations despite being associated with null short-term effects. We determined that 14 days preceding and succeeding a policy was the most justified time interval for the DiD design given the maximum incubation period for SARS-CoV-2 is 14 days and people who shed SARS-CoV-2 RNA generally do so at the start of infection [ 62 – 66 ]. When using 14 days, the pre- or post-treatment period of one policy sometimes overlapped part of the pre- or post-treatment period of another policy for policies implemented close together which may lead to cumulative impacts on N/PMMoV concentrations that are not possible to disentangle. Second, there were sometimes campus announcements or national news headlines about COVID-19 preceding the implementation of policies, which could impact peoples’ behaviors leading up to the actual policy change date [ 82 ]. Peoples’ knowledge about the gravity of the COVID-19 pandemic has been shown to influence the effectiveness of lockdown policies [ 39 ]. We used official dates associated with changes to campus policies, but peoples’ behaviors may have started changing before these dates. Alternatively, peoples’ behaviors may have never changed if campus policies were ignored. Third, while the DiD design accounts for non-policy events that affect both CR2C and RWQCP, some non-policy events that affect the CR2C population and not the RWQCP population may have occurred. Co-occurrence of such events with policy changes is unaccounted for in the DiD design. For example, starts of quarters and university commencements may influence N/PMMoV concentrations at CR2C because these events result in large influxes of students and visitors to Stanford’s campus. We conducted the DiD analysis for dates associated with commencements and the first day of classes each quarter (Table B in the S1 Text ), and two starts of quarters were associated with a significant change in N/PMMoV concentrations at CR2C (decrease at the start of autumn 2021 and increase at the start of spring 2022). Lastly, the proportion of people with immunity, either from prior infection or vaccination, changes over time. Potential impacts of public health policies on virus transmission may depend on the susceptible fraction of the population; however, the DiD design does not account for changing levels of susceptibility in either population. Importantly though, COVID-19 vaccination rates were similar and high among the Stanford University and greater Santa Clara County populations at the start of the analysis period [ 69 , 83 ].
Notwithstanding these limitations, we compared our results to those of other studies that also assessed COVID-19 public health policies among a vaccinated university population. Yang et al. similarly found that large gatherings are potentially high-risk events on campus [ 84 ]. Niu and Scarciotti concluded that mask wearing and social distancing measures were most effective at reducing new infections [ 33 ]. Motta et al. [ 85 ] and Paltiel and Schwartz [ 86 ] determined that routine surveillance testing was associated with a reduction in infections, even as vaccine effectiveness or coverage decreased. These other studies all used modeling approaches to assess COVID-19 public health policies; models are useful tools to evaluate public health measures although they often simplify real-world circumstances.
To our knowledge, there are no other published studies that empirically evaluate public health policies using wastewater monitoring data and a quasi-experimental approach, particularly among a vaccinated university population. The few other empirical studies using wastewater monitoring data for policy impact evaluation, which were conducted at large geographic scales and the beginning of the pandemic, used before-and-after descriptive approaches [ 87 , 88 ] or regression modeling and changepoint analysis [ 89 ]. The DiD design used herein aimed to account for co-occurring factors that may also affect the trajectory of N/PMMoV concentrations, such as changing SARS-CoV-2 variants, by using a nearby sewershed as a comparison group. We further considered both policy restrictions and policy relaxations during a period when COVID-19 vaccines were widely available. Previous studies that empirically assessed the impact of NPIs on health-related outcomes generally only focused on restrictions and were most commonly conducted at the start of the pandemic when economies were not fully opened and vaccines were not available. It is not only important to evaluate the implementation of policies but also whether policies are eventually relaxed appropriately, especially because early or rapid relaxation of NPIs may lessen the anticipated benefits of vaccine rollout efforts [ 90 – 94 ]. The quasi-experimental approach demonstrated herein could be useful in other epidemic situations triggering policy interventions, provided the pathogen is shed in human excretions that contribute to wastewater and there exists a reasonable comparison sewershed for the DiD design (e.g., a sewershed in a different state that did not roll out a given intervention).
Causal effects of COVID-19 public health policies are inherently challenging to study given the inability to conduct randomized controlled experiments and concurrence of policy and non-policy events [ 95 ]. Policymakers often need to make decisions despite having robust evidence. Quasi-experiments, which are growing in recognition in the health sciences, are a practical alternative to randomized controlled experiments that can still generate causal evidence [ 34 ]. In the DiD quasi-experimental design used herein, RWQCP represents a reasonable comparison group for CR2C because both sewersheds are in the same geographic area and policies implemented by Stanford University were only applicable to the CR2C population. We also implemented the DiD analysis using wastewater data from another, similar comparison sewershed because wastewater monitoring data from CR2C and RWQCP are not truly independent—although CR2C comprises only a very small proportion of RWQCP. Using wastewater data from the San José-Santa Clara Regional Wastewater Facility [ 96 ], which also services portions of Santa Clara County, as a comparison sewershed generated similar results as provided in Table 3 (Table B in the S1 Text ). Similar findings using a different comparison group further strengthens the credibility of our DiD design and affirms the plausibility of the parallel trends assumption [ 97 ]. Still, uncertainties regarding wastewater monitoring data affect interpretation of data from any sewershed. Limited knowledge exists about SARS-CoV-2 RNA fecal shedding quantity and duration, especially differences in fecal shedding patterns among demographic groups and vaccination statuses [ 64 ]. Studies suggest that SARS-CoV-2 RNA shedding quantity and duration in human excretions that contribute to wastewater differs among SARS-CoV-2 variants, which may affect the interpretation of wastewater monitoring data over time [ 76 – 79 ]. Wastewater monitoring data can also exhibit high day-to-day variability; potential mechanisms for this variability remain yet to be systematically understood but could be due to heterogeneity of the wastestream [ 98 ]. Future studies using longitudinal wastewater monitoring data for causal inference may consider analyzing changes in a computed outcome variable, such as a wastewater-based estimation of the effective reproductive number [ 54 ] or wastewater-based measure of trend [ 99 ], rather than changes in raw wastewater concentrations. Ultimately, the performance of such computed outcomes still depends on understanding the raw wastewater concentration data that are used to generate computed outcomes. Continued work investigating sources of uncertainty and variability in wastewater monitoring data—and particularly the effect size of these sources—is necessary for better interpretation of these data for public health use cases [ 100 , 101 ].
4. Conclusions
We assessed the correlation between wastewater concentrations of SARS-CoV-2 RNA and incident, reported COVID-19 cases at a university and evaluated changes to this correlation over time. Consistent with other studies, we provide evidence that the correlation between wastewater SARS-CoV-2 RNA concentrations and incident COVID-19 cases has changed over time. We further investigated the use of longitudinal wastewater monitoring data for policy impact evaluation. Using a DiD approach, we observed that most campus COVID-19 public health policy changes were not associated with a significant change in wastewater SARS-CoV-2 RNA concentrations on campus. The quasi-experimental design presented herein demonstrates how longitudinal wastewater monitoring of viruses at a small geographic scale may be used for causal inference when randomized controlled experiments are not possible to conduct.
Supporting information
S1 text. supporting information..
https://doi.org/10.1371/journal.pwat.0000242.s001
Acknowledgments
We acknowledge feedback on study design, implementation, and interpretation from James Jacobs, Julie Parsonnet, Russell Furr, Rich Wittman, Robyn Tepper, Jorge Salinas, Bonnie Maldonado, Christina Kong, and Stephanie Kalfayan. We acknowledge Palo Alto and San Jose wastewater treatment plant staff and the CR2C Student Operators team for wastewater sample collection.
- 1. U.S. Centers for Disease Control and Prevention. Nonpharmaceutical Interventions (NPIs). 4 Oct 2022 [cited 18 Jul 2023]. Available: https://www.cdc.gov/nonpharmaceutical-interventions/index.html .
- 2. Kaiser Family Foundation. State Actions to Mitigate the Spread of COVID-19. In: State Health Facts [Internet]. 4 Aug 2021 [cited 18 Jul 2023]. Available: https://www.kff.org/other/state-indicator/state-actions-to-mitigate-the-spread-of-covid-19/ .
- View Article
- PubMed/NCBI
- Google Scholar
- 8. Poeschl J, Larsen RB. How do non-pharmaceutical interventions affect the spread of COVID-19? A literature review. Danmarks Nationalbank; 2021 Apr. Report No.: No. 4. Available: https://www.nationalbanken.dk/en/news-and-knowledge/publications-and-speeches/archive-publications/2021/how-do-non-pharmaceutical-interventions-affect-the-spread-of-covid-19-a-literature-review .
- 15. World Health Organization. Environmental surveillance for SARS-COV-2 to complement public health surveillance: interim guidance. World Health Organization; 2022 Apr. Report No.: WHO/HEP/ECH/WSH/2022.1. Available: https://apps.who.int/iris/bitstream/handle/10665/353158/WHO-HEP-ECH-WSH-2022.1-eng.pdf?sequence=1 .
- 36. Gertler PJ, Martinez S, Premand P, Rawlings LB, Vermeersch CMJ. Impact Evaluation in Practice, Second Edition. Washington, DC: Inter-American Development Bank and World Bank; 2016. https://doi.org/10.1596/978-1-4648-0779-4
- 45. Stanford University. Codiga Resource Recovery Center at Stanford. In: Stanford Engineering [Internet]. [cited 24 Feb 2023]. Available: https://cr2c.stanford.edu/ .
- 46. Stanford University. Wastewater Analysis. In: Stanford COVID-19 Health Alerts [Internet]. [cited 17 Mar 2023]. Available: https://healthalerts.stanford.edu/covid-19/wastewater-dashboard/ .
- 47. City of Palo Alto. Regional Water Quality Control Plant. In: cleanbay.org [Internet]. [cited 24 Feb 2023]. Available: https://cleanbay.org/our-programs/regional-water-quality-control-plant/ .
- 48. Metcalf & Eddy Inc., Tchobanoglous G, Burton FL, Tsuchihashi R, Stensel HD. Processing and Treatment of Sludges. 5th ed. Wastewater Engineering: Treatment and Resource Recovery. 5th ed. New York, NY, USA: McGraw-Hill Professional; 2013. p. 1487.
- 59. Stanford University. COVID-19 resources for the Stanford community. In: Stanford COVID-19 Health Alerts [Internet]. [cited 24 Feb 2023]. Available: https://healthalerts.stanford.edu/covid-19 .
- 61. Stanford University. Academic Dates. In: Stanford Student Services [Internet]. [cited 24 Feb 2023]. Available: https://studentservices.stanford.edu/calendar/academic-dates .
- 63. U.S. Centers for Disease Control and Prevention. Symptoms of COVID-19. 26 Oct 2022 [cited 22 Feb 2023]. Available: https://www.cdc.gov/coronavirus/2019-ncov/symptoms-testing/symptoms.html .
- 67. County of Santa Clara. Success in Vaccinating Most County Residents and Low COVID-19 Case Rates Allow Health Officer to Adopt New, More Focused Local Order. In: Santa Clara County Public Health [Internet]. 18 May 2021 [cited 3 Aug 2023]. Available: https://covid19.sccgov.org/news-releases/pr-05-18-2021-scc-adopts-more-focused-local-health-order .
- 68. California Department of Public Health. Blueprint for a Safer Economy. In: California Department of Public Health [Internet]. 15 Jun 2021 [cited 3 Aug 2023]. Available: https://www.cdph.ca.gov/Programs/CID/DCDC/Pages/COVID-19/COVID19CountyMonitoringOverview.aspx .
- 69. County of Santa Clara. Bay Area Health Officials Urge Immediate Vaccination and Issue Orders Requiring Use of Face Coverings Indoors to Prevent the Spread of COVID-19 ‐ Emergency Operations Center ‐ County of Santa Clara. In: Santa Clara County Public Health [Internet]. 2 Aug 2021 [cited 3 Aug 2023]. Available: https://covid19.sccgov.org/news-releases/pr-08-02-2021-health-officials-urge-immediate-vaccination-and-require-face-covering-indoors .
- 70. County of Santa Clara. County of Santa Clara Universal Indoor Mask Requirement to Transition to a Recommendation March 2. In: Santa Clara County Public Health [Internet]. 1 Mar 2022 [cited 3 Aug 2023]. Available: https://covid19.sccgov.org/news-releases/pr-03-01-2022-indoor-mask-requirement-transitions-to-recommendation .
- 72. U.S. Centers for Disease Control and Prevention. What is Case Surveillance? 27 Mar 2023 [cited 31 Aug 2023]. Available: https://www.cdc.gov/nndss/about/index.html .
- 83. Stanford University. Update for Stanford community on unvaccinated employee testing and face coverings. In: Stanford COVID-19 Health Alerts [Internet]. 28 Jul 2021 [cited 22 Aug 2023]. Available: https://healthalerts.stanford.edu/covid-19/2021/07/28/update-for-stanford-community-on-unvaccinated-employee-testing-and-face-coverings/ .
- 96. San José-Santa Clara Regional Wastewater Facility. In: City of San Jose [Internet]. [cited 16 Jun 2022]. Available: https://www.sanjoseca.gov/your-government/environment/water-utilities/regional-wastewater-facility .
A case study of using artificial neural networks to predict heavy metal pollution in Lake Iznik
- Published: 29 May 2024
- Volume 196 , article number 586 , ( 2024 )
Cite this article

- Berna Kırıl Mert 1 &
- Deniz Kasapoğulları 1
130 Accesses
Explore all metrics
Artificial neural networks offer a viable route in assessing and understanding the presence and concentration of heavy metals that can cause dangerous complications in the wider context of water quality prediction for the sustainability of the ecosystem. In order to estimate the heavy metal concentrations in Iznik Lake, which is an important water source for the surrounding communities, characterization data were taken from five different water sources flowing into the lake between 2015 and 2021. These characterization results were evaluated with IBM SPSS Statistics 23 software, with the addition of the lake water quality system. For this purpose, seven distinct physicochemical parameters were measured and monitored in Karasu, Kırandere, Olukdere and Sölöz water sources flowing into the lake, to serve as input data. Concentration levels of 15 distinct heavy metals in Karsak Stream originating from the lake were as the output. Specifically, Sn for Karasu (0.999), Sb for Kırandere (1.000), Cr for Olukdere (1.000) and Pb and Se for Sölöz (0.995) indicate parameter estimation R 2 coefficients close to 1.000. Sn stands out as the common heavy metal parameter with best estimation prospects. Given the importance of the independent variable in estimating heavy metal pollution, conductivity, COD, COD and temperature stood out as the most effective parameters for Karasu, Olukdere, Kırandere and Sölöz, respectively. The ANN model emerges as a good prediction tool that can be used effectively in determining the heavy metal pollution in the lake as part of the efforts to protect the water budget of Lake Iznik and to eliminate the existing pollution.
This is a preview of subscription content, log in via an institution to check access.
Access this article
Price includes VAT (Russian Federation)
Instant access to the full article PDF.
Rent this article via DeepDyve
Institutional subscriptions
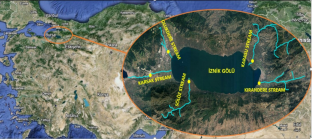
Heavy metal monitoring, analysis and prediction in lakes and rivers: state of the art.

Application of Machine Learning–ANN in Predicting the Pollution Index of Sanganur Stream in Coimbatore City, Tamil Nadu, India
Application of artificial neural network in water quality index prediction: a case study in little akaki river, addis ababa, ethiopia, data availability.
Not applicable.
Abbas, S. H., Khudair, B. H., & Jaafar, M. H. (2019). Water quality assessment and total dissolved solids prediction for Tigris river in Baghdad city using mathematical models. Journal of Engineering Science and Technology, 14 (6), 3337–3346.
Google Scholar
Agah, A., & Soleimanpourmoghadam, N. (2020). Design and implementation of heavy metal prediction in acid mine drainage using multi-output adaptive neuro-fuzzy inference systems (ANFIS) - A case study. International Journal of Mining and Geo-Engineering, 54–1 , 59–64. https://doi.org/10.22059/IJMGE.2019.278558.594794
Article Google Scholar
Akbulak, C. (2006). İznik Gölü Depresyonunun Beşeri ve İktisadi Coğrafya Açısından İncelenmesi İstanbul Üniversitesi . Coğrafya Anabilim Dalı, Doktora Tezi, İstanbul: Sosyal Bilimler Enstitüsü.
Akıner, M. E., & Akıner, İ. (2021). Water quality analysis of drinking water resource lake Sapanca and suggestions for the solution of the pollution problem in the context of sustainable environment approach. Sustainability, 13 (7), 3917. https://doi.org/10.3390/su13073917
Article CAS Google Scholar
Akkoyunlu, A. (2003). Evaluation of eutrophication process in Lake Iznik. Fresenius Environmental Bulletin, 12 (7), 801–807.
CAS Google Scholar
Akkoyunlu, A., & Akiner, M. E. (2010). Feasibility assessment of data-driven models in predicting pollution trends of Omerli Lake, Turkey. Water Resources Management, 24 , 3419–3436. https://doi.org/10.1007/s11269-010-9613-0
Alaqouri, H. A. A., Genc, C. O., Aricak, B., Kuzmina, N., Menshikov, S., & Cetin, M. (2020). The possibility of using Scots pine needles as biomonitor in determination of heavy metal accumulation. Environmental Science and Pollution Research, 27 , 20273–20280. https://doi.org/10.1007/s11356-020-08449-1
Al-Fahdawi, A. A. H., Rabee, A. M., & Al-Hirmizy, S. M. (2015). Water quality monitoring of Al-Habbaniyah Lake using remote sensing and in situ measurements. Environmental Monitoring and Assessment, 187 , 367. https://doi.org/10.1007/s10661-015-4607-2
Alizamir, M., & Sobhanardakani, S. (2016). Forecasting of heavy metals concentration in groundwater resources of Asadabad plain using artificial neural network approach. Journal of Advances in Environmental Health Research, 4 (2), 68–77.
Alpaslan, K., Karakaya, G., Küçükyılmaz, M., & Koçer, M. (2015). Kalecik ve Cip Baraj Göllerinin (Elazığ) kıyı bölgesinde su kalitesinin mevsimsel değişimi. Aquaculture Studies, 15 (1), 3–10.
Anonymous. (2017). T.R. Ministry of forestry and water affairs, general directorate of water management. Lakes and Wetlands Action Plan (2017–2023), Ankara, Turkey.
APHA. (2005). Standard methods for the examination of water and wastewater (21st edn). American Public Health Association Washington DC.
Aradpour, S., Noori, R., Naseh, M. R. V., Hosseinzadeh, M., Safavi, S., Ghahraman-Rozegar, F., & Maghrebi, M. (2021). Alarming carcinogenic and non-carcinogenic risk of heavy metals in Sabalan Dam Reservoir, Northwest of Iran. Environmental Pollutants and Bioavailability, 33 (1), 278–291. https://doi.org/10.1080/26395940.2021.1978868
Aradpour, S., Noori, R., Tang, Q., Bhattarai, R., Hooshyaripor, F., Hosseinzadeh, M., Haghighi, A. T., & Klöve, B. (2020). Metal contamination assessment in water column and surface sediments of a warm monomictic man-made lake: Sabalan Dam Reservoir Iran. Hydrology Research, 51 , 4.
Arefinia, A., Bozorg-Haddad, O., Oliazadeh, A., & Loáiciga, H. A. (2020). Reservoir water quality simulation with data mining models. Environmental Monitoring and Assessment, 192 (7), 1–13. https://doi.org/10.1007/s10661-020-08454-4
Asadollah, S. B. H. S., Sharafati, A., Motta, D., & Yaseen, Z. M. (2021). River water quality index prediction and uncertainty analysis: A comparative study of machine learning models. Journal of Environmental Chemical Engineering, 9 , 104599. https://doi.org/10.1016/j.jece.2020.104599
Aşıkkutlu, B., Gümüş, N. E., & Akköz, C. (2021). Water quality properties of Acı Lake and Meke Lake (Konya, Turkey). Limnofısh-Journal of Limnology and Freshwater Fisheries Research, 7 (3), 260–270. https://doi.org/10.17216/LimnoFish.799091
Ateş, A., Demirel, H., Köklü, R., Çetin Doğruparmak, Ş., Altundağ, H., & Şengörür, B. (2020). Seasonal source apportionment of heavy metals and physicochemical parameters: A case study of Sapanca lake watershed. Journal of Spectroscopy , 1–11. https://doi.org/10.1155/2020/7601590
Başar, H., Gürel, S., & Katkat, A. V. (2004). İznik gölü havzasında değişik su kaynaklarıyla sulanan toprakların ağır metal içerikleri. Uludağ Üniversitesi, Ziraat Fakültesi Dergisi, 18 (1), 93–104.
Başkan, M. B., & Atalay, N. (2014). İçme ve sulama sularında bor kirliliği ve bor giderme yöntemleri. Pamukkale Üniversitesi Mühendislik Bilimleri Dergisi, 20 (3), 78–84. https://doi.org/10.5505/pajes.2014.47955
Bayatzadeh Fard, Z., Ghadimi, F., & Fattahi, H. (2017). Use of artificial intelligence techniques to predict distribution of heavy metals in groundwater of Lakan lead-zinc mine in Iran. Journal of Mining and Environment, 8 (1), 35–48. https://doi.org/10.22044/jme.2016.592
Benli, F. (2005). Legal evaluation of the ban imposed on university students who wear the headscarf subsequent to the ECtHR’S ruling in Leyla Sahin V Turkey . AKDER: Organization for Women’s Rights Against Discrimination.
Berger, B., & Dallinger, R. (1993). Terrestrial snails as quantitative indicators of environmental metal pollution. Environmental Monitoring and Assessment, 25 (1), 65–84.
Budakoğlu, M. (2000). Hydrogeochemistry of Lake Iznik and geostatistical evaluation of the results, Doctoral dissertation, Geological Engineering, Institute of Science and Technology, Istanbul Technical University, Istanbul, Turkey.
BUSKI (Bursa Water and Sewerage Administration). (2022). Pollution monitoring parameters from https://www.buski.gov.tr/KirlilikDegerleri/KirlilikDegerleri
Chebud, Y., Naja, G. M., Rivero, R. G., & Melesse, A. M. (2012). Water quality monitoring using remote sensing and an artificial neural network. Water, Air, & Soil Pollution, 223 , 4875–4887. https://doi.org/10.1007/s11270-012-1243-0
Chen, Y., Song, L., Liu, Y., Yang, L., & Li, D. (2020). A review of the artificial neural network models for water quality prediction. Applied Sciences, 10 (17), 5776. https://doi.org/10.3390/app10175776
Chou, J. S., Ho, C. C., & Hoang, H. S. (2018). Determining quality of water in reservoir using machine learning. Ecological Informatics, 44 , 57–75. https://doi.org/10.1016/j.ecoinf.2018.01.005
Çiçek, N. L., & Yamuç, F. (2017). Using epilithic algae assemblages to assess water quality in Lake Kovada and Kovada Channel (Turkey), and in relation to environmental factors. Turkish Journal of Fisheries and Aquatic Sciences, 17 (4), 701–711. https://doi.org/10.4194/1303-2712-v17_4_06
Dede, A. (2009). İznik göl suyu kalite parametrelerinin yapay sinir ağlarıyla değerlendirilmesi . Fen Bilimleri Enstitüsü, İnşaat Mühendisliği Bölümü, Yüksek Lisans Tezi, İstanbul: İstanbul Teknik Üniversitesi.
Duman, F., Aksoy, A., & Demirezen, D. (2007). Seasonal variability of heavy metals in surface sediment of Lake Sapanca Turkey. Environmental Monitoring and Assessment, 133 (1), 277–283. https://doi.org/10.1007/s10661-006-9580-3
EC. (2015). European Communities. Commission directive 2015 CD (EU) 2015/1787 of 6 October 2015 Amending Annexes II and III to Council Directive 98/83/EC on the Quality of Water Intended for Human Consumption. European Council, Brussels, Belgium.
Elzwayie, A., Afan, H. A., Allawi, M. F., & El-Shafie, A. (2017a). Heavy metal monitoring, analysis and prediction in lakes and rivers: State of the art. Environmental Science and Pollution Research, 24 , 12104–21211. https://doi.org/10.1007/s11356-017-8715-0
Elzwayie, A., El-Shafie, A., Yaseen, Z. M., Afan, H. A., & Allawi, M. F. (2017b). RBFNN-based model for heavy metal prediction for different climatic and pollution conditions. Neural Computing and Applications, 28 , 1991–2003. https://doi.org/10.1007/s00521-015-2174-7
Erdogan, M. (2018). Comparison of water quality of Poyrazlar, Küçük Akgöl and Taşkısı Lakes, Institute of Natural and Applied Sciences, Department of Biology, Master’s thesis, Sakarya University, Turkey.
Fayaz, M., Meraj, G., Khader, S. A., & Farooq, M. (2022). ARIMA and SPSS statistics based assessment of landslide occurrence in western Himalayas. Environmental Challenges, 9 , 100624. https://doi.org/10.1016/j.envc.2022.100624
Gad, M., El-Safa, A., Magda, M., Farouk, M., Hussein, H., Alnemari, A. M., Elsayed, S., Khalifa, M. M., Moghanm, F. S., Eid, E. M., & Saleh, A. H. (2021). Integration of water quality indices and multivariate modeling for assessing surface water quality in Qaroun Lake Egypt. Water, 13 (16), 2258. https://doi.org/10.3390/w13162258
Garipoğlu, N., and Uzun, M. (2019). İznik Gölü Havzası’nda Doğal Ortam Koşulları, Değişimler ve Muhtemel Risklerin Havza Yönetimi ve Planlamasına Etkisi. Doğu Coğrafya Dergisi , 1–15. https://doi.org/10.17295/ataunidcd.621776
Githaiga, K. B., Njuguna, S. M., Gituru, R. W., & Yan, X. (2021). Water quality assessment, multivariate analysis and human health risks of heavy metals in eight major lakes in Kenya. Journal of Environmental Management, 297 , 113410. https://doi.org/10.1016/j.jenvman.2021.113410
Goher, M. E., Ali, M. H., & El-Sayed, S. M. (2009). Heavy metals contents in Nasser Lake and the Nile River, Egypt: An overview. Egyptian Journal of Aquatic Research, 45 (4), 301–312. https://doi.org/10.1016/j.ejar.2019.12.002
Gümüş, N. E., & Akköz, C. (2020). Eber Gölü (Afyonkarahisar) su kalitesinin araştırılması. Journal of Limnology and Freshwater Fisheries Research, 6 (2), 153–163. https://doi.org/10.17216/limnofish.638567
Haghnazar, H., Belmont, P., Johannesson, K. H., Aghayani, E., & Mehraein, M. (2023). Human-induced pollution and toxicity of river sediment by potentially toxic elements (PTEs) and accumulation in a paddy soil-rice system: A comprehensive watershed-scale assessment. Chemosphere, 311 , 136842. https://doi.org/10.1016/j.chemosphere.2022.136842
Ibrahim, M. I., Mohamed, L. A., Mahmoud, M. G., Shaban, K. S., Fahmy, M. A., & Ebeid, M. H. (2019). Potential ecological hazards assessment and prediction of sediment heavy metals pollution along the Gulf of Suez Egypt. Egyptian Journal of Aquatic Research, 45 (4), 329–335. https://doi.org/10.1016/j.ejar.2019.12.003
Ileri, S., Karaer, F., Kâtip, A., & Sonay, O. (2014). Sığ göllerde su kalitesi değerlendirmesi, Uluabat Gölü örneği. Uludağ Üniversitesi Mühendislik Fakültesi Dergisi, 19 (1), 47–57. https://doi.org/10.17482/uujfe.58132
Imani, M., Hasan, M. M., Bittencourt, L. F., McClymont, K., & Kapelan, Z. (2021). A novel machine learning application: Water quality resilience prediction Model. Science of the Total Environment, 768 , 144459. https://doi.org/10.1016/j.scitotenv.2020.144459
Islam, M. S., Khalid, Z. B., Gabar, S. M., & Yahaya, F. M. (2022). Heavy metals pollution sources of the surface water of the Tunggak and Balok river in the Gebeng industrial area, Pahang, Malaysia. International Journal of Energy and Water Resources, 6 (1), 113–120. https://doi.org/10.1007/s42108-021-00171-z
Karahan, M. (2015). Turizm Talebinin Yapay Sinir Ağalari Yöntemiyle Tahmin Edilmesi. Süleyman Demirel Üniversitesi İktisadi Ve İdari Bilimler Fakültesi Dergisi, 20 (2), 195–209.
Karmakar, B., Singh, M. K., Choudhary, B. K., Singh, S. K., Egbueri, J. C., Gautam, S. K., & Rawat, K. S. (2021). Investigation of the hydrogeochemistry, groundwater quality, and associated health risks in industrialized regions of Tripura, northeast India. Environmental Forensics, 1–22 ,. https://doi.org/10.1080/15275922.2021.2006363
Kasapoğulları, D. (2022). Yapay sinir ağlari ile İznik Gölü ağır metal parametrelerinin değerlendirilmesi . Yüksek Lisans Tezi, Sakarya: Sakarya Üniversitesi Fen Bilimleri Enstitüsü.
Katip, A. (2018). The usage of artificial neural networks in microbial water quality modeling: A case study from the lake Iznik. Applied Ecology and Environmental Research, 16 , 3897–3917. https://doi.org/10.15666/aeer/1604_38973917
Khadija, D., Hicham, A., Rida, A., Hicham, E., Nordine, N., & Najlaa, F. (2021). Surface water quality assessment in the semi-arid area by a combination of heavy metal pollution indices and statistical approaches for sustainable management. Environmental Challenges, 5 , 100230. https://doi.org/10.1016/j.envc.2021.100230
Khudair, W. S., & Al-Khafajy, D. G. S. (2018). Influence of heat transfer on magneto hydrodynamics oscillatory flow for Williamson fluid through a porous medium. Iraqi Journal of science, 59 (1B), 389–397. https://doi.org/10.24996/ijs.2018.59.1B.18
Kükrer, S., & Mutlu, E. (2019). Assessment of surface water quality using water quality index and multivariate statistical analyses in Saraydüzü Dam Lake, Turkey. Environmental Monitoring and Assessment , 191 (71). https://doi.org/10.1007/s10661-019-7197-6
Kumar, N. J., Hiren, S. O. N. I., & Kumar, R. N. (2006). Biomonitoring of selected freshwater macrophytes to assess lake trace element contamination: A case study of Nal Sarovar Bird Sanctuary, Gujarat. India. Journal of Limnology, 65 (1), 9.
Liu, T., Gao, X., Zhang, X., & Li, C. (2020). Distribution and assessment of hydrogeochemical processes of F-rich groundwater using PCA model: A case study in the Yuncheng Basin, China. Acta Geochimica, 39 , 216–225. https://doi.org/10.1007/s11631-019-00374-6
Lu, H., Li, H., Liu, T., Fan, Y., Yuan, Y., Xie, M., & Qian, X. (2019). Simulating heavy metal concentrations in an aquatic environment using artificial intelligence models and physicochemical indexes. Science of the Total Environment, 694 , 133591. https://doi.org/10.1016/j.scitotenv.2019.133591
Mahaffey, K. R. (1983). Sources of lead in the urban environment. American Journal of Public Health, 73 (12), 1357–1358.
Meraj, G., Kanga, S., Ambadkar, A., Kumar, P., Singh, S. K., Farooq, M., Johnson, B. A., Rai, A., & Sahu, N. (2022). Assessing the yield of wheat using satellite remote sensing-based machine learning algorithms and simulation modeling. Remote Sensing, 14 (13), 3005. https://doi.org/10.3390/rs14133005
Meşeli, A. (2010). İznik Gölü Havzasında Çevre Sorunları. Dicle Üniversitesi Ziya Gökalp Eğitim Fakültesi, 14 (2010), 134–148.
Naderian, D., Noori, R., Heggy, E., Bateni, S. M., Bhattarai, R., Nohegar, A., & Sharma, S. (2024). A water quality database for global lakes. Resources, Conservation & Recycling, 202 , 107401.
Nhantumbo, C., Carvalho, F., Uvo, C., Larsson, R., & Larson, M. (2018). Applicability of a processes-based model and artificial neural networks to estimate the concentration of major ions in rivers. Journal of Geochemical Exploration, 193 , 32–40. https://doi.org/10.1016/j.gexplo.2018.07.003
Nodefarahani, M., Aradpour, S., Noori, R., Tang, Q., Partani, S., & Klöve, B. (2020). Metal pollution assessment in surface sediments of Namak Lake Iran. Environmental Science and Pollution Research, 27 , 45639–45649.
Noori, R., Berndtsson, R., Hosseinzadeh, M., Adamowski, J. F., & Abyaneh, M. R. (2019). A critical review on the application of the national sanitation foundation water quality index. Environmental Pollution, 244 , 575–587. https://doi.org/10.1016/j.envpol.2018.10.076
Noori, R., Karbassi, A.R., Ashrafi, Kh., Ardestani, M. Mehrdadi, N. (2011). Development and application of reduced-order neural network model based on proper orthogonal decomposition for BOD 5 monitoring: Active and online prediction department of environmental engineering. Environmental Progress & Sustainable Energy , 32 (1). https://doi.org/10.1002/ep.10611
Obiewa, J. O., Kariuki, D. K., & Wachıra-Mbui, D. N. (2020). Artificial neural network for prediction of pollution load of lead, copper, and cadmium in a water resource: A case Study of River Sosiani, Eldoret Municipality, Kenya. Africa Journal of Physical Sciences , 5 (2). (ISSN: 2313–3317)
Oinam, J. D., Ramanathan, A. L., Linda, A., & Singh, G. (2011). A study of arsenic, iron and other dissolved ion variations in the groundwater of Bishnupur District, Manipur India. Environmental Earth Sciences, 62 (6), 1183–1195. https://doi.org/10.1007/s12665-010-0607-2
Oktem, Y. A., Gumus, M., & Yilmaz, G. B. (2012). The potential sources of pollution affecting the water quality of Lake Iznik. – International Journal of Electronics. Mechanical and Mechatronics Engineering, 2 (3), 225–232.
Ong, M. H. A., & Puteh, F. (2017). Quantitative data analysis: Choosing between SPSS, PLS and AMOS in social science research, International Interdisciplinary. Journal of Scientific Research, 3 (1), 14–25. ISSN: 2200-9833.
Ortakaya, Z. (2022). Taxonomic and ecological studies on lichens distributed on the coast and lake shores of Bursa (Turkey), Master’s thesis, Institute of Science and Technology, Bursa Uludağ University, Bursa, Turkey. http://hdl.handle.net/11452/29104
Öztürk, M., Özözen, G., Minareci, O., & Minareci, E. (2009). Determination of heavy metals in fish, water and sediments of Avsar dam Lake in Turkey. Iran Journal of Environmental Health Science & Engineering, 6 , 73–8073.
Özuluǧ, M., Altun, Ö., Meriç, N. (2005). On the fish fauna of Lake Iznık (Turkey). Turkish Journal of Zoology, 29 (4), 371–375. https://www.journals.tubitak.gov.tr/zoology/vol29/iss4/13
Pal, A., Kumari, A., & Zaidi, J. (2013). Water quality index (WQI) of three historical lakes in Mahoba district of Bundelkhand region, Uttar Pradesh. India Asian Journal of Science and Technology, 4 , 48–53.
Sakan, S., Đorđević, D., Dević, G., Relić, D., Anđelković, I., & Ðuričić, J. (2011). A study of trace element contamination in river sediments in Serbia using microwave-assisted aqua regia digestion and multivariate statistical analysis. Microchemical Journal, 99 (2), 492–502. https://doi.org/10.1016/j.microc.2011.06.027
Şener, Ş., & Kırlangıç, E. (2014). Efteni Gölü (Düzce) Sulak Alanı ve Çevresinin Hidrojeoloji İncelemesi. Afyon Kocatepe University Journal of Science & Engineering , 14 (2). https://doi.org/10.5578/fmbd.7768
Shakerı, A. A., Gholamalızadeh, A. A., & Soltani, J. (2013). Artificial neural network (ANN) approach for predicting cu concentration in drinking water of chahnimeh1 reservoir in Sistan-Balochistan .
Sharpley, A. N., Daniel, T., Sims, T., Lemunyon, J., Stevens, R., Parry, R. (2003). Agricultural phosphorus and eutrophication, 2nd ed. U.S. Department of Agriculture, Agricultural Research Service, ARS–149, pp. 44. https://www.ars.usda.gov/np/index.html
Sinha, K. K., Gupta, M. K., Banerjee, M. K., Meraj, G., Singh, S. K., Kanga, S., Farooq, M., Kumar, P., & Sahu, N. (2022). Neural network-based modeling of water quality in Jodhpur India. Hydrology, 9 (5), 92. https://doi.org/10.3390/hydrology9050092
Song, T., Su, X., He, J., Liang, Y., & Zhou, T. (2018). Source apportionment and health risk assessment of heavy metals in agricultural soils in Xinglonggang, Northeastern China. Human and Ecological Risk Assessment: An International Journal, 24 (2), 509–521. https://doi.org/10.1080/10807039.2017.1392232
Sönmez, İ, Kaplan, M., & Sönmez, S. (2008). Kimyasal gübrelerin çevre kirliliği üzerine etkileri ve çözüm önerileri. Derim, 25 (2), 24–34.
Srivastava, G., & Kumar, P. (2013). Water quality index with missing parameters. International Journal of Research in Engineering and Technology, 2 (4), 609–614.
Teksoy, A., Katip, A., & Nalbur, B. E. (2019). Karsak Deresi’nde Su Kalitesinin İzlenmesi Ve Gemlik Körfezi’ne Etkisinin Değerlendirilmesi. Uludağ University Journal of The Faculty of Engineering, 24 (1), 171–180. https://doi.org/10.17482/uumfd.463430
TSE -TS 266. (2005). Regulation on water for human consumption, water-drinking and utility water: Turkish Standards Institute. UDK 663. 7: 543, Ankara, Turkey.
Ucun Ozel, H., Gemici, B. T., Gemici, E., Ozel, H. B., Cetin, M., & Sevik, H. (2020). Application of artificial neural networks to predict the heavy metal contamination in the Bartin River. Environmental Science and Pollution Research, 27 , 42495–42512. https://doi.org/10.1007/s11356-020-10156-w
Uddin, M. N., Alam, M. S., Mobin, M. N., & Miah, M. A. (2014). An assessment of the river water quality parameters: A case of Jamuna River. Journal of Environmental Science and Natural Resources, 7 (1), 249–256. https://doi.org/10.3329/jesnr.v7i1.22179
Uddin, M., Kormoker, T., Siddique, M. D. A. B., Billah, Md. M., Rokonuzzaman, Md., Al Ragib, A., Proshadg, R., Hossaini, M. D. Y., Haquej, M. D. K., & Idris, A. M. (2023). An overview on water quality, pollution sources, and associated ecological and human health concerns of the lake water of megacity: A case study on Dhaka city lakes in Bangladesh. Urban Water Journal, 20 (3), 261–277. https://doi.org/10.1080/1573062X.2023.2169171
Unlü, S., & Alpar, B. (2016). An assessment of trace element contamination in the freshwater sediments of Lake Iznik (NW Turkey). Environmental Earth Sciences, 75 , 1–14. https://doi.org/10.1007/s12665-015-5023-1
Unlü, S., Alpar, B., Öztürk, K., & Vardar, D. (2010). Polycyclic aromatic hydrocarbons (PAHs) in the surficial sediments from Lake Iznik (Turkey): Spatial distributions and sources. Bulletin of Environmental Contamination and Toxicology, 85 , 573–580. https://doi.org/10.1007/s00128-010-0134-6
US Environmental Protection Agency (EPA). (1994). Method 3051: Micro-wave assisted acid digestion of sediments, sludges, soils and oils (3rd ed.). US Environmental Protection Agency.
Viehberg, F. A., Ülgen, U. B., Damcı, E., Franz, S. O., Ön, S. A., Roeser, P. A., Çağatay, M. N., Litt, T., & Melles, M. (2012). Seasonal hydrochemical changes and spatial sedimentological variations in Lake Iznik (NW Turkey). Quaternary International, 274 , 102–111. https://doi.org/10.1016/j.quaint.2012.05.038
Wang, X., Wuxing, L., Zhen’gao, L., Ying, T., Chrıstıe, P., & Yongming, P. (2017). Effects of long-term fertilizer applications on peanut yield and quality and on plant and soil heavy metal accumulation. Pedosphere . https://doi.org/10.1016/S1002-0160(17)60457-0
Water Pollution Control Regulation. (2015). Regulation on amendments to the surface water quality management regulation. Published in the official newspaper: Date 15 April 2015, Official newspaper number: 29327.
Wedepohl, K. H. (2000). The composition of the upper earth’s crust and the natural cycles of selected metals. Metals in raw materials. Natural Resources. In: Merian, E., (Ed.), Metals and their Compounds in the Environment, Part 1, John Wiley and Sons, New York, 3–19.
WHO (World Health Organization). (2017). Guidelines for drinking-water quality, 4th ed, incorporating the 1st addendum. https://www.who.int/publications/i/item/9789241549950
Wu, Z., Lai, X., & Li, K. (2021). Water quality assessment of rivers in Lake Chaohu Basin (China) using water quality index. Ecological Indicators, 121 , 107021. https://doi.org/10.1016/j.ecolind.2020.107021
WWF (Wildlife Conservation Foundation). (2011). Protection of Turkey’s wetland problems and solution suggestions. World Wildlife Fund Türkiye Information Note. https://www.ftr.awsassets.panda.org/downloads/2subat_bilginotu_1.pdf
Xu, J., Chen, Y., Zheng, L., Liu, B., Liu, J., & Wang, X. (2018). Assessment of heavy metal pollution in the sediment of the main tributaries of Dongting Lake China. Water, 10 (8), 1060. https://doi.org/10.3390/w10081060
Yazıcı, Ö. (2020). İznik-Mekece Arasında Jeomorfolojik Gözlemler. Anemon Muş Alparslan Üniversitesi Sosyal Bilimler Dergisi, 8 (1), 125–138. https://doi.org/10.18506/anemon.520859
Zubaidi, S. L., Ortega-Martorell, S., Al-Bugharbee, H., Olier, I., Hashim, K. S., Gharghan, S. K., Kot, P., & Al-Khaddar, R. (2020). Urban water demand prediction for a city that suffers from climate change and population growth: Gauteng province case study. Water, 12 (7), 1885. https://doi.org/10.3390/w12071885
Download references
Author information
Authors and affiliations.
Department of Environmental Engineering, Sakarya University, Sakarya, Turkey
Berna Kırıl Mert & Deniz Kasapoğulları
You can also search for this author in PubMed Google Scholar
Contributions
Assist. Prof. Dr. Berna Kırıl Mert: Supervisor: Conceptualization, Methodology, Data curation, Formal analysis, Writing-Original Draft, Review&Editing, Visualization, Supervision, Deniz Kasapoğulları: Graduate Student: Data collection, Data analysis, Resources.
Corresponding author
Correspondence to Berna Kırıl Mert .
Ethics declarations
Ethics approval.
All authors have read, understood, and have complied as applicable with the statement on “Ethical responsibilities of Authors” as found in the Instructions for Authors.
Competing interests
The authors declare no competing interests.
Additional information
Publisher's note.
Springer Nature remains neutral with regard to jurisdictional claims in published maps and institutional affiliations.
Rights and permissions
Springer Nature or its licensor (e.g. a society or other partner) holds exclusive rights to this article under a publishing agreement with the author(s) or other rightsholder(s); author self-archiving of the accepted manuscript version of this article is solely governed by the terms of such publishing agreement and applicable law.
Reprints and permissions
About this article
Mert, B.K., Kasapoğulları, D. A case study of using artificial neural networks to predict heavy metal pollution in Lake Iznik. Environ Monit Assess 196 , 586 (2024). https://doi.org/10.1007/s10661-024-12730-y
Download citation
Received : 11 June 2023
Accepted : 17 May 2024
Published : 29 May 2024
DOI : https://doi.org/10.1007/s10661-024-12730-y
Share this article
Anyone you share the following link with will be able to read this content:
Sorry, a shareable link is not currently available for this article.
Provided by the Springer Nature SharedIt content-sharing initiative
- Water quality
- Heavy metal parameter
- Artificial neural networks
- Conservation
- Find a journal
- Publish with us
- Track your research
- Open access
- Published: 27 May 2024
Fog-based deep learning framework for real-time pandemic screening in smart cities from multi-site tomographies
- Ibrahim Alrashdi 1
BMC Medical Imaging volume 24 , Article number: 123 ( 2024 ) Cite this article
206 Accesses
Metrics details
The quick proliferation of pandemic diseases has been imposing many concerns on the international health infrastructure. To combat pandemic diseases in smart cities, Artificial Intelligence of Things (AIoT) technology, based on the integration of artificial intelligence (AI) with the Internet of Things (IoT), is commonly used to promote efficient control and diagnosis during the outbreak, thereby minimizing possible losses. However, the presence of multi-source institutional data remains one of the major challenges hindering the practical usage of AIoT solutions for pandemic disease diagnosis. This paper presents a novel framework that utilizes multi-site data fusion to boost the accurateness of pandemic disease diagnosis. In particular, we focus on a case study of COVID-19 lesion segmentation, a crucial task for understanding disease progression and optimizing treatment strategies. In this study, we propose a novel multi-decoder segmentation network for efficient segmentation of infections from cross-domain CT scans in smart cities. The multi-decoder segmentation network leverages data from heterogeneous domains and utilizes strong learning representations to accurately segment infections. Performance evaluation of the multi-decoder segmentation network was conducted on three publicly accessible datasets, demonstrating robust results with an average dice score of 89.9% and an average surface dice of 86.87%. To address scalability and latency issues associated with centralized cloud systems, fog computing (FC) emerges as a viable solution. FC brings resources closer to the operator, offering low latency and energy-efficient data management and processing. In this context, we propose a unique FC technique called PANDFOG to deploy the multi-decoder segmentation network on edge nodes for practical and clinical applications of automated COVID-19 pneumonia analysis. The results of this study highlight the efficacy of the multi-decoder segmentation network in accurately segmenting infections from cross-domain CT scans. Moreover, the proposed PANDFOG system demonstrates the practical deployment of the multi-decoder segmentation network on edge nodes, providing real-time access to COVID-19 segmentation findings for improved patient monitoring and clinical decision-making.
Peer Review reports
Introduction
Pandemic diseases have become increasingly confronting for public infrastructure globally, with their extensive transmission and severe effects on individuals and communities. The rapid and perfect diagnosis of these diseases is of paramount importance for effective control and mitigation strategies [ 1 ]. The landscape of healthcare technology has been encountering a revolutionary shift in the wake of the COVID-19 pandemic, which highlighted the serious need for improved and adaptive solutions that can provide rapid and accurate diagnosis of pandemic diseases, particularly in urban environments where population density and mobility amplify the challenges of pandemic management [ 2 ].
Smart cities, the epitome of urban innovation, demonstrate the revolutionary role of integrating technologies in urban management. Specifically, the recent challenges modeled by the COVID-19 pandemic have prompted the conjunction of smart city technologies and pandemic control mechanisms. The process of screening pandemic disease is an essential element of public health surveillance and is now being reimagined and sustained through the application of cutting-edge technologies including real-time data analytics, predictive analytics, and fast reply apparatuses are at the vanguard of this evolving method [ 2 ]. Leading nations in this new paradigm of pandemic containment in smart cities have been identified. For instance, Singapore has put in place a national contact tracing app that uses Bluetooth technology to find and notify anyone who might have come into contact with COVID-19 cases that have been confirmed. Efficient control of outbreaks has been made possible by South Korea's strong IT infrastructure, vigorous testing, and data-sharing attitude [ 3 ]. Furthermore, Taiwan's creative integration of medical records and travel history to identify possible cases was partly responsible for the pandemic's successful containment. These examples demonstrate how smart city technologies can redefine the parameters and extent of pandemic control.
As countries throughout the world struggled to contain the outbreak, smart cities and the incorporation of internet technologies showed promise as a way to improve healthcare delivery and reaction times [ 4 , 5 ]. The necessity of utilizing data-rich surroundings to promote accurate illness diagnosis and proactive decision-making in urban settings is now more important than ever in the post-COVID era. Smart cities have developed as centers of innovation that harness new technologies to address public health concerns. Specifically, the Artificial Intelligence of Things (AIoT) technology has developed as the result of the convergence between artificial intelligence (AI) and the Internet of Things (IoT) to offer a new paradigm to control pandemic diseases based on the data distributed across different geographical locations [ 6 , 7 ].
The adoption of the AIoT framework in smart cities represents a paradigm shift in the way public health challenges are addressed. The urban areas utilize the capabilities of networked devices and sensors integrated inside diverse urban infrastructures to gather huge quantities of data in real-time. This data encompasses diverse sources such as healthcare facilities, environmental sensors, wearable devices, and social media platforms [ 4 ]. With the rapid proliferation AIoT technologies in smart cities, we can efficiently process and analyze this multi-site data to gain comprehensive insights into disease dynamics, patterns, and impacts on different segments of the population. AIoT facilitates the development and deployment of advanced machine learning algorithms, which can detect patterns, predict disease outbreaks, and enable proactive interventions. The application of AIoT technologies within smart cities has the capacity to significantly improve the precision and effectiveness of pandemic disease diagnosis owing to their ability to improve public health surveillance, response strategies for pandemics, and healthcare delivery systems [ 5 ]. To achieve sustainable management of pandemic disease in smart cities with high populations, it is highly required to interpret the distribution and seriousness of infected cases, which necessitates obtaining data from different healthcare sites in smart cities.
Smart healthcare systems usually focus on collecting medical imaging datasets to be used to build AI solutions for pandemic diseases during outbreaks. This data is usually sourced from varied imaging modalities and acquired from different healthcare institutions in the same smart city or even different cities, leading to inherent variability and heterogeneity across domains of data [ 6 ]. This cross-domain/multi-site bias arises as a possible consequence of variability in the specifications of equipment, scanning protocols, patient demographics, disease manifestations, and other facets. Indeed, variations in scanning details make significant inconsistencies in image quality, resolution, and noise levels, which complicate the process of feature extraction and interpretation [ 7 ]. In addition, the dependence on imagery data sourced from a single site or imaging modality may lead the model to overfit explicit data distributions, impeding its capacity to generalize to unseen data and varied clinical situations. This inherent bias brings a major limit to the generalization performance of ML in healthcare systems [ 8 , 9 , 10 ]. Hence, overlooking this bias usually makes the ML model operate in a suboptimal way, thereby reducing the reliability of related diagnostic decisions, and making ML non-applicable in real-world clinical environments. To tackle the problems posed by cross-domain/multi-site bias, it is required to offer a concerted effort to make use of recent advances in AIoT techniques, such as fog computing, which enables distributed processing of medical imaging data at the network edge [ 11 ].
As an essential part of the AIoT system, Fog computing has been used in the design of smart cities’ services to address the scalability and latency concerns by bringing the computing resources closer to edge devices. With this computing paradigm, fog computing allows for localized processing, alleviates the need for distant data transmission, and minimizes the overall system latency, which significantly accelerates the data analysis, and cooperative decision-making in a broad range of smart city applications, such as traffic management, environmental monitoring, and public safety [ 11 ]. Moreover, the utilization of this technology serves to bolster data security and privacy measures by confining important information to the confines of the local network. Fog computing facilitates the efficient usage of resources, low-latency operations, and improved overall performance in smart cities by effectively managing the substantial amount of data created by IoT devices. This capability plays a crucial role in fully harnessing the potential of smart city deployments [ 12 , 13 ].
Our objective in this paper lies in developing a reliable AIoT framework to empower the efficiency of diagnosis processes for pandemic disease based on multi-site data fusion. The proposed framework aims to integrate diagnostic data from multiple sources, to acquire a comprehensive recognition of disease diagnosis and severity. The proposed AIoT framework is exemplified through a case study aiming at COVID-19 lesion segmentation [ 14 ]. By utilizing COVID-19 lesion segmentation as a specific application, the framework demonstrates its effectiveness in analyzing cross-domain CT scans and efficiently identifying infections. This case study serves as a practical implementation and validation of the proposed framework, showcasing its ability to accurately segment COVID-19 lesions and provide valuable insights for automatic COVID-19 pneumonia analysis. In this study, we introduce a novel technique called a multi-decoder segmentation network, which aims to enhance lung infection segmentation specifically for COVID-19 cases. a multi-decoder segmentation network is a lightweight approach that addresses the challenges posed by heterogeneous multi-site CT scans. It achieves robust performance by incorporating domain-adaptive normalization layers, which effectively handle inter-source data heterogeneity [ 15 , 16 ]. Then, we propose a novel learning strategy that leverages heterogeneous knowledge interaction to facilitate cooperative learning of semantic representations from CT images sourced from diverse data sources. The proposed framework intelligently leverages fog computing capabilities to integrate a diagnostic model of an edge fog cloud prevailing in real-world smart cities.
The left part of the study is arranged as follows. Section 2 presents a comprehensive literature review, to highlight the existing research on multi-site data fusion, AIoT, and pandemic disease diagnosis. Next, we present the case study focusing on COVID-19 lesion segmentation. Section 4 describes our proposed multi-site data fusion framework and the AIoT-based learning strategy for accurate pandemic disease diagnosis. Section 5 discusses the system design specifications. Section 6 analyzes and interprets the results, discussing the implications and potential applications of our framework. Finally, we conclude the paper by summarizing the key findings and contributions.
Related studies
This section presents a review of related research studies to gain constructive insights regarding the history of pandemic disease management in smart cities, and the related technologies in this subject matter.
Pandemic screening approaches
The literature contains a bunch of studies that have been instrumental in exploring innovative approaches and technologies to enhance screening and early detection of infectious diseases within urban environments. Allam and Jones [ 14 ] explored the amalgamation between AI and global data-sharing standards to allow for active control of urban health, explicitly throughout the outbreak of COVID-19 infection in smart cities. Their perspective paper was written one month following the initiation of the outbreak to provide surveys of the pandemic from an urban viewpoint aiming to figure out the way in which smart city networks can enable improved standardization conventions for amplified data sharing in case of epidemics. Costa and Peixoto [ 15 ] review the literature approaches for tackling the challenges imposed by the COVID-19 pandemic in smart cities. They also studied the potential solutions and reviewed the latest approaches that can be used in complicated pandemic settings, explaining reasonable and engaging development directions for the construction of health-centric smart cities. Shorfuzzaman et al. [ 16 ] studied the responsibility of video surveillance in the sustainability actions taken to control the COVID-19 pandemic in smart cities, with a primary emphasis on monitoring social distancing and ensuring mask-wearing. The authors have engaged in a discussion regarding the possible advantages of widespread video surveillance in terms of promoting public safety, facilitating traceability endeavors, and simplifying active resource management. Moreover, Ngabo et al. [ 17 ] examined the applicability of ML techniques for management pandemic across different tasks (including early diagnosis, epidemic detection, disease progression, death rates, and resource allocation), where extensive datasets were processed by ML algorithms to generate valuable insights that promote reliable decisions-making during epidemics.
AI for pandemic control in smart cities
The academic literature covers a diverse array of studies and research endeavors focused on utilizing AI to efficiently control and alleviate the consequences of pandemics in urban settings. In [ 18 ], Carmichael et al. conducted a retrospective multicenter study that involved the utilization of ML models to train a cohort of patients who were hospitalized with chronic liver disease with the aim of predicting the need for invasive mechanical ventilation (IMV) within a 48-hour timeframe specifically in patients diagnosed with COVID-19. Patients with chronic lung disease (CLD) were identified by the utilization of diagnosis codes about bacterial pneumonia, viral pneumonia, influenza, nonspecific pneumonia, and acute respiratory distress syndrome (ARDS). The candidate ML regressors encompass demographic and clinical characteristics that have been previously linked to unfavorable outcomes concerning COVID-19. Their proposed solutions were constructed by integrating logistic regression as well as three ensemble tree-based methods, namely decision tree, AdaBoost, and XGBoost. The models underwent validation in COVID-19 patients who were admitted to hospitals within two distinct healthcare systems over the period of March 2020 to July 2020. Wismüller et al. [ 19 ] introduced a methodology aimed at detecting pulmonary embolism in the early stages, specifically in the context of the COVID-19 pandemic. This strategy involved the collection of data from multiple institutions across the nation. They conducted an analysis on a comprehensive dataset obtained from several healthcare institutions in order to investigate the incidence of pulmonary embolism, a severe consequence linked to COVID-19 that has the potential to be fatal. In [ 20 ], Hooper et al. have collected inclusive data from 135 autopsy estimates of COVID-19-positive dead persons, involving histological assessment, in which postmortem inspections were executed by 36 diagnosticians at 19 health institutions or forensic centers in Brazil as well as the United States. The collection of each multi-site autopsy data was conducted through online submission of the response to open-ended surveys. Kaissis et al. [ 21 ] proposed an AI framework that preserves privacy in the context of multi-source medical imaging analysis, which aimed to tackle the issue of cooperating on medical image analysis across many institutions, while simultaneously safeguarding the privacy of patient data. The methodology described by the authors employs federated learning and safe aggregation methods to effectively train deep learning models on decentralized datasets while protecting the confidentiality of patient information.
IoT for pandemic control in smart cities
This part of the subsection explores the novel advancements and endeavors focused on the IoT within the framework of intelligent urban areas, explaining the utilization of these technologies to observe, alleviate, and address the difficulties presented by the pandemic. By conducting an extensive examination of relevant scholarly sources, we investigate the various applications and methodologies that underscore the potential of IoT-enabled solutions in effectively addressing public health emergencies within urban settings. Herath et al. [ 22 ] explored developing an intelligent system to alleviate the influence of the COVID-19 pandemic through exploring the ability of IoT technologies to allow active monitoring of patients, and reaction procedures throughout public health emergencies in urban areas. Their proposed system was configured to instantaneously collect real-time data on different attributes, counting ecological circumstances, social communications, and healthcare assets. The impact of the pandemic on the current state of smart city development was investigated by Gade et al. [ 23 ], who examined many elements including technical developments, infrastructure requirements, and regulatory changes. The researchers employed predictive modeling approaches to anticipate forthcoming trends and potential obstacles in the advancement of smart cities following the pandemic. Yang et al. [ 24 ] investigated the role of smart city projects in providing effective control of the COVID-19 pandemic with a specific focus on Chinese cities, in which in-depth analysis is dedicated to interpreting the roles of various IoT technologies in controlling the spread of the virus. They quantitatively evaluated the influence of smart city measurements and actions on decreasing the rates of infection or death and also on the rate of recovery. Umair et al. [ 25 ] conducted a study to investigate the influence of the COVID-19 pandemic on the implementation of IoT technologies across various domains within smart cities. The researchers investigated the impact of the pandemic on the utilization of IoT solutions in several regions. The purpose was to examine how these solutions have been employed to tackle issues and enhance operational effectiveness in these areas. The study conducted by Shorfuzzaman et al. [ 16 ] investigated the potential applications of video surveillance systems in monitoring public areas, enforcing social distancing measures, and improving public safety in the context of the pandemic. This study examined the potential advantages and difficulties linked to the implementation of mass video monitoring in smart cities, taking into account factors such as privacy apprehensions, data management, and ethical deliberations. The results of their study made a valuable contribution to the ongoing discussion surrounding the incorporation of surveillance technologies in the context of smart cities.
To evaluate the effectiveness of the Multi-decoder segmentation network on multi-site CT data for COVID-19 diagnosis, we conducted experiments using three publicly accessible COVID-19 CT datasets. The first dataset [ 39 ], obtained from Radiopaedia, consisted of twenty COVID-19 CT volumes with over 1,800 annotated slices. The second dataset, known as MosMedData [ 40 ], comprised 50 CT volumes collected from public hospitals in Russia. Lastly, we utilized the MedSeg dataset [ 41 ], which included nine CT volumes containing a total of 829 slices, of which 373 were confirmed positive for COVID-19. Detailed information regarding the specific parameters of each dataset can be found in the corresponding research. Samples of the collected multi-site CT data are presented in Fig. 1 . Following the preprocessing steps described in [ 12 ], we converted all three datasets into 2D images and applied random affine augmentation techniques to address any potential discrepancies. To ensure consistency across different facilities, we standardized the dimensions of all CT slices to 384 by 384, effectively reducing intensity variations. Prior to inputting the CT images into a multi-decoder segmentation network, we normalized their intensity scores to achieve a mean of zero and a variance of one. Our intensity normalization techniques encompassed bias field correction, noise filtering, and whitening, which were inspired by the methods outlined in [ 12 ] and have been validated for their effectiveness in optimizing heterogeneous learning. For our experimental setup, the multi-site data is split into 80% of the data allocated for training and the remaining 20% for testing. This partitioning allowed us to evaluate the performance of a multi-decoder segmentation network on unseen data and assess its generalization capabilities in the context of multi-site CT data fusion for COVID-19 diagnosis.

Visualization of the heterogeneity of COVID-19 CT samples orginating from different sites
Methodology
In this section, we present the proposed multi-decoder segmentation network, which serves as the cornerstone of our study, specifically designed to address the segmentation of COVID-19 lesions in CT scans obtained from various sources within the context of pandemic diseases in smart cities. Figure. 2 provides a visual representation of the architecture.

An illustrative diagram of the introduced multi-decoder segmentation network
Given the heterogeneity inherent in the data originating from different sources, our approach incorporates a comprehensive solution that includes both a global decoding path and dedicated ancillary decoding paths. This design allows the Multi-decoder segmentation network to effectively handle the challenges associated with segmenting COVID-19 lesions in CT scans from diverse origins. To tackle the inter-source variability, we introduce a re-parameterized normalization module within the ancillary decoding paths. This module plays a vital role in mitigating the impact of variations across different sources, enabling the multi-decoder segmentation network to adapt and generalize well to the unique characteristics of each dataset. By leveraging the learned heterogeneous knowledge from the ancillary paths, the ground truth (GT) masks contribute significantly to enhancing the overall network performance.
To further enhance the learning capability of the multi-decoder segmentation network, we incorporate interaction modules that facilitate the exchange of knowledge between the ancillary paths and the global paths at various levels within the network architecture. These interaction modules enable effective information sharing, enabling the multi-decoder segmentation network to leverage insights from different sources and improve the segmentation accuracy of COVID-19 lesions. This comprehensive approach ensures that the multi-decoder segmentation network can handle the specific challenges posed by the pandemic disease within smart city environments, leading to more accurate and reliable segmentation results.
Lesion encoder
Drawing inspiration from the architecture of U-Net [ 29 ], which comprises two convolutions and a max-pooling layer in each encoding block, we adopt a similar structure in a multi-decoder segmentation network. However, we enhance the feature encoding path by replacing the conventional encoder with a pre-trained ResNeXt-50 [ 30 ], retaining the initial four blocks and excluding the subsequent layers. Unlike traditional encoding modules, ResNeXt-50 incorporates a residual connection mechanism, mitigating the issue of gradient vanishing and promoting faster convergence during model training. Moreover, ResNeXt-50 employs a split-transform-merge strategy, facilitating the effective combination of multi-scale transformations. This strategy has been empirically shown to enhance the representational power of the deep learning model, particularly in capturing intricate features and patterns related to COVID-19 lesions in CT scans. By leveraging the strengths of ResNeXt-50 and its innovative architectural features, a multi-decoder segmentation network can effectively encode and extract relevant features from the input data. This enables the model to learn and represent complex spatial and contextual information, contributing to improved segmentation accuracy and the overall performance of our framework in addressing the challenges of COVID-19 lesion segmentation in smart city environments.
Domain-adaptive batch normalization layer
Recently, numerous medical imaging studies have adopted batch normalization (BN) [ 31 ] to alleviate interior covariate shift problems and to fine-tune the feature discrimination ability of CNNs; these accelerate the learning procedure. The key notion behind BN is to standardize the interior channel-wise representations, and subsequently perform an affine transformation on the generated feature maps that have optimizable parameters \(\left[\gamma ,\beta \right]\) . For specific channels \({x}_{k}\in \left[{x}_{1}\cdots \cdots ,{x}_{K}\right]\) In feature maps of K channels, their representations after being normalized \({y}_{k}\in \left[{y}_{1}\cdots \cdots ,{y}_{K}\right]\) are calculated as follows:
Symbols \(E\left[x\right]\) and \(Var\left[x\right]\) represent the average and variance of \(x\) , respectively, and \(\epsilon\) represents an infinitesimal. The BN layer accumulates the flowing \(E\left[x\right]\) and the flowing \(Var\left[x\right]\) during training to learn the global representations and exploit these quantified values to normalize features at the testing stage.
In the context of smart cities, lung CT scans are sourced from diverse origins, utilizing different scanners and acquisition protocols. Figure 2 illustrates the statistics (mean and variance) obtained from individual data sources when training the deep learning models using a normalization layer exclusively for each source. The figure demonstrates notable variations in both mean and variance across different sources, particularly in intermediate layers where the feature channels are more abundant. These observed differences in statistics across heterogeneous sources present challenges when attempting to construct a unified dataset by combining all the diverse datasets. Firstly, the statistical disparities among the heterogeneous data can complicate the learning process of global representations, as the shared kernels may disrupt the domain-specific discrepancies that are irrelevant to the common features. Secondly, during model training, the BN layers might yield imprecise estimations of global statistics due to the presence of statistical variations from heterogeneous sources [ 42 , 43 , 44 ]. Consequently, directly sharing these approximate statistics during the testing stage is likely to result in a degradation in performance. Therefore, it becomes evident that a straightforward combination of all heterogeneous datasets is not beneficial in the context of smart cities. Instead, a more sophisticated approach is required to address the statistical discrepancies and leverage the unique characteristics of each data source, enabling the development of a robust and effective DL model for accurate segmentation of COVID-19 lesions in lung CT scans. To address these issues, a reparametrized version of the normalization module is integrated into the encoder network to normalize the statistical attribute of data from heterogeneous data sources. Every source \(s\) has domain-relevant trainable parameters \(\left[{\gamma }^{s},{\beta }^{s}\right]\) . Given a specific channel \({x}_{k}\in \left[{x}_{1}\cdots \cdots ,{x}_{K}\right]\) from source \(s\) , the corresponding output \({y}_{k}^{s}\) is expressed in the form.
During the testing stage, our normalization layer applies the collected and accurate domain-relevant statistics used for the upcoming normalization of CT scans. Furthermore, we map these domain-relevant statistics to a shared latent space within the encoder, where membership to the source can be estimated through a mapping function denoted as \(\phi ({x}_{i})\) . This mapping function aligns the source-specific statistics with a shared, domain-agnostic representation space. As a result, our model can model the lesion features from different CT sources in a manner that is both source-aware and harmonized. This, in turn, makes the training process serve to harmonize discrepancies between data sources. This not only improves the capability to model domain-specific features but also promotes a more efficient and inclusive fusion of multi-site data, hence supporting the representational power of our framework.
Lesion decoder
The decoder module plays a crucial role in the gradual upsampling of feature maps, enabling the network to generate a high-resolution segmentation mask that corresponds to the original input image (refer to Fig. 2 ). It takes the low-resolution feature maps from the encoder and progressively increases their spatial dimensions while preserving the learned feature representations. In addition to upsampling, the decoder incorporates skip connections, establishing direct connections between corresponding layers in the encoder and decoder. By merging features from multiple resolutions, the decoder effectively utilizes both low-level and high-level features, allowing the network to capture contextual information at various scales.
Similar to the approach described in [ 29 ], we have implemented a powerful block to enhance the decoding process. The decoding path in our U-shaped model employs two commonly used layers: the upsampling layer and the deconvolution layer. The upsampling layer leverages linear interpolation to expand the dimensions of the image, while the deconvolution layer, also known as transposed convolution (TC), employs convolution operations to increase the image size. The TC layer enables the reconstruction of semantic features with more informative details, providing self-adaptive mapping. Hence, we propose the utilization of TC layers to restore high-level semantic features throughout the decoding path. Furthermore, to improve the computational efficiency of the model, we have replaced the traditional convolutional layers in the decoding path with separable convolutional layers. The decoding path primarily consists of a sequence of \(1\times 1\) separable convolutions, \(3\times 3\) separable TC layers, and \(1\times 1\) convolutions, applied in consecutive order. This substitution with separable convolutions helps reduce the computational complexity while maintaining the effectiveness of the model.
Knowledge fusion(KF)
After addressing the disparities among data sources in smart cities, the subsequent objective is to leverage the heterogeneity of these sources to effectively learn fine-tuned feature representations. The essential purpose of the Knowledge Fusion (KF) module is to smooth the harmonious integration of various visual representations acquired from different sources of CT scans during the learning or encoding-decoding process [ 32 ]. As shown in Fig 2 , these encoded representations usually include features from different domains of CT imaging and different spatial scales. The KF module plays a pivotal role in reducing the overall heterogeneity present in the multi-site data, allowing for a more coherent and comprehensive analysis. Through an interactive process, the KF is designed to allow seamless fusion of these representations, enhancing the overall robustness and informativeness of the integrated data. This fusion process aims to improve the model's ability to capture and leverage the varied characteristics and nuances within the data, ultimately contributing to more accurate and reliable disease diagnosis in smart cities [ 33 , 34 ].
As depicted in Fig. 2 , collaborative training is employed for the global network, combining supervision from GT masks and additional heterogeneous knowledge from ancillary paths. Specifically, each domain-specific ancillary channel is constructed in a manner identical to the global decoding path, resulting in a total of S domain-related ancillary channels within the global network. The ancillary paths serve as independent feature extractors for each supported data source in smart cities, allowing for a more inclusive fusion of relevant knowledge representations compared to the global decoding path. Each ancillary path is trained to optimize the dice loss [ 35 ]. Concurrently, the acquired heterogeneous knowledge representations from the ancillary paths are shared with the global network through an effective knowledge interaction mechanism. This enables the collective transmission of knowledge from all ancillary paths into a global decoding path, stimulating the common kernels in the global network to learn additional generic semantic representations. Accordingly, the final cost function for multi-decoder segmentation network training with data from source \(s\) includes dice loss \({L}_{global}^{s}\) and a knowledge interaction loss \({L}_{KI}^{s}\) .
Unlike present knowledge distillation approaches [ 36 ], our knowledge interaction loss associates the global probability maps (in the global network) with the GT masks from the ancillary path by transforming the GT masks into a one-hot design, preserving the dimensions reliability of the possibility maps. Thus, we denote the estimated one-hot label of an ancillary path as \({P}_{\text{anc}}^{s}\in {\mathbb{R}}^{b\times h\times w\times c}\) . The activation values following the \(softmax\) operation of global architecture are denoted as \({M}_{\text{global}}^{s}\in {\mathbb{R}}^{b\times h\times w\times c}\) , with \(b\) representing batch size, \(h,\) and \(w\) representing the height and width of feature maps, respectively, and \(c\) representing the channel number. The knowledge interaction cost can be calculated by
where \({m}_{i}^{s}\in {M}_{global}^{s} and {p}_{i}^{s}\in {P}_{\text{anc}}^{s}\) , and \(\varphi\) represents the number of pixels in a single batch. The concept of KF stems from the proven advantages of large posterior entropy [ 32 ]. In our model, each ancillary path aims to effectively capture semantic knowledge from the underlying dataset by learning diverse representations and generating a wide range of predictions, thus providing a comprehensive set of heterogeneous information for the proposed multi-decoder segmentation network in smart cities. In supervised training, a multi-decoder segmentation network achieves rapid convergence when the capacity is very large. However, in KF , the global path needs to emulate both the GT mask and the predictions of multiple ancillary paths simultaneously. The proposed KF introduces additional heterogeneous (multi-domain) representation to standardize the multi-decoder segmentation network and increase its posterior entropy [ 32 ], enabling joint convolutions to leverage more powerful representations from different data sources. Moreover, the multi-path structure in KF may also contribute to beneficial feature regularization for the global encoding path by joint training with the ancillary paths, thereby enhancing the segmentation performance of the multi-decoder segmentation network.
The interaction modules play a crucial role in the proposed multi-decoder segmentation network, consisting of multiple interaction blocks that take the acquired knowledge representation from the ancillary paths and transfer it to the global path to enhance the overall segmentation performance. These modules need to be lightweight to avoid increasing the model's complexity. Additionally, the approach should improve gradient flow to accelerate training convergence while leveraging channel-wise relationships. To achieve this, we adopt the recently proposed squeeze and excitation (SE) technique [ 37 ], which recalibrates feature maps through channel-wise squeezing and spatial excitation (referred to as sSE), effectively highlighting relevant spatial positions.
Specifically, cSE squeezes the feature maps of the \(U_{anc}\in\mathbb{R}^{W\times H\times} C^{'}\) ancillary paths along the channel dimension and perform spatial excitation on the corresponding feature map of the global network \({U}_{global}\in {\mathbb{R}}^{W\times H\times C}\) , thereby transmitting the heterogeneous knowledge representation learned for fine-tuning the generalization capability of the model. \(H\text{ and }W\) represent the dimensions of feature maps, and \(C^{'}\text{ and }C\) represent the channel count corresponding to the feature maps in the ancillary path and global path, respectively. Herein, we deliberate a certain dividing policy to characterize the input tensor \({U}_{anc}=\left[{u}_{anc}^{\text{1,1}},{u}_{anc}^{\text{1,2}},\cdots \cdots ,{u}_{anc}^{i,j},\cdots \cdots ,{u}_{anc}^{H, W}\right]\) , where \({U}_{anc}^{i,j}\in {\mathbb{R}}^{W\times H\times C^{'}}\) with \(j\in \left\{\text{1,2},\cdots \cdots ,H\right\}\) and \(i\in \left\{\text{1,2},\cdots \cdots ,W\right\}\) . In the same way, the global path feature map \({U}_{global}=[{u}_{global}^{\text{1,1}},{u}_{global}^{\text{1,2}},\cdots \cdots ,{u}_{global}^{i,j},\cdots \cdots ,{u}_{global}^{H, W}\) ]. A convolution layer ( \(1\times 1\) ) is employed to execute spatial squeezing \(\text{q }= {\text{W}}_{s}* {U}_{anc}\) , where \({\text{W}}_s\in\mathbb{R}^{1\times1\times} C^{'}\) , and producing projection map \(\text{q}\in {\mathbb{R}}^{H\times W}\) . This generated \(q\) is fed into sigmoid function \(\sigma \left(\cdot \right)\) to be rescaled into the range of [0,1], and the output is exploited for exciting \({U}_{global}\) spatially to generate \({\widehat{U}}_{global}=[\sigma ({q}_{\text{1,1}}){u}_{global}^{\text{1,1}},\cdots \cdots ,\sigma ({q}_{i,j}){u}_{global}^{i,j},\cdots \cdots ,{\sigma \left({q}_{H,W}\right)u}_{global}^{H, W}\) ].
Multi-decoder segmentation network Specifications and training
The proposed multi-decoder segmentation network is trained to optimize the objective function for upgrading the global encoder ( \({\uptheta }_{\text{e}}\) ), global decoder ( \({\uptheta }_{\text{d}}\) ), and ancillary paths ( \({\left\{{\theta }_{anc}\right\}}_{1}^{S}\) ). The objective function could be formulated according to
where \({\text{L}}_{\text{anc}}^{\text{s}}\) and \({L}_{\text{global}}^{s}\) represent the dice loss for the ancillary paths and the global path, respectively; \({L}_{KI}^{s}\) represents the knowledge interaction for the global network; \(\sigma\) denotes a hyperparameter for balancing the segmentation loss and the knowledge interaction loss, and is set to 0.6, and \(\eta\) denotes the weight parameter and is set to 0.0001.
Throughout the entire training process, knowledge interaction takes place. At each training step, S batches of CT scans, each belonging to a different dataset, are fed into the multi-decoder segmentation network. The ancillary paths and the global path are trained alternately. Once training is completed, the ancillary paths are removed, and only the global path remains for inference. The proposed multi-decoder segmentation network is implemented on NVIDIA Quadro GPUs, with one GPU assigned to each data source, using the TensorFlow library. The encoder is built with four ResNeXt blocks. We employ the Adam optimizer to update the parameters of the multi-decoder segmentation network. During training, a batch size of 5 is used, and the number of iterations is set to 25000.
System design
The suggested system in this work is a fog-empowered cloud computing framework for COVID-19 diagnosis in smart cities, known as PANDFOG. It utilizes the proposed multi-decoder segmentation network to segment infection regions from CT scans of patients, aiding doctors in diagnosis, disease monitoring, and severity assessment. PANDFOG integrates various hardware devices and software components to enable organized and unified incorporation of edge-fog-cloud, facilitating the rapid and precise transfer of segmentation outcomes. Figure. 3 provides a simple illustration of the PANDFOG architecture and its modules are discussed in the following subsections.

Systematic representation of the proposed PANDFOG framework
Gateway Devices: Smartphones, tablets, and laptops serve as gateways within the PANDFOG framework. These devices function as fog devices, aggregating CT scans from various sources and transmitting them to the broker or worker nodes for further processing. The broker node serves as the central reception point for segmentation requests, specifically CT images, originating from gateway devices. It comprises the request input component for handling incoming requests, the security administration component for ensuring secure communication and data integrity, and the adjudication component (resource director) for real-time workload analysis and allocation of segmentation requests [ 45 , 46 , 47 , 48 , 49 ].
The worker node is responsible for executing segmentation tasks assigned by the resource director. It includes embedded devices and simple computers such as laptops, PCs, or Raspberry Pis. Worker nodes in PANDFOG encompass the proposed multi-decoder segmentation network architectures for processing CT images from heterogeneous sources and generating segmentation results. Additional components for data preparation, processing, and storage are also integral parts of the worker node [ 51 ].
The software components of PANDFOG enable efficient and intelligent data processing and analysis, leveraging distributed computing resources at the network edge. These components collectively contribute to tacking the problems facing the screening of COVID-19 and thereby improving healthcare responses. The first computation in PANDFOG involves preprocessing CT scans before they are forwarded to the multi-decoder segmentation network for training or inference. Data preprocessing details are provided in the experimental part of the study. This module trains the proposed Multi-decoder segmentation network on heterogeneous CT images after the preparation phase. It utilizes the Multi-decoder segmentation network to infer segmentation outcomes for CT images received from gateway devices based on the resource director's assignment. The resource directory comprises the workload administrator and the adjudication component. The workload administrator manages segmentation requests and handles the request queue and a batch of CT images. The adjudication component regularly analyzes available cloud or fog resources to determine the most suitable nodes for processing CT scans and generating segmentation outcomes. This aids in load balancing and optimal performance [ 52 , 53 , 54 , 55 , 56 , 57 ].
The PANDFOG framework takes the patient's CT image as input from gateway devices and employs the data preparation module and Multi-decoder segmentation network to generate segmentation results indicating the infection regions. The Multi-decoder segmentation network is trained on multi-source annotated datasets and saved on all nodes. During the diagnosis phase, a node assigned with a segmentation request feeds the patient's CT image to the Multi-decoder segmentation network for forward pass inference. The input image is broadcast to other nodes if needed.
Experimental deign and analysis
Within this section, we provide a comprehensive comparison between the outcomes achieved by our model and those reported in previous studies. Furthermore, we undertake two distinct evaluations to assess the performance and efficacy of our proposed multi-decoder segmentation network. The initial evaluation takes place within a conventional computing environment, allowing us to gauge the model's overall performance and effectiveness. Subsequently, we delve into a detailed analysis of the experimental configurations of the multi-decoder segmentation network within an AIoT framework, considering various factors such as latency, jittering, completion time, and more. This multifaceted evaluation provides a comprehensive understanding of the multi-decoder segmentation network's capabilities and performance within the context of AIoT, offering insights into its potential for practical applications [ 56 , 57 ].
Performance indicator
In our case study, we employed two commonly used evaluation indicators to assess the performance of the multi-decoder segmentation network framework for COVID-19 lesion segmentation: the Dice Similarity Coefficient (DSC) and the Normalized Surface Dice (NSD).
Results and discussion
In our experiments, we explore and evaluate the proposed network under two training scenarios: one is an individualistic scenario and the other is a combined scenario. The former scenario emphasizes training the network separately on each dataset and then reporting its inference performance. In a later scenario, we involve the direct integration of arbitrarily selected images from different sources. This random selection of samples is performed to guarantee that the total number of training samples and test samples are equals in both scenarios. This in turn helps keep the fairness of the conducted comparisons. For both scenarios, the segmentation performance is assessed on test data from distinct sites, which helps gain useful insights about the generalizability of the model on unseen data. This means interpreting the impact of distributional shifts on the segmentation performance when dealing with multi-site CT data. Throughout these bunch of experiments, the multi-decoder segmentation network utilized a global decoding path, which is typical for U-shaped segmentation networks. The quantitative results of these experiments are reported in Table 1 , across different valuation metrics namely DSC and NSD.
In the individualistic scenario, we observed a significant degradation in generalization performance when the model was evaluated on test sets from other sites compared to the performance on the corresponding training data. For example, in the first row (corresponding site1-based training) the DSC is dropped from 78.24 to 67.66 when it comes to evaluation on site 2. Similarly, the NSD score dropped from 77.23 to 65.4 when it came to site 2. The behavior is notable for all individualistic scenarios, which confirms our claims about the impact of the distributional shift caused by muti-site medical data. To this end, we emphasize the importance of incorporating heterogeneous data during the training phase, which can be achieved through the combined learning approach offered by the multi-decoder segmentation network. In the combined training scenarios, we observed that the segmentation performance exhibited notable improvements compared to the individualistic scenario with unseen testing data. However, this remains below segmentation performance in the case of training and testing data. This suggests that leveraging data from multiple sites can enhance the model's ability to generalize across different data sources and improve overall segmentation performance.
To further evaluate the performance of the multi-decoder segmentation network, we conducted comparative experiments against state-of-the-art segmentation models that have demonstrated excellence in various medical imaging segmentation tasks. These models were carefully selected to provide a comprehensive evaluation and enable a meaningful comparison of our proposed approach. Table 2 presents the results of our comparative evaluation, where each model was trained and tested on the same dataset under consistent experimental conditions. These experiments aimed to assess and compare the performance of our proposed model against other existing models, providing valuable insights into the potential of our approach to advance the field of COVID-19 segmentation from multi-site data.
Through these comparative experiments, we can demonstrate the efficacy and superiority of our proposed model. Our model consistently outperformed the other models in terms of various evaluation measures, showcasing its ability to achieve more accurate and reliable segmentation results. These findings highlight the effectiveness of our proposed multi-decoder segmentation network in handling the challenges posed by multi-site data in the context of COVID-19 segmentation. To further quantify the significance of the observed performance improvements, we conducted paired t-tests between the proposed multi-decoder segmentation network and the mixed and independent models using the evaluation measures. The statistical significance level was set at a p-value of 0.05. For each pair of comparisons, we calculated both the single source p-value and the total p-value. Table 3 displays the results of these statistical tests conducted on different datasets from various sites. Notably, all the computed p-values were found to be less than 0.05, indicating that the observed performance enhancements achieved by our proposed multi-decoder segmentation network are statistically significant. This signifies that the improvements observed in the segmentation results are not due to random chance, but rather reflect the true effectiveness and superiority of our model. These statistical tests provide further confidence in the reliability and robustness of our proposed multi-decoder segmentation network, reinforcing its potential for practical application in real-world scenarios. The statistically significant performance improvements observed across different datasets and sites validate the credibility and generalizability of our approach, making it a promising solution for accurate COVID-19 segmentation in the context of multi-site data.
Ablation analysis
To gain insights into the impact of different feature recalibration blocks in the knowledge fusion from decoding paths in our model, we conducted an ablation analysis. We implemented and evaluated the KF module of our model with three variations of feature recalibration blocks: recombination and recalibration (RR), spatial SE (sSE), and a combination of channel-wise SE (cSE) and spatial SE (sSE). The results of these experiments are summarized in Table 4 . The analysis reveals that the utilization of cSE blocks proves to be more effective than sSE blocks, emphasizing the importance of channel-wise information in the segmentation process. The cSE blocks enable the model to recalibrate the channel-wise features, enhancing their discriminative power and ultimately improving the segmentation performance. On the other hand, the RR blocks achieve comparable performance to the sSE blocks, suggesting that the recombination and recalibration mechanism successfully incorporates spatial information into the model. Furthermore, integrating both cSE and sSE blocks yields the highest performance across all evaluated datasets. This combination of feature recalibration mechanisms allows the Multi-decoder segmentation network to leverage both channel-wise and spatial information, leading to more accurate and robust segmentation results. However, it is worth noting that this integration comes at the cost of increased computational complexity, making it more computationally exhaustive compared to using individual recalibration blocks.
Considering the resource efficiency aspect, cSE blocks are shown to slightly increase the network parameters. However, the overall impact on computational resources remains relatively modest. This highlights the practicality and resource efficiency of integrating cSE blocks into the Multi-decoder segmentation network architecture, as they provide significant performance gains while maintaining manageable computational requirements. The ablation analysis on the feature recalibration blocks reaffirms the effectiveness and importance of channel-wise information in the context of the Multi-decoder segmentation network. It demonstrates that the integration of CSE blocks, in combination with other recalibration mechanisms, leads to superior segmentation performance. This analysis aids in the understanding of the design choices in our proposed model and supports the selection of CSE blocks as a key component in enabling effective interaction between decoding paths for enhanced COVID-19 segmentation.
Scalability analysis
In this part of our experimental analysis, we conducted several experiments to investigate the relationship between the number of edges and the training accuracies.
The results are presented in Fig. 4 A, which illustrates how the training DSC varies with an increasing number of edge nodes. The findings reveal that as the number of edge nodes increases, the training DSC also increases. This can be attributed to the fact that when the number of nodes increases, the allocation of CT scans to each node decreases. Consequently, this reduction in the number of training samples per node leads to overfitting during training, resulting in higher training DSC scores. On the other hand, the impact of the number of nodes on the testing accuracy is depicted in Fig. 4 B. The graph shows that a higher number of edges leads to a decrease in the testing DSC. This can be explained by the fact that with a larger number of edges, each edge node receives only a small portion of the training samples. As a result, the model trained on these limited samples may struggle to generalize well to unseen data, resulting in a decrease in testing accuracy. These observations highlight the importance of finding the right balance when determining the number of edges in the system. While a higher number of edges may lead to better training performance initially, it can also result in decreased testing accuracy due to limited training samples per edge node. Therefore, it is crucial to carefully consider the trade-off between training and testing performance when designing the system and selecting the appropriate number of edges.

Impact of number of edges model accuracy
Time analysis
In consideration of real-world applications, we acknowledge the supreme standing of proficiency when it comes to being deployed in PANDFOG, for automatic COVID-19 pneumonia diagnosis. To this end, the feasibility and complexity of PANDFOG are assessed in clinical settings by conducting a set of time experiments to give useful insights about different time complexities.
In of adjudication time analysis, we conducted four experiments to evaluate the impact of adjudication time at the broker node for different fog paradigms. These paradigms included a cloud, a broker, a worker node, and dual worker nodes, as illustrated in Fig. 5 . Our results showed that when the task was transferred to the master or cloud, the adjudication time was relatively small, approximately 144.7 ms and 154.2 ms, respectively. This indicates that the processing time was efficient when the task was handled by these centralized nodes. However, as the number of edge nodes increased, the broker became responsible for examining the workloads of each worker and selecting the worker with the lowest load to allocate the task. Consequently, the adjudication time increased due to the growing number of edge nodes that needed to be assessed by the broker. Furthermore, when the domain-specific data was directed to workers for heterogeneous learning, the broker no longer needed to execute load checks. This is because the selection of the mainstream class could be performed by any worker, eliminating the need for the broker's involvement in load distribution. These findings highlight the dynamic nature of the system and the influence of different fog paradigms on adjudication time. The increase in edge nodes introduces additional complexity and processing overhead, resulting in longer adjudication times. However, by allowing workers to handle domain-specific data for heterogeneous learning, the system becomes more efficient as the workload distribution is effectively delegated without requiring the broker's intervention in load checks.

Adjudication time visualization in PANDFOG across various fog designs
In addition, we underline the significance of interpreting and evaluating the real-world applicability of PANDFOG for deploying the multi-decoder segmentation network on edge nodes. To this end, an extensive latency analysis is conducted to gain valuable feedback regarding the practical performance. Figure 6 illustrates the latency discrepancies, which include communication and queuing delays. It is observed that transmitting tasks to one edge or the broker node exhibits similar latency, approximately 19.4 ms and 20.7 ms, respectively, reflecting the total communication across one-hop data transmissions. In the multi-edge scenario, the latency slightly increases, reaching 28.6 ms for two edges and 38.4 ms for three edges. On the other hand, in the cloud scenario, a significantly higher latency of 3121 ms is observed due to the multi-hop transmissions of domain-relevant data out of the local area network (LAN). The achieved numerical results show the trade-offs and implications for data processing in smart cities, in which edge computing reduces latency for serious tasks, while multi-edge settings keep a balance between local processing and resource distribution. This, in turn, highlights the basics of optimizing network architecture to minimize latency and guarantee sensible decision support for managing pandemic disease within smart cities.

Comparative visualization of PANDFOG performance across different fog designs
Moreover, the applicability of PANDFOG is further explored in real-world COVID-19 pneumonia analysis through the introduction of jitter analysis. This means studying the difference in response time of successive task requests, which is a significant parameter for real-time IoT services in smart cities. Figure. 7 depicts the jitter discrepancies along with different fog settings. The scenario involving only the broker node exhibits a higher jitter (14.1 ms) compared to the scenario where requests are directed to the worker nodes. This can be attributed to the additional adjudication induced by other tasks, while the broker is responsible for resource administration and security maintenance. Additionally, a marginal increase in jitter is observed for the three-edge scenario (13.1 ms) compared to the one-edge scenario (8.3 ms). Moreover, a larger jitter is observed when data is sent to a centralized cloud (114.6 ms).

Jitter analysis of PANDFOG across varied fog designs
Furthermore, Execution time analysis is broadly recognized as an essential metric for measuring the computing efficiency and responsiveness of a system when it comes to deployment into dynamic and constrained IoT systems, such as smart cities' healthcare infrastructure. The execution time analysis, as shown in Fig. 8 , further highlights the differences in execution time across different scenarios. As expected, the cloud configuration demonstrates the lowest execution time (1092.7 ms) due to its high availability of computational resources. It is worth noting that the execution times of the worker nodes are considerably higher than those of the broker nodes.

Comparative analysis of execution time in PANDFOG across various fog designs
Bandwidth analysis
When it comes to analyzing distributed systems, such as smart city healthcare systems, bandwidth analysis comes as a critical metric for evaluating the viability and scalability of the system. To this end, network bandwidth analysis is performed for the proposed PANDFOG, a s displayed in Fig. 9 , shows the relation between the network bandwidth consumption and the underlying fog configurations. The configuration involving only the broker node results in the lowest bandwidth consumption (11.2 kbps), while the cloud configuration exhibits comparatively higher consumption (39.6 kbps). Increasing the number of edge nodes leads to an increase in bandwidth consumption, primarily due to additional security checks, heartbeat packets, and data transmissions.

Bandwidth consumption analysis of PANDFOG with various fog design configurations
Power analysis
To further get valuable insights into the real-world applicability of PANDFOG, the proposed
Analyzing power and energy consumption, as depicted in Fig. 10 , is a crucial aspect of IoT frameworks. The energy utilization analysis of the proposed COVID-19 fog framework indicates that the broker configuration has the lowest power utilization at 7.3 W. Additionally, it is observed that increasing the number of edge nodes only slightly increases power consumption. In contrast, the cloud configuration shows a significant increase in power consumption due to the abundance of computational resources it requires. These results demonstrate significant implications for the design and deployment of AIoT platforms in smart cities by emphasizing localized, edge-based data processing that not only reduces latency but also copes with energy competence and sustainability goals. The comparatively low power utilization in the case of broker configuration, fused with the medium spread at edge scaling, showcases the capacity for resource optimization in multi-edge deployments.

Power consumption analysis of PANDFOG under varied fog design configurations
The above experimental analyses provide valuable insights into the performance, efficiency, and resource utilization of the proposed COVID-19 fog framework. The results highlight the trade-offs and characteristics of different configurations, helping to inform decision-making and optimization efforts in designing and deploying fog-based IoT systems for pandemic control in smart cities. Our research focuses primarily on the implication our work holds towards achieving the goal outlined under the Vision 2030 agenda particularly concerning developing futuristic smart cities. Our primary objective lies in developing a fog-based AIoT system for determining the best way in which, we could perform diagnosis for COVID-19-alike pandemics at the highest level of accuracy using novel approaches towards integrating multi-site data sourced from various multimedia scanners. This system allows smart cities to create an efficient system for tracking and monitoring pandemics, promoting public health safety and appropriate resource allocation. When implemented in existing healthcare facilities, our framework builds on existing medical wearables, electronic health records, and other related tools designed to holistically diagnose individuals while embracing personalized care aimed at promoting preventive measures. To summarize, our development of the cloud-based AIoT system will greatly aid in achieving the goals of Vision 2030 for intelligent cities. By providing precise detection and nurturing an interconnected healthcare infrastructure, our framework provides communities with the means to efficiently react to outbreaks and improve public safety, leading to greater quality of life for their inhabitants. Our accomplishment in implementing our setup creates opportunities for even larger changes within medicine and greases the wheels toward long-term, sustainable smart cities down the line.
Conclusions and future works
This paper presents a comprehensive framework, named fog-based AIoT, for accurate pandemic disease diagnosis in smart cities. By leveraging multi-site data fusion, our framework addresses the challenges posed by heterogeneous data sources and enables precise and timely diagnosis of pandemic diseases, particularly focusing on COVID-19. The proposed AIoT framework incorporates fog-empowered cloud computing and integrates various hardware devices and software components to facilitate efficient data processing and analysis. The Multi-decoder segmentation network, our novel deep learning model, serves as the cornerstone of the framework, effectively handling the segmentation of COVID-19 lesions from CT scans obtained from diverse sources. The findings showed that our AIoT framework outperforms traditional centralized cloud systems in terms of precision, speed, and adaptability to heterogeneous data sources.
The successful functioning of our fog-based AIoT framework opens up new avenues for future research and applications in the field of disease diagnosis and monitoring in smart cities. Further progress can be made in optimizing resource allocation, refining the segmentation algorithms, and extending the framework to support other types of pandemic diseases. By constantly refining and expanding our AIoT framework, we can make significant strides towards creating smarter and more resilient cities that are better provided to tackle healthcare challenges during pandemics.
Availability of data and materials
The datasets generated during and/or analyzed during the current study are three publicly accessible datasets that are openly available in [40-42].
Elhosseini, M. A., Gharaibeh, N. K., & Abu-Ain, W. A. (2023). Trends in Smart Healthcare Systems for Smart Cities Applications. In 2023 1st International Conference on Advanced Innovations in Smart Cities (ICAISC) (pp. 1–6). IEEE.
Singh PD, Kaur R, Dhiman G, Bojja GR. BOSS: a new QoS aware blockchain assisted framework for secure and smart healthcare as a service. Expert Syst. 2023;40(4):e12838.
Article Google Scholar
Rejeb, A., Rejeb, K., Treiblmaier, H., Appolloni, A., Alghamdi, S., Alhasawi, Y., & Iranmanesh, M. (2023). The Internet of Things (IoT) in healthcare: Taking stock and moving forward. Internet of Things, 100721.
Dang VA, Vu Khanh Q, Nguyen VH, Nguyen T, Nguyen DC. Intelligent Healthcare: Integration of Emerging Technologies and Internet of Things for Humanity. Sensors. 2023;23(9):4200.
Article PubMed PubMed Central Google Scholar
Bourechak A, Zedadra O, Kouahla MN, Guerrieri A, Seridi H, Fortino G. At the Confluence of Artificial Intelligence and Edge Computing in IoT-Based Applications: A Review and New Perspectives. Sensors. 2023;23(3):1639.
Tripathy SS, Rath M, Tripathy N, Roy DS, Francis JSA, Bebortta S. An Intelligent Health Care System in Fog Platform with Optimized Performance. Sustainability. 2023;15(3):1862.
Kumar M, Kumar A, Verma S, Bhattacharya P, Ghimire D, Kim SH, Hosen AS. Healthcare Internet of Things (H-IoT): Current Trends, Future Prospects, Applications, Challenges, and Security Issues. Electronics. 2023;12(9):2050.
Rahman MA, Mahmud MT, Rahman MO. IEF2C: A novel AI-powered framework for suspected COVID-19 patient detection and contact tracing in smart cities. 2020.
Google Scholar
Li E, Zeng L, Zhou Z, Chen X. Edge AI: On-demand accelerating deep neural network inference via edge computing. IEEE Trans Wireless Commun. 2019;19:447–57.
Bahbouh NM, Compte SS, Valdes JV, Sen AAA. An empirical investigation into the altering health perspectives in the internet of health things. Int J Inf Technol. 2023;15(1):67–77.
PubMed Google Scholar
Kanellopoulos D, Sharma VK, Panagiotakopoulos T, Kameas A. Networking Architectures and Protocols for IoT Applications in Smart Cities: Recent Developments and Perspectives. Electronics. 2023;12(11):2490.
Alenizi J, Alrashdi I (2023) SFMR-SH: Secure Framework for Mitigating Ransomware Attacks in Smart Healthcare Using Blockchain Technology. Sustain Machine Intell J. 2. https://doi.org/10.61185/SMIJ.2023.22104 .
Sallam, K., Mohamed, M. and Wagdy Mohamed , A. (2023) “Internet of Things (IoT) in Supply Chain Management: Challenges, Opportunities, and Best Practices”, Sustainable Machine Intelligence Journal , 2. https://doi.org/10.61185/SMIJ.2023.22103 .
Allam X, Z., & Jones, D. S. On the coronavirus (COVID-19) outbreak and the smart city network: universal data sharing standards coupled with artificial intelligence (AI) to benefit urban health monitoring and management. In Healthcare. 2020;8(1):46 MDPI.
Costa DG, Peixoto JPJ. COVID-19 pandemic: a review of smart cities initiatives to face new outbreaks. IET Smart Cities. 2020;2(2):64–73.
Shorfuzzaman M, Hossain MS, Alhamid MF. Towards the sustainable development of smart cities through mass video surveillance: A response to the COVID-19 pandemic. Sustain Cities Soc. 2021;64: 102582.
Article PubMed Google Scholar
Ngabo D, Dong W, Ibeke E, Iwendi C, Masabo E. Tackling pandemics in smart cities using machine learning architecture. Math Biosci Eng. 2021;18(6):8444–61.
Carmichael H, Coquet J, Sun R, Sang S, Groat D, Asch SM, Hernandez-Boussard T. J Biomed Inform. 2021;119:103802.
Wismüller A, DSouza, A. M., Abidin, A. Z., Ali Vosoughi, M., Gange, C., Cortopassi, I. O., … & Bader, A. S. Early-stage COVID-19 pandemic observations on pulmonary embolism using nationwide multi-institutional data harvesting. NPJ Digital Medicine. 2022;5(1):120.
Hooper JE, Padera RF Jr, Dolhnikoff M, da Silva LFF, Duarte-Neto AN, Kapp ME, Williamson AK. Arch Pathol Lab Med. 2021;145(5):529–35.
Article CAS PubMed Google Scholar
Kaissis G, Ziller A, Passerat-Palmbach J, Ryffel T, Usynin D, Trask A, Braren R. Nat Mach Intell. 2021;3(6):473–84.
Herath HMKKMB, Karunasena GMKB, Herath HMWT. Development of an IoT based systems to mitigate the impact of COVID-19 pandemic in smart cities. In: Machine intelligence and data analytics for sustainable future smart cities. Cham: Springer International Publishing; 2021. p. 287–309.
Chapter Google Scholar
Gade DS, Aithal PS. Smart cities development during and post COVID-19 pandemic–a predictive analysis. Int J Manage Technol Soc Sci. 2021;6(1):189–202.
Yang S, Chong Z. Smart city projects against COVID-19: Quantitative evidence from China. Sustain Cities Soc. 2021;70: 102897.
Umair M, Cheema MA, Cheema O, Li H, Lu H. Impact of COVID-19 on IoT adoption in healthcare, smart homes, smart buildings, smart cities, transportation and industrial IoT. Sensors. 2021;21(11):3838.
Article CAS PubMed PubMed Central Google Scholar
Ma Z, Ma G, Miao Y, Liu X, Choo KKR, Yang R. Lightweight Privacy-preserving Medical Diagnosis in Edge Computing. IEEE Trans Serv Comput. 2020;15(3):1606–18.
Ndiaye M, Oyewobi SS, Abu-Mahfouz AM, Hancke GP, Kurien AM, Djouani K. IoT in the wake of COVID-19: A survey on contributions, challenges and evolution. Ieee Access. 2020;8:186821–39.
Ronneberger O, Fischer P, Brox T. U-Net: Convolutional networks for biomedical image segmentation in MICCAI . Germany: Springer; 2015. p. 234–41.
Xie S, Girshick R, Dollár P, Tu Z, He K. Aggregated residual transformations for deep neural networks. InProceedings of the IEEE conference on computer vision and pattern recognition. 2017. p. 1492–500.
Ioffe S, Szegedy C. Batch normalization: Accelerating deep network training by reducing internal covariate shift. https://arxiv.org/abs/1502.03167 . 2015.
Chaudhar P, Choromanska A, Soatto S, LeCun Y, Baldassi C, Borgs C, et al. Entropy-sgd: Biasing gradient descent into wide valleys.” in International Conference on Learning Representations. 2017.
Rundo L, Han C, Zhang J, Hataya R et al., “Cnn-based prostate zonal segmentation on t2-weighted mr images: A cross-dataset study,” in https://arxiv.org/abs/1903.12571 . 2019.
Hou S, Pan X, Loy CC, Wang Z, Lin D. “Lifelong learning via progressive distillation and retrospection,” Comput. Vision-ECCV. 2018.
Milletari F, Navab N, Ahmadi SA. “V-net: Fully convolutional neural networks for volumetric medical image segmentation,” in https://arxiv.org/abs/1606.04797 . 2016.
Gao Z, Chung J, Abdelrazek M, Leung S, Hau WK, Xian Z, et al. Privileged modality distillation for vessel border detection in intracoronary imaging. IEEE Trans Med Imaging. 2019;39:1524–34.
Roy AG, Navab N, Wachinger C. Recalibrating fully convolutional networks with spatial and channel “squeeze and excitation” blocks. IEEE Trans Med Imaging. 2018;38:540–9.
Tuli S, Mahmud R, Tuli S, Buyya R. Fogbus: A blockchain-based lightweight framework for edge and fog computing. J Syst Softw. 2019;154:22–36.
Ma J, Wang Y, An X, Ge X, Yu Z, Chen J, et al. "Towards Efficient COVID-19 CT Annotation: A Benchmark for Lung and Infection Segmentation," arXiv preprint arXiv:2004.12537. 2020.
Morozov S, Andreychenko A, Pavlov N, Vladzymyrskyy A, Ledikhova N, Gombolevskiy V, et al. "MosMedData: Chest CT Scans With COVID-19 Related Findings Dataset," arXiv preprint arXiv:2005.06465 . 2020.
MedSeg. Dataset: https://medicalsegmentation.com/covid19/
S. Nikolov, S. Blackwell, R. Mendes, J. De Fauw, C. Meyer, C. Hughes , et al. , "Deep learning to achieve clinically applicable segmentation of head and neck anatomy for radiotherapy," arXiv preprint arXiv:1809.04430 , 2018.
Zhang L, Wang X, Yang D, Sanford T, Harmon S, Turkbey B, et al. Generalizing deep learning for medical image segmentation to unseen domains via deep stacked transformation," IEEE Transactions on Medical Imaging . 2020.
Long J, Shelhamer E, Darrell T. Fully convolutional networks for semantic segmentation. In: in CVPR. 2015. p. 3431–40.
Çiçek Ö, Abdulkadir A, Lienkamp SS, Brox T, Ronneberger O, "3D U-Net: Learning Dense Volumetric Segmentation from Sparse Annotation," arXiv e-prints, p. arXiv:1606.06650 . Available: https://ui.adsabs.harvard.edu/abs/2016arXiv160606650C
Li X, Chen H, Qi X, Dou Q, Fu C-W, Heng P-A. HDenseUNet: hybrid densely connected UNet for liver and tumor segmentation from CT volumes. IEEE Trans Med Imaging. 2018;37(12):2663–74.
Mohamed, M. (2023) “Empowering deep learning based organizational decision making: A Survey”, Sustain Machine Intell J. 3. https://doi.org/10.61185/SMIJ.2023.33105 .
Miao Y, Tong Q, Choo K-KR, Liu X, Deng RH, Li H. Secure online/offline data sharing framework for cloud-assisted industrial internet of things. IEEE Inter Things J. 2019;6(5):8681–91.
Miao Y, Weng J, Liu X, Choo K-KR, Liu Z, Li H. Enabling verifiable multiple keywords search over encrypted cloud data. Inf Sci. 2018;465:21–37.
Ouyang T, Li R, Chen X, Zhou Z, Tang X. Adaptive user-managed service placement for mobile edge computing: An online learning approach. In: in Proc. IEEE Conference on Computer Communications (INFOCOM’19). 2019. p. 1468–76 IEEE.
Dai P, Lui K, Xing H, Yu Z, Lee VC. A learning algorithm for real-time service in vehicular networks with mobileedge computing. In: in Proc. IEEE International Conference on Communications (ICC’19). 2019. p. 1–6 IEEE.
Wang F, C Zhang, Lui J, Zhu Y, Pang H, Sun L, et al. Intelligent edge assisted crowdcast with deep reinforcement learning for personalized qoe. In: in Proc. IEEE Conference on Computer Communications (INFOCOM’19). 2019. p. 910–8 IEEE.
Lin CC, Deng DJ, Chih YL, Chiu HT. Smart manufacturing scheduling with edge computing using multi-class deep q network, IEEE Transactions on Industrial Informatics. 2019.
Naranjo PGV, Pooranian Z, Shojafar M, Conti M, Buyya R. FOCAN: A Fog-supported smart city network architecture for management of applications in the Internet of Everything environments. Journal of Parallel and Distributed Computing. 2019;132:274–83.
Baccarelli E, Naranjo PGV, Scarpiniti M, Shojafar M, Abawajy JH. Fog of everything: Energy-efficient networked computing architectures, research challenges, and a case study. IEEE access. 2017;5:9882–910.
Ghosh S, Mukherjee A, Ghosh SK, Buyya R. Mobi-IoST: mobility-aware cloud-fog-edge-iot collaborative framework for time-critical applications. IEEE Transact Net Sci Eng. 2019;7(4):2271–8.
Mahmud R, Koch FL, Buyya R. Cloud-fog interoperability in IoT-enabled healthcare solutions. In: in Proceedings of the 19th international conference on distributed computing and networking. 2018. p. 1–10.
Pereira S, Pinto A, Amorim J, Ribeiro A, Alves V, Silva CA. Adaptive feature recombination and recalibration for semantic segmentation with fully convolutional networks. IEEE Trans Med Imaging. 2019;38:2914–25.
Download references
Acknowledgements
This work was funded by the Deanship of Graduate Studies and Scientific Research at Jouf University under grant No. (DGSSR-2023-02-02058).
This work was funded by the Deanship of Graduate Studies and Scientific Research at Jouf University under grant No. (DGSSR-2023–02-02058).
Author information
Authors and affiliations.
Department of Computer Science, College of Computer and Information Sciences, Jouf University, 72388, Sakaka, Aljouf, Saudi Arabia
Ibrahim Alrashdi
You can also search for this author in PubMed Google Scholar
Contributions
I. A. Conceptualization, Methodology, Validation, Writing - review and editing, Investigation, Methodology, Resources, Visualization, Software, Writing - original draft, Writing - review and editing and funding.
Corresponding author
Correspondence to Ibrahim Alrashdi .
Ethics declarations
Ethics approval and consent to participate.
The results/data/figures in this manuscript have not been published elsewhere, nor are they under consideration by another publisher. All the material is owned by the authors, and/or no permissions are required.
Consent for publication
This article does not contain any studies with human participants or animals performed by any of the authors.
Conflict of interest
The authors declare no competing interests.
Additional information
Publisher’s note.
Springer Nature remains neutral with regard to jurisdictional claims in published maps and institutional affiliations.
Rights and permissions
Open Access This article is licensed under a Creative Commons Attribution 4.0 International License, which permits use, sharing, adaptation, distribution and reproduction in any medium or format, as long as you give appropriate credit to the original author(s) and the source, provide a link to the Creative Commons licence, and indicate if changes were made. The images or other third party material in this article are included in the article's Creative Commons licence, unless indicated otherwise in a credit line to the material. If material is not included in the article's Creative Commons licence and your intended use is not permitted by statutory regulation or exceeds the permitted use, you will need to obtain permission directly from the copyright holder. To view a copy of this licence, visit http://creativecommons.org/licenses/by/4.0/ . The Creative Commons Public Domain Dedication waiver ( http://creativecommons.org/publicdomain/zero/1.0/ ) applies to the data made available in this article, unless otherwise stated in a credit line to the data.
Reprints and permissions
About this article
Cite this article.
Alrashdi, I. Fog-based deep learning framework for real-time pandemic screening in smart cities from multi-site tomographies. BMC Med Imaging 24 , 123 (2024). https://doi.org/10.1186/s12880-024-01302-8
Download citation
Received : 14 March 2024
Accepted : 20 May 2024
Published : 27 May 2024
DOI : https://doi.org/10.1186/s12880-024-01302-8
Share this article
Anyone you share the following link with will be able to read this content:
Sorry, a shareable link is not currently available for this article.
Provided by the Springer Nature SharedIt content-sharing initiative
- Smart Cities
- Pandemic diseases
- Fog computing
- Deep learning
- Internet of Things (IoT)
BMC Medical Imaging
ISSN: 1471-2342
- General enquiries: [email protected]
Thank you for visiting nature.com. You are using a browser version with limited support for CSS. To obtain the best experience, we recommend you use a more up to date browser (or turn off compatibility mode in Internet Explorer). In the meantime, to ensure continued support, we are displaying the site without styles and JavaScript.
- View all journals
- My Account Login
- Explore content
- About the journal
- Publish with us
- Sign up for alerts
- Open access
- Published: 05 June 2024
In-situ tool wear condition monitoring during the end milling process based on dynamic mode and abnormal evaluation
- Min Chen 1 na1 ,
- Jianwei Mao 2 na1 ,
- Yu Fu 2 na1 ,
- Xin Liu 2 na1 ,
- Yuqing Zhou 3 &
- Weifang Sun 2
Scientific Reports volume 14 , Article number: 12888 ( 2024 ) Cite this article
Metrics details
- Electrical and electronic engineering
- Information theory and computation
- Mechanical engineering
Rapid tool wear conditions during the manufacturing process are crucial for the enhancement of product quality. As an extension of our recent works, in this research, a generic in-situ tool wear condition monitoring during the end milling process based on dynamic mode and abnormal evaluation is proposed. With the engagement of dynamic mode decomposition, the real-time response of the sensing physical quantity during the end milling process can be predicted. Besides, by constructing the graph structure of the time series and calculating the difference between the predicted signal and the real-time signal, the anomaly can be acquired. Meanwhile, the tool wear state during the end milling process can be successfully evaluated. The proposed method is validated in milling tool wear experiments and received positive results (the mean relative error is recorded as 0.0507). The research, therefore, paves a new way to realize the in-situ tool wear condition monitoring.
Introduction
Condition monitoring and fault diagnosis for computer numerical control (CNC) machines have been widely investigated in recent years and achieved great progress 1 , 2 . As a crucial component used to remove materials from the workpiece, the cutting tool’s running state will inevitably influence the surface quality of the final part, as well as the cutting process stability 3 , 4 . Therefore, rapid tool operating state estimation is important to maintaining the machining performance of the cutting system, preventing workpiece scrap and operator injury.
To realize rapid tool operating state estimation, considerable research efforts have been devoted. In such works, based on the physical location and measurement object of the sensor, those methods can be divided into direct methods and indirect methods 5 . As can be seen in Fig. 1 , direct methods can directly acquire the digital image of cutting edges and evaluate the tool wear state accordingly. For the indirect methods, dynamic signals during the manufacturing process can be sampled across the sensor mounted on the workpiece, spindles, or other components 6 , 7 . The tool wear state can be estimated indirectly based on the acquired signals.

Tool condition monitoring methods.
Benefiting from the implementation convenience, direct methods were successfully demonstrated in a number of studies, and the robustness of the methods is also testified. To realize the tool condition monitoring, considerable attention has been paid to evolution mechanism exploration and attempted to identify the service state based on their characteristic information. Among them, feature extraction based on sparse measure optimization has emerged as an interesting candidate for identifying the health state of mechanical systems. Based on the specific requirement, via the feature extraction methods, the mathematical model and the response characteristics can be investigated. After that, the optimal filter bank is obtained through iterative or non-iterative methods to achieve explicit representation of features. To address the problem that traditional tool wear prediction methods rely on the experience and knowledge of experts, Yang et al. 8 proposed a new tool wear prediction method based on local features and global dependencies. Focus on the weak fault detection of the rolling bearing in strong noise conditions, Deng et al. 9 propose a novel fault diagnosis method with an improved empirical wavelet transform (EWT) and the maximum correlated kurtosis deconvolution (MCKD). To address the low efficiency of iterative solutions during the MCKD process, Mcdonald et al. 10 proposed a non-iterative deconvolution method to directly acquire the optimal filter coefficient and successfully apply it in related scenarios. These researches provide the theoretical basis for system state identification. However, with the increasing complexity and systematization of mechanical equipment, the failure modes also become complex and variable, which leads to the instability of the proposed methods. In addition, traditional sparse measure optimization methods strongly rely on the prior knowledge of professional technicians and diagnostic experts in the diagnostic process (such as system structure, fault frequency, etc.) 11 , which restricts the applicability of these excellent methods in a wider range of engineering application scenarios.
With the rapid development of machine learning technology, artificial intelligence (AI) based fault diagnosis and prediction have increasingly become an important strategy for equipment safety and service monitoring 12 . Via related intelligent algorithms, the data-driven diagnostic method can adaptively identify equipment operation status information from existing data without the need of prior knowledge for professional technicians 13 . With an edge-labeling graph neural network method, Zhi et al. 14 propose a tool for wear condition monitoring using wear images which suitable for small sample conditions. Mishra et al. 15 developed a tool condition estimation method during the precision machining process with the unsupervised approach. However, data-driven methods are inevitably influenced by the distribution of training data, which may lead to data bias in the training model. Combining the sparrow search algorithm, Li et al. 16 developed a CNN-BiLSTM-based neural network to effectively predict sea level heights. Therefore, if the equipment status characteristics can be effectively re-characterized through a simple method, it is expected to overcome related shortcomings and achieve robust identification of its service performance.
Recently, time-domain-based CM-FD methods have been intensively investigated and successfully applied in some application scenarios 17 . Among them, the graph-based method enjoys the merits of anomalies quantitative evaluation and approximate shift-invariance 18 , 19 . However, it remains challenging to establish the adjacency matrix in a short time which might threaten the online evaluation reliability 20 . To overcome the potential drawbacks, as an extension of our works, Shiliang Feng et al. 21 proposed a time-domain signal-driven mechanical system state description method and validated in some typical mechanical experiments.
During the manufacturing process, rapid tool wear might unpredictably occur, especially for hard-to-machining materials (e.g. nickel-based alloy or titanium alloy). The rapid tool wear will greatly affect the durability of cutting tools and the integrity of machining surfaces. To effectively trace the tool wear dynamic variation and avoid rapid deterioration of surface integrity, it is crucial to predict the short-term time-series response and estimate the tool wear status in advance. However, very little optimization work has been carried out on the dynamic evaluation of the tool wear state based on the predicted short-term time series.
Focus on the drawbacks and the existing research gap mentioned above, inspired by the time-domain-based CM-FD methods, in this research, a tool service state evaluation method that does not rely on any prior knowledge is proposed. With dynamic mode decomposition, the time series in the next snapshot can be predicted. Furthermore, based on graph structure, the anomalies of the tool wear state can be identified. The proposed strategy enjoys the merit of short-time time series prediction and offers exciting opportunities for rapid monitoring of tool wear state. The main structure of the manuscript is summarized as follows. A brief description of the proposed data prediction based on the dynamic mode decomposition method is listed in “ Data prediction based on dynamic mode decomposition method ” section. “ Anomalies identification for time-series ” section presents the proposed anomaly identification for time series. The In-situ tool wear condition monitoring is summarized in “ The proposed in-situ tool wear condition monitoring method ” section. The validation experiment of the proposed tool wear estimation method is listed in “ Experimental investigation ” section. The conclusion of the manuscript is listed in “ Conclusion ” section.
Data prediction based on dynamic mode decomposition method
As a typical fluid dynamics analysis method, benefiting from the extraordinary spatiotemporal feature presentation ability (decomposing complex flow processes into low-rank spatiotemporal features), dynamic mode decomposition has lately received great attention. Because the decomposition does not rely on any given dynamic model, the method is suitable for dynamic process description. In this section, dynamic mode decomposition is employed for short-term time-series prediction.
Model establishment
After equally resampling from the temporal signals, a multivariate time series can be acquired. Assuming the combined multivariate time series is composed of M temporal signals with a length of T , the expression at time t can be expressed as 22 :
where A is the Koopman matrix (coefficient matrix in vector autoregression process) with a dimension of M × M , and ε is the residual term.
Similar, by arranging the T snapshots into two large data matrices:
The expression of the dynamic mode decomposition can be represented as:
Equation ( 3 ) can be regarded as a vector autoregressive problem. If A can be regarded as the Koopman matrix in dynamic mode decomposition, a low-rank structure can be used for the approximation. For autoregressive problems, if it is necessary to calculate the coefficient matrix A , by minimizing the squared residual, the matrix can be acquired.
Model solution
To decrease the model calculation complexity, intrinsic orthogonal decomposition methods (e.g. singular value decomposition) are widely employed to map the high-dimensional variables to low dimension.
With singular value decomposition, the matrix X 1 can be decomposed by 23 :
where U is a m -order unitary matrix, V is a n -order unitary matrix, Σ is a non-negative real diagonal matrix with dimension of m × n . Generally, each eigenvector in V is called the right singular vector of M , each eigenvector in U is called the left singular vector, and the elements on the diagonal of D are called the singular values of M . When the singular values are arranged in descending order, a unique D can be determined.
If the matrix X 1 is truncated for singular value decomposition with a rank of r , the Koopman matrix A can be approximated using the following matrix:
where matrix U r ∈ ℝ M × r , V r ∈ ℝ ( T −1)× r , Σ r ∈ ℝ r× r are the truncation matrixes of the unitary matrix U , the unitary matrix V , the non-negative real diagonal matrix, respectively.
Data prediction
If it is necessary to solve the modal of a matrix and analyze its spatiotemporal characteristics using it, the matrix can be decomposed into eigenvalues 24 :
where \(\Phi\) is a diagonal matrix (the diagonal elements are the corresponding eigenvalues), the matrix Q is composed by the eigenvectors. Therefore, eigenvalues and eigenvectors can be used to analyze and predict the complex spatiotemporal characteristics of the system.
The mode of the dynamic can be defined as:
Therefore, the dynamic prediction of data can be represented as:
where the symbol † indicates the Moore Penrose generalized inverse operation.
Anomalies identification for time-series
A graph mechanism based on temporal signals is proposed to identify anomalies in temporal data.
Graph structure description
In recent years, a novel abnormal health status of equipment evaluation method using time-domain signals has been proposed and aroused wide concerns in mechanical systems 25 , 26 . Based on the graph structure in computer science, the internal feature structure of signals can be evaluated, and the health state of the equipment can also be evaluated accordingly.
According to the graph theoretical, a graph structure can be expressed by G = { N , E }, where N is the set of nodes and E is the set of connections. Among them, the node set can be used to describe different sampling points, and the connection set E is used to describe the connection strength between different nodes. The connection strength between different nodes is reversible, so the set of connections is clearly a symmetric matrix.
For any temporal signal (as shown in Fig. 2 a), the adjacency matrix of its data segments can be expressed as a symmetric matrix (as shown in Fig. 2 c). In this study, the connection strength between different nodes is described by the Euclidean distance between nodes (as shown in Fig. 2 b). Therefore, the collected temporal signals can be reprojected into a set of adjacency matrices (detail of the process can be seen in Ref. 25 ):
where Xn is the n -th symmetric matrix that constitutes the set of adjacency matrices.

Adjacency matrix construction. ( a ) Node determination ( b ) Graph illustration ( c ) Adjacency matrix.
Anomalies identification
Based on the definition of graph structure, related researchers found that if the equipment state (i.e. operating state) is changed, the internal structure or parameters of its corresponding adjacency matrix will also change. Therefore, by evaluating the differences between the corresponding adjacency matrices, the dynamic characteristic of the equipment operation status can be monitored. The methods for anomaly identification can be summarized as follows.
The “standard template” X (in normal state) can be established from the sampled time series based on the traditional graph structure. The standard template matrix can be decomposed by 27 :
where \(\Lambda\) is the eigenvalue matrix (diagonal elements are eigenvalues), \({{\varvec{\Gamma}}}\) is the eigenvector matrix (each column is the eigenvector of matrix X ).
For a given test signal y , the corresponding adjacency matrix Y can be established accordingly. Similarity, the adjacency matrix Y can be decomposed as 28 :
where the symbol diag [.] represents the diagonal elements of the adjacency matrix, and non–diag [.] represents the non-diagonal elements of the adjacency matrix.
By evaluating the non-diagonal components, the similarity between the two signals can be evaluated. For in-situ tool condition monitoring problems, the Frobeniu norm of the non-diagonal can be directly employed for the tool wear evaluation.
The proposed in-situ tool wear condition monitoring method
Combining the dynamic mode decomposition and real-time prediction signal anomaly identification, a method for evaluating the wear status of machining tools without relying on any given prior knowledge is proposed in this research. The main process of this method can be described in Fig. 3 , the specific step is listed as follows:
Step 1 Based on the sensor (near the cutting area) and the digital signal acquisition device, the dynamic signal which can reflect the tool service status information is recorded.
Step 2 By using the dynamic mode decomposition method established in “ Data prediction based on dynamic mode decomposition method ” section, the time-series signal in the next moment can be predicted.
Step 3 With the graph establishment approach (as shown in Eq. ( 10 )), the graph structures of the current moment and the predicted signal can be constructed.
Step 4 Taking the acquired signal as the “standard template”, as shown in Eq. ( 12 ), the graph structure of the predicted signal can be decomposed.
Step 5 The Frobeniu norm of the acquired non-diagonal elements can be used to evaluate the similarity (the tool wear state) between the two signals.

Flowchart of the proposed method.
Experimental investigation
To verify the proposed method, an open-source database, and actual milling experiments are employed for the effectiveness verification of the proposed method.
Investigation in NASA database
As a typical dataset, the NASA Ames and UC Berkeley milling dataset is widely used in the research on the tool condition monitoring of general machining 29 . To investigate the applicability of the proposed method, the NASA dataset is employed in this section. As listed in Table 1 , the acoustic emission signals acquired during the experiment (Mstsuura MC-510 V machine center is employed for the experiment) under the spindle speed of 826 rev/min, depth of cut is 0.75 mm, feed speed of 0.25 mm/rev. A 70 mm face mill with 6 inserts is employed for the processing.
According to the presentation above, appropriate graph structure construction is crucial for tool wear evaluation. The collected time-domain signals contain a significant amount of dynamic information, which can reflect the state of the machining process. Long sampling points can better preserve dynamic information but inevitably affect the timeliness of calculations. Too few sampling points result in the generated graph structure being unable to accurately describe the state information of the machining process. To investigate the performance of tool wear situation in NASA database, setting 800 as the data length of the research, the first sample (data length is 800) is considered as the reference signal (or healthy signal), other samples in the database can be considered as testing signals. Based on the adjacency establish equation before, the calculated reference adjacency is shown in Fig. 4 a. Accordingly, the corresponding eigenvalue and eigenvectors (Fig. 4 b), columns are the corresponding eigenvectors) are acquired after the diagonalization of the reference adjacency.

Signal diagonalization of NASA signal. ( a ) Adjacency. ( b ) Eigenvector.
Based on the proposed method and the acquired eigenvectors, the fluctuation value of the corresponding signal can be calculated. To evaluate the performance quantitatively, the measured tool wear area and the anomaly are normalized as [0, 1]. The normalization can be represented as:
where z indicates the tool wear area or the anomalies sequence, z n is the normalized sequence, min( ⋅ ), max( ⋅ ) are the minimum and maximum value of the sequence respectively. The evaluated tool wear condition is shown in Table 2 . As illustrated in the table, in the whole 23 continuous samples, the corresponding error is ranging from 0 to 0.3280. Accordingly, the mean error between the evaluated tool wear state and the measured tool wear values is calculated as 0.1482. Figure 5 plots the normalized similarity (evaluated tool wear state based on the proposed method, red solid curve in the figure) and the normalized tool wear values (measured tool wear value, blue solid curve in the figure). As shown in Fig. 5 , during the milling process, with the deterioration of the tool state, the Frobeniu norm (anomalies) also increased. The two variables had significant simultaneous change trends.

Tool wear evaluation of NASA signal.
Milling experiment
Experiment setup.
The experiment setup is shown in Fig. 6 . In this experiment, the end milling experiment is conducted on a vertical machining center (Dalian Machine Tool Group DMTG VDL 850A). During the experiment, a kind of uncoated tungsten steel end milling cutter (diameter of 10 mm, detail of the milling cutter can be seen in Fig. 7 , Table 3 ) was employed to cut the workpiece (45 steel, with dimension of 300 × 100 × 80 mm, the chemical properties of the workpiece material is shown in Table 4 ). Related literatures 30 , 31 have shown that there is a certain correlation between the sound pressure signals and the tool wear status during the manufacturing process. To minimize the impact of sensor installation on the machining environment, in this experiment, a non-contact sound pressure sensor is employed to collect dynamic signals during the milling process. During the whole process, the sound pressure sensor (GRAS 46AE, the sensitivity is 50 mV/Pa) is mounted on the table of the machining center near the workpiece (approximately 100 mm away from the workpiece) and used for the acquisition of sound signal. The dynamic signals in this experiment are recorded by a data acquisition instrument (Econ MI-7016 Avant) with a 12 kHz sampling frequency.

Experiment setup. ( a ) Machine tool. ( b ) Magnification of the marked rectangle area.

Diagram of the milling cutter.
To accurately evaluate the actual tool wear state, a direct measuring instrument (Ksgaopin precision instrument GP-300C, as shown in Fig. 8 ) is employed for the estimation. Obviously, the three teeth are independent, the evaluation process of each tooth should perform separately. In the experiment process, the workpiece is manufactured layer upon layer. There are three forward and two backward cuts in each layer, as described in Fig. 9 . After finishing one layer of the workpiece, the tool holder is taken off to evaluate the tool wear state. Generally, according to ISO3685-1977, the tool wear state is presented as the tool flank wear VB. However, as mentioned in related literature, the one-dimensional evaluation parameter cannot fully reflect the tool wear state. In this research, the mean flank wear area of the three flanks is indicated for the tool wear state evaluation.

Direct tool wear detection.

Machining path.
Tool wear evaluation
In order to validate the reliability in actual milling experiments, two milling tests were conducted with the experimental setup. The experimental conditions are shown in Table 5 .
Figure 10 plots the waveforms of the acquired acoustic signals via the sound sensor, as well as the frequency domain. The sampled signals in the 1st layer, 3rd layer, and 5th layer are described in Fig. 10 a,c,e, respectively. The corresponding frequency spectrums are listed in Fig. 10 b,d,f, respectively. As can be seen in the figure, there is almost no obvious variation law or characteristics between the two samples either in time-domain waveforms or frequency-domain. The local magnification of the frequency spectrum (green dashed rectangle in Fig. 10 f) of the 5th layer is shown in Fig. 10 g. The spindle speed during the milling process is 2400 rev/min. Therefore, the spindle rotating frequency (40 Hz) and its harmonics can be observed (orange dashed lines). Caused by the distributed three teeth, the cutting frequency (120 Hz) and its harmonics can also be monitored (green dashed lines).

Signal samples in the milling process. ( a ) Time-domain signal of the 1st layer. ( b ) Frequency spectrum of the 1st layer. ( c ) Time-domain signal of the 3rd layer. ( d ) Frequency spectrum of the 3rd layer. ( e ) Time-domain signal of the 5th layer. ( f ) Frequency spectrum of the 5th layer. ( g ) Local magnification of ( f ).
With the mentioned direct measuring instrument, the actual tool wear state during the manufacturing process can be monitored. Generally, the evolution of wear in tool experiments is a continuous process. The variation process of the wear area and its average value of three cutting edges is shown in Fig. 11 , as well as the tool wear images. According to Fig. 11 , caused by direct contact with the cutting material, generally, a triangular wear band will occur at the cutter edge tip. Besides, the maximum flank wear will also tend to appear around the tooltip. The specific information during the milling tool wear evolution process is shown in Table 6 . As can be seen in Fig. 11 and Table 6 , with the increase in cutting time, the tool wear area grew to mm 2 (mean tool wear area).

Tool wear variation in milling Case I.
By considering the first sample (still setting the data length as 800) is considered as the reference signal (or healthy signal), the other samples can be considered as testing signals. Based on the adjacency establish equation before, the calculated reference adjacency is shown in Fig. 12 a. Accordingly, the corresponding eigenvalue and eigenvectors (Fig. 12 b, columns are the corresponding eigenvectors) are acquired after the diagonalization of the reference adjacency.

Signal diagonalization of the first sample in Case I. ( a ) Adjacency. ( b ) Eigenvector.
Based on the proposed method and the acquired eigenvectors, the fluctuation can be calculated for the similarity evaluation according to Eq. ( 12 ). The measured tool wear states, the anomalies, and their errors are summarized in Table 7 . As illustrated in the table, in the whole 6 continuous samples, the corresponding error is ranging from 0 to 0.2350. Accordingly, the mean error between the evaluated tool wear state and the measured tool wear values is calculated as 0.0881. Figure 13 plots the normalized similarity (evaluated tool wear state based on the proposed method, blue solid curve in the figure) and the normalized tool wear values (measured tool wear value, red solid curve in the figure). The slimier simultaneous trend indicates the potential mapping relationship between the Frobeniu norm (anomalies) and the tool wear.

Tool wear evaluation in Case I.
The variation process of the wear area and its average value of three cutting edges is shown in Fig. 14 , as well as the tool wear images. The specific information during the milling tool wear evolution process is shown in Table 8 . As can be seen in Fig. 14 and Table 8 , with the increase in cutting time, the tool wear area grew to mm 2 (mean tool wear area).

Tool wear variation in milling Case II.
With the same investigation method mentioned before, the measured tool wear states, the anomalies, and their errors can be calculated, as listed in Table 9 . As illustrated in the table, in the whole 6 continuous samples, the corresponding error ranges from 0 to 0.1266 (the measured tool wear values is calculated as 0.0484). Figure 15 plots the normalized similarity (evaluated tool wear state based on the proposed method, blue solid curve in the figure) and the normalized tool wear values (measured tool wear value, red solid curve in the figure).

Tool wear evaluation in Case II.
Tool wear evaluation in different data length
As presented above, data length during the data processing process is crucial for the tool wear evaluation. To investigate the influence of data length in the evaluation process, repeat measuring experiments are conducted. The results in different data lengths are shown in Table 10 . As can be conducted in the table, when the data length varies from 100 to 1000, the evaluation error distribution in the two experiments has no obvious change regular pattern. According to the results, the mean error for the two experiments reaches its minimum value when the data length is 800. Therefore, in this research, the data length is set as 800.
Aiming to the quantitative evaluation of tool wear state, in this research, authors proposed a two-stage method to estimate the tool running condition directly from the time series. In the prediction stage, with the engagement of dynamic mode decomposition, the real-time response of the end milling process can be predicted. In the estimation process, by constructing the graph structure of the time series and calculating the difference between the predicted signal and the real-time signal, the tool wear state during the end milling process can be successfully evaluated. To further confirm the effectiveness of the proposed method, investigations in an open source are presented and achieve a preferable effect. The results were also confirmed by an actual milling experiment from our laboratory. Accordingly, the combination of dynamic mode decomposition and anomalies evaluation method presents a wide range of possibilities for the further development of condition monitoring and fault detection techniques via time series. Besides, in this research, it is assumed that there is a linear relationship between the anomalies and the real tool wear. The nonlinear factors caused by environmental factors such as process parameters and tools have not been considered. Further mechanistic studies and the development of the proposed method are still ongoing in our team.
Data availability
The data that support the findings of this study are included and will be available from the corresponding author upon reasonable request.
Pimenov, D. Y. et al. Artificial intelligence systems for tool condition monitoring in machining: Analysis and critical review. J. Intell. Manuf. 34 , 2078–2121. https://doi.org/10.1007/s10845-022-01923-2 (2023).
Article Google Scholar
Lin, W. J. et al. Integrating object detection and image segmentation for detecting the tool wear area on stitched image. Sci. Rep. 11 (1), 19938. https://doi.org/10.1038/s41598-021-97610-y (2021).
Article ADS CAS PubMed PubMed Central Google Scholar
Wojciechowski, S. & Twardowski, P. Tool life and process dynamics in high speed ball end milling of hardened steel. Procedia CIRP 1 , 2012. https://doi.org/10.1016/j.procir.2012.04.052 (2012).
Wojciechowski, S. et al. Study on ploughing phenomena in tool flank face—Workpiece interface including tool wear effect during ball-end milling. Tribol. Int. 181 , 108313. https://doi.org/10.1016/j.triboint.2023.108313 (2023).
Article CAS Google Scholar
Zhou, Y., Sun, B. & Sun, W. A tool condition monitoring method based on two-layer angle kernel extreme learning machine and binary differential evolution for milling. Measurement 166 , 108186. https://doi.org/10.1016/j.measurement.2020.108186 (2020).
Lei, Z. et al. A GAPSO-enhanced extreme learning machine method for tool wear estimation in milling processes based on vibration signals. Int. J. Precis. Eng. Manuf. Green Technol. 8 , 745–759. https://doi.org/10.1007/s40684-021-00353-4 (2021).
Zi, X., Gao, S. & Xie, Y. An online monitoring method of milling cutter wear condition driven by digital twin. Sci. Rep. 14 (1), 4956. https://doi.org/10.1038/s41598-024-55551-2 (2024).
Article CAS PubMed Google Scholar
Yang, C., Zhou, J., Li, E., Wang, M. & Ting, J. Local-feature and global-dependency based tool wear prediction using deep learning. Sci. Rep. 12 (1), 14574. https://doi.org/10.1038/s41598-022-18235-3 (2022).
Deng, W., Zhang, S., Zhao, S. & Yang, X. A novel fault diagnosis method based on improved empirical wavelet transform and maximum correlated kurtosis deconvolution for rolling element bearing. J. Mech. Eng. 55 (23), 136–146. https://doi.org/10.3901/JME.2019.23.136 (2019).
McDonald, G. L. & Zhao, Q. Multipoint optimal minimum entropy deconvolution and convolution fix: Application to vibration fault detection. Mech. Syst. Signal Process. 82 , 461–477. https://doi.org/10.1016/j.ymssp.2016.05.036 (2017).
Article ADS Google Scholar
Liu, Y., Xiang, H., Jiang, Z. & Xiang, J. Iterative synchrosqueezing-based general linear chirplet transform for time-frequency feature extraction. IEEE Trans. Instrum. Meas. 72 , 1–11. https://doi.org/10.1109/TIM.2022.3232090 (2023).
Ruan, D., Han, J., Yan, J. & Gühmann, C. Light convolutional neural network by neural architecture search and model pruning for bearing fault diagnosis and remaining useful life prediction. Sci. Rep. 13 (1), 5484. https://doi.org/10.1038/s41598-023-31532-9 (2023).
Wu, T. et al. Remaining useful life prediction of circuit breaker operating mechanisms based on wavelet-enhanced dual-tree residual networks. J. Power Electron. 24 (1), 78–91. https://doi.org/10.1007/s43236-023-00706-z (2024).
Article ADS CAS Google Scholar
Zhi, G. et al. An edge-labeling graph neural network method for tool wear condition monitoring using wear image with small samples. Meas. Sci. Technol. 32 (6), 064006. https://doi.org/10.1088/1361-6501/abe0d9 (2021).
Mishra, D., Awasthi, U., Pattipati, K. R. & Bollas, G. M. Tool wear classification in precision machining using distance metrics and unsupervised machine learning. J. Intell. Manuf. https://doi.org/10.1007/s10845-023-02239-5 (2023).
Li, X., Zhou, S., Wang, F. & Fu, L. An improved sparrow search algorithm and CNN-BiLSTM neural network for predicting sea level height. Sci. Rep. 14 (1), 4560. https://doi.org/10.1038/s41598-024-55266-4 (2024).
Article CAS PubMed PubMed Central Google Scholar
Dutta, A., McKay, M., Kopsaftopoulos, F. & Gandhi, F. Statistical residual-based time series methods for multicopter fault detection and identification. Aerosp. Sci. Technol. 112 , 106649. https://doi.org/10.1016/j.ast.2021.106649 (2021).
Wang, T., Liu, Z., Lu, G. & Liu, J. Temporal-spatio graph based spectrum analysis for bearing fault detection and diagnosis. IEEE Trans. Ind. Electron. 68 (3), 2598–2607. https://doi.org/10.1109/TIE.2020.2975499 (2020).
Yang, C., Liu, J., Zhou, K. & Li, X. Dynamic spatial-temporal graph-driven machine remaining useful life prediction method using graph data augmentation. J. Intell. Manuf. 35 (1), 355–366. https://doi.org/10.1007/s10845-022-02052-6 (2024).
Sun, W., Zhou, Y., Xiang, J., Chen, B. & Feng, W. Hankel matrix-based condition monitoring of rolling element bearings: An enhanced framework for time-series analysis. IEEE Trans. Instrum. Meas. 70 , 1–10. https://doi.org/10.1109/TIM.2021.3062194 (2021).
Feng, S. et al. A time-series driven mechanical system state description method and its application in condition monitoring. IEEE Sens. J. 23 (9), 9677–9684. https://doi.org/10.1109/JSEN.2023.3260921 (2023).
Kutz, J. N., Brunton, S. L., Brunton, B. W. & Proctor, J. L. Dynamic Mode Decomposition: Data-Driven Modeling of Complex Systems (Society for Industrial and Applied Mathematics, 2016).
Book Google Scholar
Dai, L., Cao, W., Yi, S. & Wang, L. Damage identification of concrete structure based on WPT-SVD and GA-BPNN. J. Zhejiang Univ. (Eng. Sci.) 57 (1), 100–110. https://doi.org/10.3785/j.issn.1008-973X.2023.01.011 (2023).
Yang, J., Shen, L., Zheng, Z., Li, T. & Yang, Y. Transmission tower looseness detection based on dynamic mode decomposition. J. Vib. Shock 42 (19), 204–211. https://doi.org/10.13465/j.cnki.jvs.2023.19.027 (2023).
Zhang, F. et al. A health condition assessment and prediction method of Francis turbine units using heterogeneous signal fusion and graph-driven health benchmark model. Eng. Appl. Artif. Intell. 126 , 106974. https://doi.org/10.1016/j.engappai.2023.106974 (2023).
Liu, J., Zhou, K., Yang, C. & Lu, G. Imbalanced fault diagnosis of rotating machinery using autoencoder-based SuperGraph feature learning. Front. Mech. Eng. 16 (4), 829–839. https://doi.org/10.1007/s11465-021-0652-4 (2021).
Wen, X., Lu, G., Liu, J. & Yan, P. Graph modeling of singular values for early fault detection and diagnosis of rolling element bearings. Mech. Syst. Signal Process. 145 , 106956. https://doi.org/10.1016/j.ymssp.2020.106956 (2020).
Sun, W. et al. A two-stage method for bearing fault detection using graph similarity evaluation. Measurement 165 , 108138. https://doi.org/10.1016/j.measurement.2020.108138 (2020).
Goebel, A. A. A. K. Best Lab, UC Berkeley Milling Data Set (NASA Ames Research Center).
Liu, M., Tseng, Y. & Tran, M. Tool wear monitoring and prediction based on sound signal. Int. J. Adv. Manuf. Technol. 103 , 3361–3373. https://doi.org/10.1007/s00170-019-03686-2 (2019).
Li, Z. et al. A novel ensemble deep learning model for cutting tool wear monitoring using audio sensors. J. Manuf. Process. 79 , 233–249. https://doi.org/10.1016/j.jmapro.2022.04.066 (2022).
Download references
Acknowledgements
This work was supported in part by the National Natural Science Foundation of China under Grant 52205122.
Author information
These authors contributed equally: Min Chen, Jianwei Mao, Yu Fu and Xin Liu.
Authors and Affiliations
Zhejiang Dewei Cemented Carbide Manufacturing Co., Ltd., Wenzhou, 325699, China
College of Mechanical and Electrical Engineering, Wenzhou University, Wenzhou, 325035, China
Jianwei Mao, Yu Fu, Xin Liu & Weifang Sun
College of Mechanical and Electrical Engineering, Jiaxing Nanhu University, Jiaxing, 314001, China
Yuqing Zhou
You can also search for this author in PubMed Google Scholar
Contributions
M.C. conceived the experiment, and together with Y.F. and X.L. carried it out; J.M. designed and carried out the data analysis; M.C. and W.S. co-wrote the paper; All authors reviewed the manuscript.
Corresponding author
Correspondence to Weifang Sun .
Ethics declarations
Competing interests.
The authors declare no competing interests.
Additional information
Publisher's note.
Springer Nature remains neutral with regard to jurisdictional claims in published maps and institutional affiliations.
Rights and permissions
Open Access This article is licensed under a Creative Commons Attribution 4.0 International License, which permits use, sharing, adaptation, distribution and reproduction in any medium or format, as long as you give appropriate credit to the original author(s) and the source, provide a link to the Creative Commons licence, and indicate if changes were made. The images or other third party material in this article are included in the article's Creative Commons licence, unless indicated otherwise in a credit line to the material. If material is not included in the article's Creative Commons licence and your intended use is not permitted by statutory regulation or exceeds the permitted use, you will need to obtain permission directly from the copyright holder. To view a copy of this licence, visit http://creativecommons.org/licenses/by/4.0/ .
Reprints and permissions
About this article
Cite this article.
Chen, M., Mao, J., Fu, Y. et al. In-situ tool wear condition monitoring during the end milling process based on dynamic mode and abnormal evaluation. Sci Rep 14 , 12888 (2024). https://doi.org/10.1038/s41598-024-63865-4
Download citation
Received : 10 March 2024
Accepted : 03 June 2024
Published : 05 June 2024
DOI : https://doi.org/10.1038/s41598-024-63865-4
Share this article
Anyone you share the following link with will be able to read this content:
Sorry, a shareable link is not currently available for this article.
Provided by the Springer Nature SharedIt content-sharing initiative
- Dynamic mode decomposition
- Condition monitoring
- Abnormal evaluation
- Graph similarity
By submitting a comment you agree to abide by our Terms and Community Guidelines . If you find something abusive or that does not comply with our terms or guidelines please flag it as inappropriate.
Quick links
- Explore articles by subject
- Guide to authors
- Editorial policies
Sign up for the Nature Briefing newsletter — what matters in science, free to your inbox daily.


Monitoring, Evaluation, Accountability and Learning (MEAL) Senior Officer
Cities Alliance, which is hosted by UNOPS, is a global partnership promoting the role of cities in poverty reduction and sustainable development. Managed by a Secretariat based in Brussels, it is a unique partnership with a diverse membership that has come together to strengthen both impacts and coherence in urban development. Cities Alliance is a global leader with a strong track record in grant-making, which supports strategic city planning, slum upgrading strategies, and national policies designed to make cities more inclusive and sustainable. Through UNOPS, the Cities Alliance operates a Multi-Donor Fund supported by an efficient, flexible grant-making mechanism with global reach.
As per its Charter, the main objective of the Cities Alliance is to reduce urban poverty and promote the role of cities in sustainable development. To assess the extent to which its efforts and those of partners are making progress toward that objective, the Cities Alliance monitors, evaluates, and publicly reports its activities within an agreed-upon corporate results framework and through a dedicated result-based management system. The Cities Alliance is also strengthening its learning systems and approaches and integrating learning into the project cycle and Monitoring and Evaluation.
Project Information
Starting in 2024 for a period of 48 months, Cities Alliance (UNOPS) will be responsible for the indirect management of the “Sustainable Urban Integration of Displacement-Affected Communities” (SUIDAC) in Sub-Saharan African cities – financed by the European Union. The Action will address the nexus between forced displacement and urban development in five Sub-Saharan countries: the Democratic Republic of Congo (DRC), Ethiopia, Somalia, Sudan, and Uganda.
The Action aims to:
Improve social cohesion and self-reliance of Displacement-Affected Communities (DACs) in urban and peri-urban areas and expand legal protection (e.g., access to rights, documentation), with specific attention to forcibly displaced populations (refugees, returnees, and IDPs) and including persons with specific needs.
Strengthen local authorities’ capacities to adopt integrated approaches to forced displacement management in urban contexts and promote political and evidence-based policy dialogue at regional, national, and local levels to improve policy frameworks and influence future policy discussions on urban forced displacement.
The Action target beneficiaries are Displacement-Affected Communities (DACs), as well as their hosting cities. Cities are a new environment for the implementation of EU financed forced displacement programs. SUIDAC will be the first urban displacement program financed through the 'Neighborhood, Development and International Cooperation Instrument – Global Europe' ('NDICI-Global Europe') in the SSA region.
The Action builds on and expands the EU Trust Fund program “CRRF: Inclusive Urban Development and Mobility” ending in 2023. Moving forward, SUIDAC will help tackle the challenges arising from sudden and/or sustained forced displacement currently happening in the secondary cities targeted by the Action.
In accordance with UNOPS policies, procedures and practices, and in alignment with the Cities Alliance Corporate MEL system, the MEAL Specialist will be responsible for
Work with and advise the programme teams on MEAL needs, such as providing technical support relating to log frames, indicators, targets, and data quality.
Support the and implementation of the MEAL Plan including indicator reference sheets and other M&E-related guidance, a learning plan, and tools and templates that facilitate the quality monitoring and reporting of results.
Assist with continual development and updating of an effective MEAL system for actions - an online system - supported by the SUIDAC Program and the programmes own performance.
Document and collate available and relevant internal and external data, conduct data verification and quality control.
Ensure the maintenance of the database of performance data, including data verification processes for all SUIDAC - funded activities.
Assist in the coordination of SUIDAC’s monitoring, evaluation, accountability, and learning activities, including the preparation of annual MEAL work plans and MEAL-related budgets.
Regularly revise and update the risk assessment and mitigation plan.
Ensure that emerging risks are identified through regular monitoring and are fully documented.
Ensure that contextual and external risks are updated, identified, tracked, and managed.
Regularly update the SUIDAC programme coordinator on emerging or evolving risks.
When required visit project sites for M&E activities and provide recommendations.
When required, attend all relevant technical meetings, events, monitoring, evaluation, and learning missions and ensure adequate documentation.
With the support of the Cities Alliance M&E Specialist, introduce SUIDAC Program grantees and cities to SUIDAC MEAL requirements and design and implement capacity-strengthening processes to ensure compliance.
Assist with the review of implementing partners’ internal MEAL systems and needs, conducting data quality assessments, and providing advice when required.
Under the Supervision of the Cities Alliance M&E Specialist, provide technical assistance to implementing partners to ensure participation in SUIDAC MEAL process and an adequate flow of information and data.
Assist the Cities Alliance M&E Specialist with the support to partners in strengthening participatory monitoring systems and the collection and use of feedback. Support partners to collect, analyze and use stakeholder feedback, document resulting programme decisions, and share the learning with other partners and Cities Alliance.
Ensure adequate feedback to/from SUIDAC beneficiaries on data and analyses.
Promote information sharing on all aspects related to MEAL activities among stakeholders and promote cross-learning between project sites.
Contribute to the development of the terms of reference for national and international consultants on MEAL.
Under the guidance of the Cities Alliance M&E Specialist, support the design of baseline, mid-term, and final evaluations to ensure credible methodologies for assessment and the identification of learning.
Assist in the design, procurement, implementation and quality control of specific monitoring and evaluation activities.
Support contract management and quality control relating to SUIDAC’s MEAL activities.
Assist in reporting in accordance with the funder requirements including drafting progress reports, updating online reporting systems and annual reporting against the Cities Alliance Corporate Results Framework.
Review and quality control implementing partner reports, particularly relating to MEAL aspects.
Draft lessons learned and internal evaluation/review reports that are evidence-based, and practical and emphasize learning and utilization.
Ensure that MEAL data and risk management information is readily available, as appropriate, to the SUIDAC team and other stakeholders, particularly on performance data and results, lessons learned, and risk management relating to the Program activities.
A Masters Degree, preferably in Monitoring and Evaluation, Social Sciences, Political Sciences, Development, or a related field is required.
A Bachelor’s Degree, preferably in Monitoring and Evaluation, Social Sciences, Political Sciences, Development, or a related field with an additional two years of similar experience is considered equivalent.
A minimum of two years of professional M&E experience is required.
Demonstrated experience in projects implemented in Africa is required.
Demonstrated knowledge of sub-regional and local African contexts is required.
Experience in the development of log frames/results frameworks and identifying appropriate performance indicators is an asset.
UNOPS experience and/or experience in implementing EU-funded projects is an asset.
Experience in quantitative and qualitative analysis, identification of lessons learned, and report drafting is an asset.
Willingness to travel frequently to project sites across the country and sub-region is required.
Fluency in written and oral English is required.
Basic knowledge of French is an asset.
Please note that UNOPS does not accept unsolicited resumes.
- Disclaimer : Contract issuance will be subject to the signature of project agreement and availability of funds.
Applications received after the closing date will not be considered.
Please note that only shortlisted candidates will be contacted and advance to the next stage of the selection process, which involves various assessments.
UNOPS embraces diversity and is committed to equal employment opportunity. Our workforce consists of many diverse nationalities, cultures, languages, races, gender identities, sexual orientations, and abilities. UNOPS seeks to sustain and strengthen this diversity to ensure equal opportunities as well as an inclusive working environment for its entire workforce.
Qualified women and candidates from groups which are underrepresented in the UNOPS workforce are encouraged to apply. These include in particular candidates from racialized and/or indigenous groups, members of minority gender identities and sexual orientations, and people with disabilities.
We would like to ensure all candidates perform at their best during the assessment process. If you are shortlisted and require additional assistance to complete any assessment, including reasonable accommodation, please inform our human resources team when you receive an invitation.
Terms and Conditions
For staff positions only, UNOPS reserves the right to appoint a candidate at a lower level than the advertised level of the post.
For retainer contracts, you must complete a few Mandatory Courses (they take around 4 hours to complete) in your own time, before providing services to UNOPS. For more information on a retainer contract here .
All UNOPS personnel are responsible for performing their duties in accordance with the UN Charter and UNOPS Policies and Instructions, as well as other relevant accountability frameworks. In addition, all personnel must demonstrate an understanding of the Sustainable Development Goals (SDGs) in a manner consistent with UN core values and the UN Common Agenda.
It is the policy of UNOPS to conduct background checks on all potential personnel. Recruitment in UNOPS is contingent on the results of such checks.
APPLICATION TIPS
Together, we build the future.
IMAGES
VIDEO
COMMENTS
Using Case Studies. to doProgram. Evaluation. valuation of any kind is designed to document what happened in a program. Evaluation should show: 1) what actually occurred, 2) whether it had an impact, expected or unexpected, and 3) what links exist between a program and its observed impacts.
Daily Updates of the Latest Projects & Documents. This paper comprises a collection of case studies on the design and implementation of monitoring and ongoing evaluation systems in rural development projects. The case .
The GAO (Government Accountability Office) has described six different types of case study: 1. Illustrative: This is descriptive in character and intended to add realism and in-depth examples to other information about a program or policy. (These are often used to complement quantitative data by providing examples of the overall findings).
Concern that case studies lack rigor: Case studies have been viewed in the evaluation and research fields as less rigorous than surveys or other methods. Reasons for this include the
Case study evaluation approach. The case study evaluation approach is a powerful tool for monitoring and evaluating the success of a program or initiative. It allows researchers to look at the impact of a program from multiple perspectives, including the behavior of participants and the effectiveness of interventions.
Monitoring and Evaluation Training: A Systematic Approach. Thousand Oaks, CA: Sage. 464 pp. $69 (paperback), ISBN 9781452288918. ... She also illustrates the difficult-to-articulate distinctions between each of these tools by describing a case study at each step of the way. Throughout the book, she uses a physical activity promotion project on ...
This article provides a case study of a digital storytelling evaluation initiative in monitoring and evaluation (M&E) in an Australian community not-for-profit. The aim is to offer practical insights for evaluators and organizations considering digital storytelling and other film narrative methods for participant-centered evaluation.
These case studies were developed as part of the World Bank's Results Monitoring and Evaluation for Resilience Building Operations (ReM&E) project, which aims to develop and increase the application of systematic, robust, and useful approaches to monitoring and evaluation (M&E) for resilience-building projects/programs within the World Bank.
These case studies provide a detailed perspective based on evaluation for each context, emphasizing the specific areas of impact and improvement addressed through Monitoring and Evaluation (M&E) efforts. Case Study 1: Health Clinic Efficiency. Basis of Evaluation: Efficiency and Service Delivery Improvement
What is a case study? There are many different text books and websites explaining the use of case studies and this section draws heavily on those of Lamar University and the NCBI (worked examples), as well as on the author's own extensive research experience.. If you are monitoring/ evaluating a project, you may already have obtained general information about your target school, village ...
service delivery in the public sector using the case study of the Department of Home Affairs and the impact this has on effective and efficient delivery of public services. Furthermore, the study will assist the Department in fostering a culture that values the role of M&E. Research on the implementation of Monitoring and Evaluation is
Studies have shown that effective evaluation practices may enhance project planning, monitoring, and control procedures, which can lead to better project outcomes. For instance, a study by Zhang and Yang ( Citation 2018 ) showed that incorporating evaluation practices into the project management process increased project success rates.
Monitoring and evaluation is a key activity in systematic development planning. This case study of a large urban project in Nairobi, Kenya, looks at ways in which evaluation data and methods can be useful in an on-going process of decision-making. Several management tools, including interpretive structural modelling, delta charts, and an issue ...
Introduction 1.1. Introduction and Background to the Study Monitoring and evaluation (M&E) has the capacity to transform government departments and the public sector into a functional system that is participatory and representative (UNDP, 2013).
A case study evaluation approach is a great way to gain an in-depth understanding of a particular issue or situation. This type of approach allows the researcher to observe, analyze, and assess the effects of a particular situation on individuals or groups. An individual, a location, or a project may serve as the focal point of a case study's ...
Centre for Learning And Evaluation Results (CLEAR). (2012). African Monitoring and Evaluation Systems, Graduate School of Public and Development Management, University of the Witwatersrand, Johannesburg. This publication is an analysis of six monitoring and evaluation (M&E) case studies from Benin, Ghana, Kenya, Senegal, South Africa, and Uganda.
The case studies in this chapter describe experiences from countries in monitoring and evaluation of national adolescent health plans and strategies, and youth involvement in such efforts. Process evaluation of PLAN-A intervention (Peer-Led physical Activity iNtervention for Adolescent girls) in the United Kingdom
While there are substantial studies on monitoring and evaluation (M&E) in Ghana (Akanbang & Abdallah 2021; Gildemyn 2014;Tengan & Aigbavboa 2017), there are limited studies on indigenous ...
This case study supports and illustrates the theoretic factsheet "Monitoring and evaluation (safe water business)" with practical insights. TARA going from informal, to paper to a mobile app - M&E evolution in India
PDF | On May 1, 2006, Palena Neale and others published Monitoring and Evaluation-1 PREPARING A CASE STUDY: A Guide for Designing and Conducting a Case Study for Evaluation Input Monitoring and ...
The 'M&E Case Studies', the latest addition to M&E resources for the Academy, represents continued efforts by APCICT to enhance monitoring and evaluation of the Academy programme and improve its delivery at the national level. It documents the field testing experience of the M&E Toolkit by partners implementing the Academy programme in ...
it may be difficult to hold a reader's interest if too lengthy. In writing the case study, care should be taken to provide the rich information in a digestible manner. Concern that case studies lack rigor:Case studies have been viewed in the evaluation and research fields as less rigorous than surveys or other methods. Reasons for this ...
The purpose of the section "Methodology" is to create an evaluation indicator system and introduce an evaluation method. Section "Case Study" demonstrates a detailed introduction to the case study and data collection process. ... Yang, Y. (2020). Smart community security monitoring based on artificial intelligence and improved machine ...
Public health policy impact evaluation is challenging to study because randomized controlled experiments are infeasible to conduct, and policy changes often coincide with non-policy events. Quasi-experiments do not use randomization and can provide useful knowledge for causal inference. Here we demonstrate how longitudinal wastewater monitoring of viruses at a small geographic scale may be ...
Digital trace data presents an opportunity for promptly monitoring shifts in migrant populations. This contribution aims to determine whether the number of European migrants in the United Kingdom (UK) declined between March 2019 and March 2020, using weekly estimates derived from the Facebook Advertising Platform.
Study area and inflow streams. Lake Iznik, which is the subject of this study, is an elliptical freshwater lake with a surface area of 308 km 2 located between 40° 30′-40° 23′ north and 29° 20′-29° 42′ east, lying 85 m above sea level (Budakoğlu, 2000).Its width in the north-south axis varies between 10 and 11.5 km, and it is located in a large tectonic depression with a ...
Performance evaluation of the multi-decoder segmentation network was conducted on three publicly accessible datasets, demonstrating robust results with an average dice score of 89.9% and an average surface dice of 86.87%. ... In particular, we focus on a case study of COVID-19 lesion segmentation, a crucial task for understanding disease ...
Condition monitoring and fault diagnosis for computer numerical control (CNC) machines have been widely investigated in recent years and achieved great progress 1,2.As a crucial component used to ...
4 AFRICAN MONITORING AND EVALUATION SYSTEMS EXPLORATORY CASE STUDIES A C KNO W LED G EM ENT S This case studies contained within this volume are the product of a process that has been in progress for just over a year. In that period many hands have contributed to the Þnal product. Salim Latib provided overall project management.
Vacancy code VA/2024/B5007/28256. Level ICS-9. Department/office GPO, GVA, Geneva. Duty station Kampala, Uganda. Contract type International ICA. Contract level IICA-1. Duration 12 months initially, renewable subject to satisfactory performance and funding availability. Application period 28-May-2024 to 25-Jun-2024.