
Zabbix Essentials
Rajesh kumar.
(Senior DevOps Manager & Principal Architect)

Rajesh Kumar — an award-winning academician and consultant trainer, with 15+ years’ experience in diverse skill management, who has more than a decade of experience in training large and diverse groups across multiple industry sectors.
What is Zabbix?

- Zabbix has a centralized web interface
- The server can be run on most Unix-like operating systems
- This monitoring system has native agents for most Unix, Unix-like, and Microsoft Windows operation systems
- The system is easy to integrate with other systems, thanks to the API available in many different programming languages and the option that Zabbix itself provides
- Zabbix can monitor via SNMP (v1, v2, and v3), IPMI, JMX, ODBC, SSH, HTTP(s), TCP/UDP, and Telnet
- This monitoring system gives us the possibility of creating custom items and graphs and interpolating data
- The system is easy to customize
Zabbix Release Timeline

Why Zabbix?
- Open Source – Zabbix is purely open source and comes at no cost.
- Active Monitoring – You can easily monitor servers, applications and network devices, gathering accurate statistics and performance data
- Enterprise ready – Zabbix has been designed to scale from small environments to large environments
- Capacity Planning – With the data collected by Zabbix, you will be easy to analyze your infrastructure and plan the capacity accordingly.

Zabbix Feature & Advantages

How Zabbix works & Architecture?
Zabbix architecture.
Zabbix consists of several major software components, the responsibilities of which are outlined below.
SERVER: Zabbix server is the central component to which agents report availability and integrity information and statistics. The server is the central repository in which all configuration, statistical and operational data are stored.
DATABASE STORAGE: DATABASE STORAGE: All configuration information as well as the data gathered by Zabbix is stored in a database.
WEB INTERFACE: For an easy access to Zabbix from anywhere and from any platform, the web-based interface is provided. The interface is part of Zabbix server, and usually (but not necessarily) runs on the same physical machine as the one running the server.
PROXY: Zabbix proxy can collect performance and availability data on behalf of Zabbix server. A proxy is an optional part of Zabbix deployment; however, it may be very beneficial to distribute the load of a single Zabbix server.
AGENT: Zabbix agents are deployed on monitoring targets to actively monitor local resources and applications and report the gathered data to Zabbix server. Since Zabbix 4.4, there are two types of agents available: the Zabbix agent (lightweight, supported on many platforms, written in C) and the Zabbix agent 2 (extra-flexible, easily extendable with plugins, written in Go).
Zabbix Server
Zabbix server is the central process of Zabbix software.
The server performs the polling and trapping of data, it calculates triggers, sends notifications to users. It is the central component to which Zabbix agents and proxies report data on availability and integrity of systems. The server can itself remotely check networked services (such as web servers and mail servers) using simple service checks.
The server is the central repository in which all configuration, statistical and operational data is stored, and it is the entity in Zabbix that will actively alert administrators when problems arise in any of the monitored systems.
The functioning of a basic Zabbix server is broken into three distinct components; they are: Zabbix server, web frontend and database storage.

Zabbix Agent
Zabbix agent is deployed on a monitoring target to actively monitor local resources and applications (hard drives, memory, processor statistics etc).
The agent gathers operational information locally and reports data to Zabbix server for further processing. In case of failures (such as a hard disk running full or a crashed service process), Zabbix server can actively alert the administrators of the particular machine that reported the failure.

Zabbix Proxy
Zabbix proxy is a process that may collect monitoring data from one or more monitored devices and send the information to the Zabbix server, essentially working on behalf of the server. All collected data is buffered locally and then transferred to the Zabbix server the proxy belongs to.
Deploying a proxy is optional, but may be very beneficial to distribute the load of a single Zabbix server. If only proxies collect data, processing on the server becomes less CPU and disk I/O hungry.

Active agent: The Zabbix agent periodically asks the Zabbix proxy (or Zabbix server, if configured to use the server directly) for the list of items that should be collected, and then the agent will keep collecting the item values using the configured intervals and sending the values to the proxy. The proxy does not need to poll all the clients for the values, so this is more efficient way of working.
Passive agent: The Zabbix agent passively waits for connections. When the Zabbix proxy requires the item values from a client, it connects to the client and gets the item values. This requires the proxy to schedule and initiate the connections to all agents, so it requires more work from the proxy.

Zabbix Protocol

Zabbix Java Gateway
Native support for monitoring JMX applications exists in the form of a Zabbix daemon called “Zabbix Java gateway”, available since Zabbix 2.0. Zabbix Java gateway is a daemon written in Java. To find out the value of a particular JMX counter on a host, Zabbix server queries Zabbix Java gateway, which uses the JMX management API to query the application of interest remotely.
The application does not need any additional software installed, it just has to be started with -Dcom.sun.management.jmxremote option on the command line.
Java gateway accepts incoming connection from Zabbix server or proxy and can only be used as a “passive proxy”. As opposed to Zabbix proxy, it may also be used from Zabbix proxy (Zabbix proxies cannot be chained). Access to each Java gateway is configured directly in Zabbix server or proxy configuration file, thus only one Java gateway may be configured per Zabbix server or Zabbix proxy.Java gateway accepts incoming connection from Zabbix server or proxy and can only be used as a “passive proxy”. As opposed to Zabbix proxy, it may also be used from Zabbix proxy (Zabbix proxies cannot be chained). Access to each Java gateway is configured directly in Zabbix server or proxy configuration file, thus only one Java gateway may be configured per Zabbix server or Zabbix proxy.

Zabbix Sender
Zabbix sender is a command line utility that may be used to send performance data to Zabbix server for processing.
The utility is usually used in long running user scripts for periodical sending of availability and performance data.
For sending results directly to Zabbix server or proxy, a trapper item type must be configured.
Zabbix get is a command line utility which can be used to communicate with Zabbix agent and retrieve required information from the agent.
Zabbix_js is a command line utility that can be used for embedded script testing.
This utility will execute a user script with a string parameter and print the result. Scripts are executed using the embedded Zabbix scripting engine.
In case of compilation or execution errors zabbix_js will print the error in stderr and exit with code 1.
Zabbix Web service
Zabbix web service is a process that is used for communication with external web services. Currently, Zabbix web service is used for generating and sending scheduled reports with plans to add additional functionality in the future.
Zabbix server connects to the web service via HTTP(S). Zabbix web service requires Google Chrome to be installed on the same host; on some distributions the service may also work with Chromium (see known issues) .
DevOpsSchool Community Networks
These platforms provide you the opportunity to connect with peers and industry DevOps leaders, where you can share, discuss or get information on latest topics or happenings in DevOps culture and grow your DevOps professionals network.

Any Questions?

DevOpsSchool — Lets Learn, Share & Practice DevOps
www.devopsschool.com
Connect with us on

Session-2-Zabbix-Agent-JMX-IPMI
Zabbix Tutorial for Beginners: A Step-by-Step Guide
Zabbix tutorials.
| Installation | Install the latest Zabbix on , , , or |
| Datacenter Monitoring | |
| Network Monitoring | |
| Visualization | |
| Administration | |
| Optimization | Install Zabbix-Proxy on , , , or |
| Maintenance | |
Zabbix installation
Datacenter monitoring, a) window/linux monitoring, b) vmware monitoring, c) website monitoring, network monitoring, mail alerts and escalations, zabbix maps, optimizing zabbix, a) proxy servers, b) how to optimize zabbix mysql / mariadb database, maintaining zabbix, a) upgrading zabbix, b) importing snmp mib to zabbix, leave a comment cancel reply.
A Look Back at Zabbix Summit 2023
Autumn in the Latvian capital of Riga is marked by a variety of traditions. The leaves fall, the rainy season arrives, the birds migrate, and IT professionals from around the world descend on the city for the annual Zabbix Summit.
On October 6 and 7, the Radisson Blu Hotel Latvija was packed with 450 delegates from 38 countries, all there for Zabbix Summit 2023 , the 11th in-person version of Zabbix’s premier yearly event.
This year’s Summit was marked by presentations, partner activities, and moments of relaxation and celebration that will energize the Zabbix community and spark ideas that attendees will take home to every corner of the world.
If you couldn’t make it, here’s a little taste of how it felt to be there!

Zabbix Summit 2023 in numbers
The stage hosted 27 speakers from 17 different countries who gave 31 speeches, including both lectures and lightning talks. There were four workshops with deep dives into technical topics, conducted by the Zabbix technical team as well as our partners from Opensource ICT Solutions and IZI-IT. Summit attendees also enjoyed three parties designed to provide a relaxing experience and networking opportunities.
Zabbix Summit 2023 proudly featured 10 sponsors, all part of Zabbix’s official partner network. They included:
initMAX – Diamond Sponsor IntelliTrend – Platinum Sponsor IZI-IT – Platinum Sponsor Quadrata – Platinum Sponsor Allenta – Gold Sponsor Metricio – Gold Sponsor Opensource ICT Solutions – Gold Sponsor Docomo Business – Gold Sponsor SRA OSS – Silver Sponsor Enthus – Lunch and coffee break sponsor
We’d also like to give a shout-out to our Zabbix Fans, who played a crucial role in supporting the Summit this year (as every year) with their attendance, merchandise purchases, and enthusiasm!
We’re grateful to everyone who played a role and helped us make Zabbix Summit 2023 happen!

Highlights from the main stage
This year we continued a Summit tradition and allowed our in-person audience as well those tuning in via livestream and YouTube to ask questions during live Q&A sessions – a feature that made the proceedings more interactive and helped everyone feel more involved. The speeches were all fascinating and well received, but a few in particular stood out:
What the future holds for Zabbix
Zabbix CEO and Founder Alexei Vladishev kicked off the presentations on Day 1 with a keynote speech about his current plans for Zabbix’s development, including a detailed look at enhancements requested by users.
Avoiding alert fatigue
Bringing a less technical and more conceptual approach to addressing day-to-day data monitoring issues, Rihards Olups, SaaS Architect at Nokia, discussed alert fatigue and how science explains it. During his presentation, Rihards showed how an excess of alerts can negatively affect selective attention and shared his thoughts about how professionals can intervene to prevent problems.
Making Zabbix’s latest offerings accessible to everyone
Day 2 began with Zabbix Director of Business Development Sergey Sorokin focusing on new plans and offerings , including a subscription system for technical support, consulting services, and monitoring tailored for managed service providers.
Monitoring everything (and we do mean everything!)
Janne Pikkarainen, Lead Site Reliability Engineer at Forcepoint, provided detailed and entertaining insights into how he connects Zabbix to smart accessories and uses it to monitor aspects of his home, including the location of personal items, noise levels, and even the frequency of his daughter’s naps and cries.
Implementing ideas and design in MSP environments
In tackling the topic of data collection and analysis for service providers, Brian van Baekel, Zabbix Trainer at Opensource ICT Solutions, presented details on the development of projects focused on monitoring service providers. He also highlighted best practices for data collection in Zabbix Server, data storage, and presenting on the Zabbix Frontend.
Monitoring the London transportation system
A use case presented by Nathan Liefting, Zabbix Consultant and Trainer at Opensource ICT Solutions, and Adan Mohamed, DevOps Manager at Boldyn Networks, showed how Zabbix monitors the availability of the London Underground subway system. Data is collected from 136 “tube” stations in a high-level architecture and used to assess the availability of Wi-Fi networks, emergency connections, and other services.
Bringing the Olympics and World Cup to life with Zabbix
Marianna Portela, a Tech Lead at Globo in Brazil, shared her insights into how Zabbix supports Globo’s digital transformation and helps her monitor live event infrastructure at massive events like the Olympics and World Cup.
Don’t forget the fun part!
Zabbix Summits are renowned for their friendly, informal atmosphere, which is probably most clearly on display at our famous Summit parties.
Zabbix Summit 2023’s Welcome party was held at the Stargorod Riga brewery in the heart of Riga’s old town. It featured arm wrestling, a selection of delicious foods and beverages, and plenty of opportunities for Summit participants to get to know each other.
The Main party saw live music, dancing, quizzes, and other fun events take place within the historic confines of the Latvian Railway History Museum. The atmosphere, food, drinks, and good company all combined to create an event that nobody who attended will soon forget!
Last but not least, the Closing party at the Burzma food hall was a true celebration of the diversity of the global Zabbix community, with food and music from every country with a Zabbix presence as well as plenty of opportunities for Summit attendees to swap stories and exchange contact details.

Open door, open minds
The traditional Zabbix open-door day was held on Thursday, October 5, and while past Summits have typically seen around 50 visitors, we were proud to welcome closer to 100 this time around. Attendees could have a coffee with their favorite Zabbix employees, play a friendly game of foosball or table tennis, and get a behind-the-scenes look at where the magic happens.

One new feature that made a big splash at this year’s Summit was the testimonial booth, which allowed Summit attendees to share their thoughts and experiences about Zabbix with the rest of our community. Sharing a testimonial or leaving a review allowed attendees to collect a piece of exclusive Zabbix Summit 2023 merchandise, and we went through a lot of it – the booth provided us with 28 filmed and 17 written testimonials about Zabbix products and services, far more than we anticipated.

Where to find the presentations
If you couldn’t attend but want to stay informed about what was discussed at the event (or if you’d just like to revisit the stage presentations), both days of recordings are available on Zabbix’s YouTube channel at the following links:
Streaming – Zabbix Summit Day 1
Streaming – Zabbix Summit Day 2
The graphics and texts of the presentations are also available for reference and download on the official event website.
We hope that Zabbix Summit 2023 was a time of valuable learning, connections, and idea exchange for everyone who attended or followed along through social media. If you’ve enjoyed the photos, you can see several more on our Instagram.
If you had an amazing time at Zabbix Summit 2023 (and we certainly hope you did), registration for Zabbix Summit 2024 is already open and Early Bird tickets are available.
See you next year!

Documentation
- 7.0 (current)
- In development
- 7.2 (devel)
- Unsupported

Configuration
4 slide shows.
In a slide show you can configure that a number of screens are displayed one after another at set intervals.
Sometimes you might want to switch between some configured screens. While that can be done manually, doing that more than once or twice may become very tedious. This is where the slide show function comes to rescue.
All users in Zabbix (including non-admin users) can create slide shows. Slide shows have an owner - the user who created them.
Slide shows can be made public or private. Public slide shows are visible to all users, however, they must have at least read permissions to all slide show elements (screens) to see it. To add a screen to the slide show the user must also have at least read permission to it.
Private slide shows are visible only to their owner. Private slide shows can be shared by the owner to other users and user groups. Regular (non-Super admin) users can only share with the groups and users they are member of. Private slide shows will be visible to their owner and the users the slide show is shared with as long as they have read permissions to all included screens. Admin level users, as long as they have read permissions to all included screens, can see and edit private slide shows regardless of being the owner or belonging to the shared user list.
To create a slide show, do the following:
- Go to Monitoring → Screens
- Select Slide shows in the dropdown
- Go to the view with all slide shows
- Click on Create slide show
The Slide tab contains general slide show attributes:

| Parameter | Description |
|---|---|
| Select the slide show owner. Specifying owner is mandatory. | |
| Unique name of the slide show. | |
| How long one screen is displayed by default, before rotating to the next, in seconds. | |
| List of screens to be rotated. Click on to select screens. The arrow before the screen allows to drag a screen up and down in the sort order of display. If you want to display only, say, a single graph in the slide show, create a screen containing just that one graph. | |
| Screen name. | |
| A custom value for how long the screen will be displayed, in seconds. If set to 0, the value will be used. | |
| Click on to remove a screen from the slide show. |
The slide show in this example consists of two screens which will be displayed in the following order:
Zabbix server ⇒ Displayed for 30 seconds ⇒ Zabbix server2 ⇒ Displayed for 15 seconds ⇒ Zabbix server ⇒ Displayed for 30 seconds ⇒ Zabbix server2 ⇒ …
The Sharing tab contains the slide show type as well as sharing options (user groups, users) for private slide shows:

| Parameter | Description |
|---|---|
| Select slide show type: - slide show is visible only to selected user groups and users - slide show is visible to all | |
| Select user groups that the slide show is accessible to. You may allow read-only or read-write access. | |
| Select users that the slide show is accessible to. You may allow read-only or read-write access. |
Click on Add to save the slide show.
Slide shows that are ready can be viewed in Monitoring → Screens , then choosing Slide shows from the dropdown and clicking on the slide show name.
With the Menu option next to the dropdown, you can accelerate or slow down the display by choosing a slide delay multiplier:

If a delay ends up as being less than 5 seconds (either by having entered a delay less than 5 seconds or by using the slide delay multiplier), a 5-second minimum delay will be used.
IMAGES
VIDEO
COMMENTS
P. pundir5. Zabbix is an open source network monitoring software that allows users to monitor networks, servers and other network hardware and services. It works by having Zabbix agents installed on devices that report data to a central Zabbix server. The server then stores and analyzes the data to trigger alerts if issues arise.
Zabbix frontend and documentation are available in many different languages. Our goal is to make Zabbix easy to use for people all over the globe. With Zabbix community localization tools you have the opportunity to help us translate Zabbix into your language. A vast selection of languages available out of the box
Visualization and reporting. Event and problem handling and processing. Extending scope of monitoring: compliance monitoring, APM, advanced log monitoring, public and hybrid cloud monitoring. Extendability on all levels: trigger functions, storage engines, agent plugins+UI modules+3rd party widgets, webhooks.
This document contains a presentation about Zabbix, an open source monitoring software. It discusses Zabbix's history as a free and open source project, its current capabilities, and planned new features for the upcoming Zabbix 2.0 release. Some of the highlighted new features include improved user experience, low level discovery, monitoring of ...
These pages contain official Zabbix documentation. Use the sidebar navigation to browse documentation pages. To be able to watch pages, log in with your Zabbix forums username and password. To toggle search highlight, press Ctrl+Alt+H. Have an improvement suggestion for this page? Select the text that could be improved and press Ctrl+Enter to ...
In this video we will take a look at key Zabbix concepts, such as Hosts, Items, Triggers and Actions - and how they can be used to start monitoring your IT i...
Short and simple Fundamentals Overview of Zabbix monitoring software. Starting with what are the best use cases. Possible things and niches that you can moni...
The interface is part of Zabbix server, and usually (but not necessarily) runs on the same physical machine as the one running the server. PROXY: Zabbix proxy can collect performance and availability data on behalf of Zabbix server. A proxy is an optional part of Zabbix deployment; however, it may be very beneficial to distribute the load of a ...
Zabbix Training: https://bit.ly/3rYga0DIn this video tutorial, we are going to learn about Zabbix.Zabbix is an open-source monitoring solution for network mo...
In response to user demand, Zabbix 7.0 LTS comes pre-packaged with a range of new templates for the most popular vendors and cloud providers. Zabbix 7.0 training updates. All Zabbix training materials have been updated based on the new functionalities that have been added to the product since Zabbix 6.0.
If it's SINGLE : Create incident If it's MULTIPLE : Check if there are new/different values. 3) A new incident is created. Find and associate to the correct CI Verify if specific service was listed in TAGs. 4) Update the trigger URL definition, which works in dashboard and problem menu.
General Company Presentation 4 About us French Software Company since 2009 2011 : H5-700 10 Gig ... Zabbix Integration. General Company Presentation 20 •H5 Dock Analytics Client Display 70 metrics in Real Time : Bytes, Mbps, Packet loss, Response Time, Network Delay, Jitter, Bursts, etc.
The official manuals provide detailed information about how to install, configure, and run Zabbix. Zabbix. Product. Watch Zabbix demo video. Features. Explore how Zabbix collects, processes, and visualizes data. Integrations. See the list of monitoring templates and integrations. Documentation. Official manuals on how to install, configure, and ...
Zabbix Summit 2022 comes back as an on-site event with in-person networking, workshops, speeches, and fun for all monitoring geeks out there. ... The setting and the goal of the conferences can vary by a large degree - from product presentations to technology stack overviews and community get-togethers. Zabbix Summit is somewhat special ...
A Zabbix proxy is a useful tool that can gather performance and availability data from remote devices on behalf of the Zabbix server. This service may not be required for everyone, but it can be useful in situations where remote locations have firewalls or poor connectivity. Additionally, it can be useful in large environments where the Zabbix ...
Zabbix is the ultimate enterprise-level software designed for monitoring availability and performance of IT infrastructure components. With Zabbix it is possible to gather virtually limitless ...
Zabbix agent is a process deployed on monitoring targets to actively monitor local resources and applications (storage drives, memory, processor statistics, network, file systems, etc). The agent gathers operational information locally and reports data to Zabbix server for further processing. Zabbix agents are extremely efficient because of use of
The Zabbix Team announced the release of Zabbix 7.0, marking a major update to its robust monitoring suite. For those unfamiliar, Zabbix offers a scalable, enterprise-class open-source solution for monitoring networks, servers, virtual machines, and cloud services, ensuring real-time data management and security.
Presentation. This page describes the components that can be used to create a widget presentation view. The widget presentation view is the part of the widget that receives the data according to its configuration and displays it on the dashboard in a container. The presentation view consists of three parts: Widget action.
By Michael Kammer October 12, 2023. Autumn in the Latvian capital of Riga is marked by a variety of traditions. The leaves fall, the rainy season arrives, the birds migrate, and IT professionals from around the world descend on the city for the annual Zabbix Summit. On October 6 and 7, the Radisson Blu Hotel Latvija was packed with 450 ...
Maps are one of many visualization options inside the Zabbix. A way how to display your collected data, show the problems, and create your topology. A map is...
Zabbix Meetup Online in Portuguese is going to be an exclusive online event - two hours of Zabbix technical presentations: Synthetic monitoring in Zabbix 5.2, Pre-processing and other useful topics. Register to book your online seat. Learn more. Read more. 10 December 2020
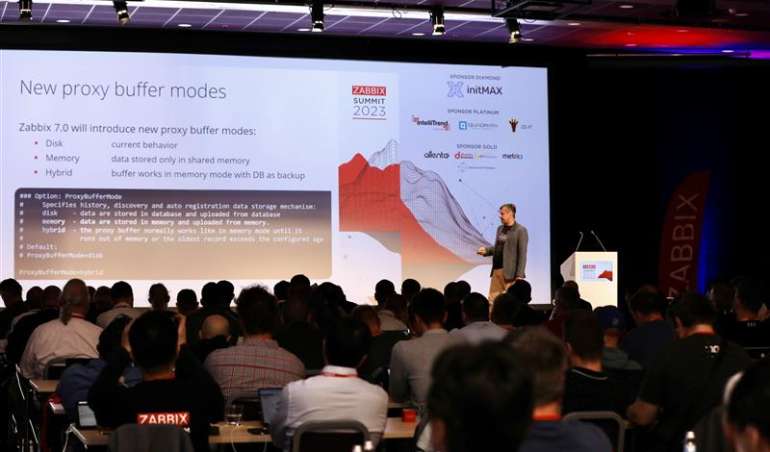
zabbix[proxy_buffer,state,current] - returns the current working state where the new data are being stored. The following internal items have also been added: zabbix[discovery_queue] - allows to monitor the number of discovery checks in the queue; zabbix[vps,written] - allows to monitor the total number of history values written to database.
Zabbix needs Development Let Zabbix develop additional features for your business needs Integration Expand your workflow Connect Zabbix to your ticketing system, service desk, or any other tool Move all your data to Zabbix Switch to Zabbix without the trouble of moving all your legacy infrastructure yourself Upgrade Use the latest version
All users in Zabbix (including non-admin users) can create slide shows. Slide shows have an owner - the user who created them. Slide shows can be made public or private. Public slide shows are visible to all users, however, they must have at least read permissions to all slide show elements (screens) to see it. To add a screen to the slide show ...