
Statistics Made Easy

The Importance of Statistics in Research (With Examples)
The field of statistics is concerned with collecting, analyzing, interpreting, and presenting data.
In the field of research, statistics is important for the following reasons:
Reason 1 : Statistics allows researchers to design studies such that the findings from the studies can be extrapolated to a larger population.
Reason 2 : Statistics allows researchers to perform hypothesis tests to determine if some claim about a new drug, new procedure, new manufacturing method, etc. is true.
Reason 3 : Statistics allows researchers to create confidence intervals to capture uncertainty around population estimates.
In the rest of this article, we elaborate on each of these reasons.
Reason 1: Statistics Allows Researchers to Design Studies
Researchers are often interested in answering questions about populations like:
- What is the average weight of a certain species of bird?
- What is the average height of a certain species of plant?
- What percentage of citizens in a certain city support a certain law?
One way to answer these questions is to go around and collect data on every single individual in the population of interest.
However, this is typically too costly and time-consuming which is why researchers instead take a sample of the population and use the data from the sample to draw conclusions about the population as a whole.

There are many different methods researchers can potentially use to obtain individuals to be in a sample. These are known as sampling methods .
There are two classes of sampling methods:
- Probability sampling methods : Every member in a population has an equal probability of being selected to be in the sample.
- Non-probability sampling methods : Not every member in a population has an equal probability of being selected to be in the sample.
By using probability sampling methods, researchers can maximize the chances that they obtain a sample that is representative of the overall population.
This allows researchers to extrapolate the findings from the sample to the overall population.
Read more about the two classes of sampling methods here .
Reason 2: Statistics Allows Researchers to Perform Hypothesis Tests
Another way that statistics is used in research is in the form of hypothesis tests .
These are tests that researchers can use to determine if there is a statistical significance between different medical procedures or treatments.
For example, suppose a scientist believes that a new drug is able to reduce blood pressure in obese patients. To test this, he measures the blood pressure of 30 patients before and after using the new drug for one month.
He then performs a paired samples t- test using the following hypotheses:
- H 0 : μ after = μ before (the mean blood pressure is the same before and after using the drug)
- H A : μ after < μ before (the mean blood pressure is less after using the drug)
If the p-value of the test is less than some significance level (e.g. α = .05), then he can reject the null hypothesis and conclude that the new drug leads to reduced blood pressure.
Note : This is just one example of a hypothesis test that is used in research. Other common tests include a one sample t-test , two sample t-test , one-way ANOVA , and two-way ANOVA .
Reason 3: Statistics Allows Researchers to Create Confidence Intervals
Another way that statistics is used in research is in the form of confidence intervals .
A confidence interval is a range of values that is likely to contain a population parameter with a certain level of confidence.
For example, suppose researchers are interested in estimating the mean weight of a certain species of turtle.
Instead of going around and weighing every single turtle in the population, researchers may instead take a simple random sample of turtles with the following information:
- Sample size n = 25
- Sample mean weight x = 300
- Sample standard deviation s = 18.5
Using the confidence interval for a mean formula , researchers may then construct the following 95% confidence interval:
95% Confidence Interval: 300 +/- 1.96*(18.5/√ 25 ) = [292.75, 307.25]
The researchers would then claim that they’re 95% confident that the true mean weight for this population of turtles is between 292.75 pounds and 307.25 pounds.
Additional Resources
The following articles explain the importance of statistics in other fields:
The Importance of Statistics in Healthcare The Importance of Statistics in Nursing The Importance of Statistics in Business The Importance of Statistics in Economics The Importance of Statistics in Education
Featured Posts
Hey there. My name is Zach Bobbitt. I have a Masters of Science degree in Applied Statistics and I’ve worked on machine learning algorithms for professional businesses in both healthcare and retail. I’m passionate about statistics, machine learning, and data visualization and I created Statology to be a resource for both students and teachers alike. My goal with this site is to help you learn statistics through using simple terms, plenty of real-world examples, and helpful illustrations.
Leave a Reply Cancel reply
Your email address will not be published. Required fields are marked *
Join the Statology Community
Sign up to receive Statology's exclusive study resource: 100 practice problems with step-by-step solutions. Plus, get our latest insights, tutorials, and data analysis tips straight to your inbox!
By subscribing you accept Statology's Privacy Policy.

Effective Use of Statistics in Research – Methods and Tools for Data Analysis
Remember that impending feeling you get when you are asked to analyze your data! Now that you have all the required raw data, you need to statistically prove your hypothesis. Representing your numerical data as part of statistics in research will also help in breaking the stereotype of being a biology student who can’t do math.
Statistical methods are essential for scientific research. In fact, statistical methods dominate the scientific research as they include planning, designing, collecting data, analyzing, drawing meaningful interpretation and reporting of research findings. Furthermore, the results acquired from research project are meaningless raw data unless analyzed with statistical tools. Therefore, determining statistics in research is of utmost necessity to justify research findings. In this article, we will discuss how using statistical methods for biology could help draw meaningful conclusion to analyze biological studies.
Table of Contents
Role of Statistics in Biological Research
Statistics is a branch of science that deals with collection, organization and analysis of data from the sample to the whole population. Moreover, it aids in designing a study more meticulously and also give a logical reasoning in concluding the hypothesis. Furthermore, biology study focuses on study of living organisms and their complex living pathways, which are very dynamic and cannot be explained with logical reasoning. However, statistics is more complex a field of study that defines and explains study patterns based on the sample sizes used. To be precise, statistics provides a trend in the conducted study.
Biological researchers often disregard the use of statistics in their research planning, and mainly use statistical tools at the end of their experiment. Therefore, giving rise to a complicated set of results which are not easily analyzed from statistical tools in research. Statistics in research can help a researcher approach the study in a stepwise manner, wherein the statistical analysis in research follows –
1. Establishing a Sample Size
Usually, a biological experiment starts with choosing samples and selecting the right number of repetitive experiments. Statistics in research deals with basics in statistics that provides statistical randomness and law of using large samples. Statistics teaches how choosing a sample size from a random large pool of sample helps extrapolate statistical findings and reduce experimental bias and errors.
2. Testing of Hypothesis
When conducting a statistical study with large sample pool, biological researchers must make sure that a conclusion is statistically significant. To achieve this, a researcher must create a hypothesis before examining the distribution of data. Furthermore, statistics in research helps interpret the data clustered near the mean of distributed data or spread across the distribution. These trends help analyze the sample and signify the hypothesis.
3. Data Interpretation Through Analysis
When dealing with large data, statistics in research assist in data analysis. This helps researchers to draw an effective conclusion from their experiment and observations. Concluding the study manually or from visual observation may give erroneous results; therefore, thorough statistical analysis will take into consideration all the other statistical measures and variance in the sample to provide a detailed interpretation of the data. Therefore, researchers produce a detailed and important data to support the conclusion.
Types of Statistical Research Methods That Aid in Data Analysis

Statistical analysis is the process of analyzing samples of data into patterns or trends that help researchers anticipate situations and make appropriate research conclusions. Based on the type of data, statistical analyses are of the following type:
1. Descriptive Analysis
The descriptive statistical analysis allows organizing and summarizing the large data into graphs and tables . Descriptive analysis involves various processes such as tabulation, measure of central tendency, measure of dispersion or variance, skewness measurements etc.
2. Inferential Analysis
The inferential statistical analysis allows to extrapolate the data acquired from a small sample size to the complete population. This analysis helps draw conclusions and make decisions about the whole population on the basis of sample data. It is a highly recommended statistical method for research projects that work with smaller sample size and meaning to extrapolate conclusion for large population.
3. Predictive Analysis
Predictive analysis is used to make a prediction of future events. This analysis is approached by marketing companies, insurance organizations, online service providers, data-driven marketing, and financial corporations.
4. Prescriptive Analysis
Prescriptive analysis examines data to find out what can be done next. It is widely used in business analysis for finding out the best possible outcome for a situation. It is nearly related to descriptive and predictive analysis. However, prescriptive analysis deals with giving appropriate suggestions among the available preferences.
5. Exploratory Data Analysis
EDA is generally the first step of the data analysis process that is conducted before performing any other statistical analysis technique. It completely focuses on analyzing patterns in the data to recognize potential relationships. EDA is used to discover unknown associations within data, inspect missing data from collected data and obtain maximum insights.
6. Causal Analysis
Causal analysis assists in understanding and determining the reasons behind “why” things happen in a certain way, as they appear. This analysis helps identify root cause of failures or simply find the basic reason why something could happen. For example, causal analysis is used to understand what will happen to the provided variable if another variable changes.
7. Mechanistic Analysis
This is a least common type of statistical analysis. The mechanistic analysis is used in the process of big data analytics and biological science. It uses the concept of understanding individual changes in variables that cause changes in other variables correspondingly while excluding external influences.
Important Statistical Tools In Research
Researchers in the biological field find statistical analysis in research as the scariest aspect of completing research. However, statistical tools in research can help researchers understand what to do with data and how to interpret the results, making this process as easy as possible.
1. Statistical Package for Social Science (SPSS)
It is a widely used software package for human behavior research. SPSS can compile descriptive statistics, as well as graphical depictions of result. Moreover, it includes the option to create scripts that automate analysis or carry out more advanced statistical processing.
2. R Foundation for Statistical Computing
This software package is used among human behavior research and other fields. R is a powerful tool and has a steep learning curve. However, it requires a certain level of coding. Furthermore, it comes with an active community that is engaged in building and enhancing the software and the associated plugins.
3. MATLAB (The Mathworks)
It is an analytical platform and a programming language. Researchers and engineers use this software and create their own code and help answer their research question. While MatLab can be a difficult tool to use for novices, it offers flexibility in terms of what the researcher needs.
4. Microsoft Excel
Not the best solution for statistical analysis in research, but MS Excel offers wide variety of tools for data visualization and simple statistics. It is easy to generate summary and customizable graphs and figures. MS Excel is the most accessible option for those wanting to start with statistics.
5. Statistical Analysis Software (SAS)
It is a statistical platform used in business, healthcare, and human behavior research alike. It can carry out advanced analyzes and produce publication-worthy figures, tables and charts .
6. GraphPad Prism
It is a premium software that is primarily used among biology researchers. But, it offers a range of variety to be used in various other fields. Similar to SPSS, GraphPad gives scripting option to automate analyses to carry out complex statistical calculations.
This software offers basic as well as advanced statistical tools for data analysis. However, similar to GraphPad and SPSS, minitab needs command over coding and can offer automated analyses.
Use of Statistical Tools In Research and Data Analysis
Statistical tools manage the large data. Many biological studies use large data to analyze the trends and patterns in studies. Therefore, using statistical tools becomes essential, as they manage the large data sets, making data processing more convenient.
Following these steps will help biological researchers to showcase the statistics in research in detail, and develop accurate hypothesis and use correct tools for it.
There are a range of statistical tools in research which can help researchers manage their research data and improve the outcome of their research by better interpretation of data. You could use statistics in research by understanding the research question, knowledge of statistics and your personal experience in coding.
Have you faced challenges while using statistics in research? How did you manage it? Did you use any of the statistical tools to help you with your research data? Do write to us or comment below!
Frequently Asked Questions
Statistics in research can help a researcher approach the study in a stepwise manner: 1. Establishing a sample size 2. Testing of hypothesis 3. Data interpretation through analysis
Statistical methods are essential for scientific research. In fact, statistical methods dominate the scientific research as they include planning, designing, collecting data, analyzing, drawing meaningful interpretation and reporting of research findings. Furthermore, the results acquired from research project are meaningless raw data unless analyzed with statistical tools. Therefore, determining statistics in research is of utmost necessity to justify research findings.
Statistical tools in research can help researchers understand what to do with data and how to interpret the results, making this process as easy as possible. They can manage large data sets, making data processing more convenient. A great number of tools are available to carry out statistical analysis of data like SPSS, SAS (Statistical Analysis Software), and Minitab.

nice article to read
Holistic but delineating. A very good read.
Rate this article Cancel Reply
Your email address will not be published.

Enago Academy's Most Popular Articles

- Promoting Research
- Thought Leadership
- Trending Now
How Enago Academy Contributes to Sustainable Development Goals (SDGs) Through Empowering Researchers
The United Nations Sustainable Development Goals (SDGs) are a universal call to action to end…

- Reporting Research
Research Interviews: An effective and insightful way of data collection
Research interviews play a pivotal role in collecting data for various academic, scientific, and professional…

Planning Your Data Collection: Designing methods for effective research
Planning your research is very important to obtain desirable results. In research, the relevance of…

- Language & Grammar
Best Plagiarism Checker Tool for Researchers — Top 4 to choose from!
While common writing issues like language enhancement, punctuation errors, grammatical errors, etc. can be dealt…

- Industry News
- Publishing News
2022 in a Nutshell — Reminiscing the year when opportunities were seized and feats were achieved!
It’s beginning to look a lot like success! Some of the greatest opportunities to research…
2022 in a Nutshell — Reminiscing the year when opportunities were seized and feats…

Sign-up to read more
Subscribe for free to get unrestricted access to all our resources on research writing and academic publishing including:
- 2000+ blog articles
- 50+ Webinars
- 10+ Expert podcasts
- 50+ Infographics
- 10+ Checklists
- Research Guides
We hate spam too. We promise to protect your privacy and never spam you.
I am looking for Editing/ Proofreading services for my manuscript Tentative date of next journal submission:

What would be most effective in reducing research misconduct?
- Skip to secondary menu
- Skip to main content
- Skip to primary sidebar
Statistics By Jim
Making statistics intuitive
The Importance of Statistics
By Jim Frost 51 Comments
The field of statistics is the science of learning from data. Statistical knowledge helps you use the proper methods to collect the data, employ the correct analyses, and effectively present the results. Statistics is a crucial process behind how we make discoveries in science, make decisions based on data, and make predictions. Statistics allows you to understand a subject much more deeply.

Personally, I think statistics is an exciting field about the thrill of discovery, learning, and challenging your assumptions. Statistics facilitates the creation of new knowledge. Bit by bit, we push back the frontier of what is known. To learn more about my passion for statistics as an experienced statistician, read about my experiences and challenges early in my scientific research career .
For a contrast, read about qualitative research , which uses non-numeric data and does not perform statistical analyses.
Statistics Uses Numerical Evidence to Draw Valid Conclusions
Statistics are not just numbers and facts. You know, things like 4 out of 5 dentists prefer a specific toothpaste. Instead, it’s an array of knowledge and procedures that allow you to learn from data reliably. Statistics allow you to evaluate claims based on quantitative evidence and help you differentiate between reasonable and dubious conclusions. That aspect is particularly vital these days because data are so plentiful along with interpretations presented by people with unknown motivations.
Statisticians offer critical guidance in producing trustworthy analyses and predictions. Along the way, statisticians can help investigators avoid a wide variety of analytical traps.
When analysts use statistical procedures correctly, they tend to produce accurate results. In fact, statistical analyses account for uncertainty and error in the results. Statisticians ensure that all aspects of a study follow the appropriate methods to produce trustworthy results. These methods include:
- Producing reliable data.
- Analyzing the data appropriately.
- Drawing reasonable conclusions.
Statisticians Know How to Avoid Common Pitfalls
Using statistical analyses to produce findings for a study is the culmination of a long process. This process includes constructing the study design, selecting and measuring the variables, devising the sampling technique and sample size , cleaning the data, and determining the analysis methodology among numerous other issues. In some cases, you might want to take the raw data and use it to cluster observations in similar groups by using patterns in the data to help target your research or interventions. The overall quality of the results depends on the entire chain of events. A single weak link might produce unreliable results. The following list provides a small taste of potential problems and analytical errors that can affect a study.
Accuracy and Precision : Before collecting data, you must ascertain the accuracy and precision of your measurement system. After all, if you can’t trust your data, you can’t trust the results!
Biased samples: An incorrectly drawn sample can bias the conclusions from the start. For example, if a study uses human subjects, the subjects might be different than non-subjects in a way that affects the results. See: Populations, Parameters, and Samples in Inferential Statistics .
Overgeneralization: Findings from one population might not apply to another population. Unfortunately, it’s not necessarily clear what differentiates one population from another. Statistical inferences are always limited, and you must understand the limitations.
Causality: How do you determine when X causes a change in Y? Statisticians need tight standards to assume causality whereas others accept causal relationships more easily. When A precedes B, and A is correlated with B, many mistakenly believe it is a causal connection! However, you’ll need to use an experimental design that includes random assignment to assume confidently that the results represent causality. Learn how to determine whether you’re observing causation or correlation !
Incorrect analysis: Are you analyzing a multivariate study area with only one variable? Or, using an inadequate set of variables? Perhaps you’re assessing the mean when the median might be a better ? Or, did you fit a linear relationship to data that are nonlinear ? You can use a wide range of analytical tools, but not all of them are correct for a specific situation.
Violating the assumptions for an analysis: Most statistical analyses have assumptions. These assumptions often involve properties of the sample, variables, data, and the model. Adding to the complexity, you can waive some assumptions under specific conditions—sometimes thanks to the central limit theorem . When you violate an important assumption, you risk producing misleading results.
Data mining : Even when analysts do everything else correctly, they can produce falsely significant results by investigating a dataset for too long. When analysts conduct many tests, some will be statistically significant due to chance patterns in the data. Fastidious statisticians track the number of tests performed during a study and place the results in the proper context.
Numerous considerations must be correct to produce trustworthy conclusions. Unfortunately, there are many ways to mess up analyses and produce misleading results. Statisticians can guide others through this swamp! Without these guides, you might unintentionally end up p-hacking your results .
Use Statistics to Make an Impact in Your Field
Statistical analyses are used in almost all fields to make sense of the vast amount of data that are available. Even if the field of statistics is not your primary field of study, it can help you make an impact in your chosen field. Chances are very high that you’ll need working knowledge of statistical methodology both to produce new findings in your field and to understand the work of others.
Conversely, as a statistician, there is a high demand for your skills in a wide variety of areas: universities, research labs, government, industry, etc. Furthermore, statistical careers often pay quite well. One of my favorite quotes about statistics is the following by John Tukey:
“The best thing about being a statistician is that you get to play in everyone else’s backyard.”
My interests are quite broad, and statistical knowledge provides the tools to understand all of them.
Lies, Damned Lies, and Statistics: Use Statistical Knowledge to Protect Yourself
I’m sure you’re familiar with the expression about damned lies and statistics, which was spread by Mark Twain among others. Is it true?
Unscrupulous analysts can use incorrect methodology to draw unwarranted conclusions. That long list of accidental pitfalls can quickly become a source of techniques to produce misleading analyses intentionally. But, how do you know? If you’re not familiar with statistics, these manipulations can be hard to detect. Statistical knowledge is the solution to this problem. Use it to protect yourself from manipulation and to react to information intelligently.
Learn how anecdotal evidence is the opposite of statistical methodology and how it can lead you astray!
Using statistics in a scientific study requires a lot of planning. To learn more about this process, read 5 Steps for Conducting Scientific Studies with Statistical Analyses .
The world today produces more data and more analyses designed to influence you than ever before. Are you ready for it?
If you’re learning about statistics and like the approach I use in my blog, check out my Introduction to Statistics book! It’s available at Amazon and other retailers.

Share this:

Reader Interactions

July 11, 2022 at 2:25 am
Your are Awesome Jim I like your Blog’s Thanks It’s Very Helpful for me!

July 11, 2022 at 2:33 am
Thanks so much! You’re too kind! I’m really glad my blog has been helpful too! 🙂

June 7, 2022 at 1:40 pm
Please pardon my ignorance and the possibility that I’m some sort of Philistine but I’m trying to help my teenager with statistics revision and my brain is fried. I’m not lacking in intelligence (my favourite subject is physics) but I’m struggling to see the point in the subject when I imagine that there are computer programs that one can put data into in order to find out statistics. I even typed ‘statistics for idiots’ into Google search and the results I got have made me even more confused.
June 8, 2022 at 9:02 pm
There are definitely computer programs in which you can enter the data and it’ll display some numbers. However, there is a lot more to it than that. There are many pitfalls that the untrained can fall into without realizing. Those pitfalls can completely invalidate the results. So, yes, you can enter data into statistical software, and it’ll display some results. However, garbage in –> garbage out. And there are various cases where you won’t realize it’s garbage. The analyses have various assumptions that you need to check. If you don’t check and satisfy the assumptions, you can’t trust the results. Do you know what statistical test is correct for your specific data?
Then there are all the experimental design issues before you even get to measuring data that will help ensure valid results. And, if you want to show causation, how do you do that? There’s the old and true saying that “correlation doesn’t necessarily imply causation.” So, how do you tell? How do you show causation?
Those are just a few of the possible issues. There are many others! Some I discuss in this vary blog post!
Statistics isn’t just the numbers and calculations. It’s understanding the proper methods and procedures, and how to use them correctly so you can both collect and analyze data that will answer your research questions. There’s a whole chain of events that starts during the design phase (well before data collection) and goes through to the analysis phase that needs to be just right for you to be able to trust the results you see in your statistical software. And, if your software says the results are statistically significant, what does that even mean? And not mean? There’s a lot of specialized knowledge that is required throughout that process.

March 31, 2022 at 10:55 am
Thank you so much! It would be a great help. Appreciate it!
March 27, 2022 at 6:21 am
Hello Sir. may I ask on how to ensure that the statistical tools will be used in the study are aligned with the research objectives? Thank you so much!
March 28, 2022 at 9:23 pm
That’s question that requires a very long and complex answer. I’ve written three books about that and there are many more!
However, I’ve written a post that discusses the key considerations and it’ll answer your questions: Conducting Scientific Studies with Statistical Analyses

February 2, 2022 at 3:01 pm
Pls sir, I want to ask a question, What is the importance of statistics in mass communication
February 3, 2022 at 4:03 pm
Imagine you’re communicating with many people about scientific findings. You’ll need to know how to interpret the results of a statistical study. Sometimes knowing exactly what a study is concluding and, importantly, unable to conclude is crucial. Additionally, you should understand the strength of the study. Are there any shortcomings or weaknesses that should make you question the results? By being able to read the statistical results of the study and having a full awareness of the implications of the study’s design, you’ll be better able to present only the credible results to your audience and able to convey them accurately without either incorrectly exaggerating or diminishing their importance beyond their true value.

September 20, 2021 at 12:37 pm
What is statistics and the Importance sir please this is an assignment given to me thank you sir.
September 20, 2021 at 3:49 pm
You’re in the right place. Read this article to answer your questions. There’s no reason for me to retype what I’ve already written in the article in the comments sections! It’s all there!

February 5, 2021 at 3:22 am
Hello sir Jim, your articles is very interesting and very much helpful.
Knowing about statistics sir, I have personal question: How do you apply statistics in the research process?
February 5, 2021 at 9:58 pm
I happen to have written a blog post exactly about that topic! 5 Steps for Conducting Studies with Statistics
Please read that post and if you have more specific questions about a part of the process, you can post them there.
Thanks for writing!

December 1, 2020 at 4:16 am
what year was this made? im planning to use it as a reference to my paper
December 1, 2020 at 11:39 pm
Hi Saegiru,
For online resources, you typically don’t use the publication data because it can change over time. Instead, you generally use the data you accessed the URL. Perdue University’s Online Writing Lab (OWL) has a great web page for how to reference websites and URLs . Please see their guidelines.

November 6, 2020 at 6:18 am
THANK YOU FOR THIS ‘VERY HELPFUL’

September 27, 2020 at 11:38 am
When are ur articles publisehd?
September 28, 2020 at 2:16 pm
I post new articles every 2-4 weeks. You can subscribe to receive an email every time I post a new article. Look in the right side bar, partway down for the place to enter your email address. I do not send spam or sell your email.

August 7, 2020 at 11:06 am
Jim. What a champion you are. Than you so much. May God Bless.

June 15, 2020 at 7:02 pm
Achei incrível, maravilhoso texto!!! Trabalhar com estatística, a Bioestatística em particular é desafiador.
June 15, 2020 at 10:24 pm
Obrigado! Estou feliz que meu site seja útil!

June 13, 2020 at 5:30 am
I’m really grateful for this explanation. You clarified everything, more knowledge I pray.

March 2, 2020 at 1:44 pm
Thank you sir ,for your selfless services,your text really help me. more knowledge I pray 🙏.

February 16, 2020 at 7:18 pm
Thanks a lot, Jim. I found very useful, your article in the preparation of my research work. I highly appreciate your work.

December 7, 2019 at 2:57 pm
Hi Jim, I am elated to run into your website. You clearly explain confusing subjects. As I have decided to embark on learning data science, statistics is the number one area that pops up in every online course. I am curious of your perspective on how linear regression machine learning algorithms differs from the linear regression in statistics. I would love your explanation to draw the connection between the two. Moreover, it would be so amazing if you could educate on all of these algorithms. We need SMEs like yourself to talk in layman’s terms. Thank you!

November 17, 2019 at 11:25 pm
And the year this article was published is when sir? Or the date published. Thank you
November 18, 2019 at 11:28 am
Hello Najihah,
To cite this page as a reference, please see the Electronic Sources guidelines from Purdue University. Look in the “A Page on a Website” section. Typically, you use the access date. For this post, you can use the following citation (change the date as needed):
Frost, Jim. “The Importance of Statistics” Statistics By Jim , https://statisticsbyjim.com/basics/importance-statistics/ . Accessed 18 November 2019.

November 11, 2019 at 8:31 am
Thank you sir for your well explained notes. This one has really helped me a lot to complete my assignment

October 2, 2019 at 4:10 am
Please can you help me in writing a reference to your article?
October 2, 2019 at 5:09 pm
For this type of request, I always refer people to Purdue’s excellent resource about citing electronic sources. This first section on their web page is titled “Webpage or Piece of Online Content” and has several examples that you can use.
Purdue’s Reference List: Electronic Sources
For the author’s name (mine), you can use “Frost, J.”

September 7, 2019 at 9:16 am
how does statistics widen the scope of knowledge

June 18, 2019 at 6:08 am
Thanks for the information, it’s quite interesting.

May 15, 2019 at 4:23 am
i found your article is so usefull for me writing my thesis. may I know when you wrote this article?
May 17, 2019 at 10:30 am
Hi Geovani,
Thank you and I’m glad that you found the article to be helpful! I’m not sure exactly when I wrote it. It goes back quite a ways. However, to reference a webpage, you really need the retrieved from URL date because webpages can change overtime. Read here to learn How to cite a website .
Best of luck with your thesis!

April 30, 2019 at 7:22 am
I have found your article very informative and interesting. I appreciate your points of view and I agree with so many. You’ve done a great job with making this clear enough for anyone to understand.
April 30, 2019 at 11:07 pm
Thank you so much, Steav! I really appreciate that!

March 28, 2019 at 2:13 am
In social science, statistics cover all the jobs which is necessary in social sciences for planning, estimating,working, facilitating and most important point is that through statistics all information, observation and data are collected into a single page.

December 6, 2018 at 10:26 am
what is your thought about the importance of statistics in social science?

December 1, 2018 at 11:05 pm
I have a baseball data sets with 30 independent variables. In this data set, I have one variable which is a combination of the summation 3 variables from the data set. For example, x8=x3+x4+x5. I need to build a multiple linear regression model, if i include x8 in my model should i remove x3,x4,x5. Could you please advise with this
December 2, 2018 at 12:35 am
Yes, you should remove those variables!

October 23, 2018 at 2:07 pm
thanks for sharing your knowledge with us thankss you sir

September 15, 2018 at 4:20 am
My notes on statistics are incomplete because I don’t know the importance of statistics .but u help me a lot in completing my notes .thanku so much sir
September 15, 2018 at 4:17 pm
You’re super welcome! I’m glad it was helpful!

June 27, 2018 at 12:26 pm
its really awesome as it helped me a lot in completing my class 11 notes thank you sir thank you very much for such a wonderful explanation
June 27, 2018 at 2:30 pm
Hi Cera, It makes me happy to hear that my website helped you! Best of luck with your studies!

March 21, 2018 at 1:56 am
Hi,very well explain in simple language , I expect more blogs from you’r side. especially ,how much sample is required for particular analysis and what are criteria should be consider before collecting the sample.
Thank you.Jim..
March 21, 2018 at 1:49 pm
Hi Gopala, I’m very happy to hear that you’re finding my blogs to helpful! I have just written one about determining a good sample size ! I think you’ll find that one to be helpful too.

March 14, 2018 at 6:53 am
Hi. Thanks for posting this. This really helped me with my research for the upcoming quiz.
March 14, 2018 at 11:02 am
Hi Madison, you’re very welcome! I’m glad it helped!

December 11, 2017 at 1:46 am
1. The hanging comma (the second one in “Lies, Damned Lies, and Statistics”) gives this a totally different sense.
2. We are in the age of information quality. This is beyond traditional statistics. See https://www.facebook.com/infoQbook/
December 11, 2017 at 2:06 am
Hi Ron, thanks for you thoughtful comment.
The full expression is: “There are three kinds of lies: lies, damned lies, and statistics.” And, the Wikipedia article includes the final comma. I believe it accurately reflects the intention of the quote that statistics are worse than both lies and damn lies!
I’d argue that the field of statistics is very concerned about the quality of the information that goes into analyses. However, it looks like you and your book are taking it to another level. Congratulations!
Comments and Questions Cancel reply
Have a language expert improve your writing
Run a free plagiarism check in 10 minutes, generate accurate citations for free.
- Knowledge Base
The Beginner's Guide to Statistical Analysis | 5 Steps & Examples
Statistical analysis means investigating trends, patterns, and relationships using quantitative data . It is an important research tool used by scientists, governments, businesses, and other organizations.
To draw valid conclusions, statistical analysis requires careful planning from the very start of the research process . You need to specify your hypotheses and make decisions about your research design, sample size, and sampling procedure.
After collecting data from your sample, you can organize and summarize the data using descriptive statistics . Then, you can use inferential statistics to formally test hypotheses and make estimates about the population. Finally, you can interpret and generalize your findings.
This article is a practical introduction to statistical analysis for students and researchers. We’ll walk you through the steps using two research examples. The first investigates a potential cause-and-effect relationship, while the second investigates a potential correlation between variables.
Table of contents
Step 1: write your hypotheses and plan your research design, step 2: collect data from a sample, step 3: summarize your data with descriptive statistics, step 4: test hypotheses or make estimates with inferential statistics, step 5: interpret your results, other interesting articles.
To collect valid data for statistical analysis, you first need to specify your hypotheses and plan out your research design.
Writing statistical hypotheses
The goal of research is often to investigate a relationship between variables within a population . You start with a prediction, and use statistical analysis to test that prediction.
A statistical hypothesis is a formal way of writing a prediction about a population. Every research prediction is rephrased into null and alternative hypotheses that can be tested using sample data.
While the null hypothesis always predicts no effect or no relationship between variables, the alternative hypothesis states your research prediction of an effect or relationship.
- Null hypothesis: A 5-minute meditation exercise will have no effect on math test scores in teenagers.
- Alternative hypothesis: A 5-minute meditation exercise will improve math test scores in teenagers.
- Null hypothesis: Parental income and GPA have no relationship with each other in college students.
- Alternative hypothesis: Parental income and GPA are positively correlated in college students.
Planning your research design
A research design is your overall strategy for data collection and analysis. It determines the statistical tests you can use to test your hypothesis later on.
First, decide whether your research will use a descriptive, correlational, or experimental design. Experiments directly influence variables, whereas descriptive and correlational studies only measure variables.
- In an experimental design , you can assess a cause-and-effect relationship (e.g., the effect of meditation on test scores) using statistical tests of comparison or regression.
- In a correlational design , you can explore relationships between variables (e.g., parental income and GPA) without any assumption of causality using correlation coefficients and significance tests.
- In a descriptive design , you can study the characteristics of a population or phenomenon (e.g., the prevalence of anxiety in U.S. college students) using statistical tests to draw inferences from sample data.
Your research design also concerns whether you’ll compare participants at the group level or individual level, or both.
- In a between-subjects design , you compare the group-level outcomes of participants who have been exposed to different treatments (e.g., those who performed a meditation exercise vs those who didn’t).
- In a within-subjects design , you compare repeated measures from participants who have participated in all treatments of a study (e.g., scores from before and after performing a meditation exercise).
- In a mixed (factorial) design , one variable is altered between subjects and another is altered within subjects (e.g., pretest and posttest scores from participants who either did or didn’t do a meditation exercise).
- Experimental
- Correlational
First, you’ll take baseline test scores from participants. Then, your participants will undergo a 5-minute meditation exercise. Finally, you’ll record participants’ scores from a second math test.
In this experiment, the independent variable is the 5-minute meditation exercise, and the dependent variable is the math test score from before and after the intervention. Example: Correlational research design In a correlational study, you test whether there is a relationship between parental income and GPA in graduating college students. To collect your data, you will ask participants to fill in a survey and self-report their parents’ incomes and their own GPA.
Measuring variables
When planning a research design, you should operationalize your variables and decide exactly how you will measure them.
For statistical analysis, it’s important to consider the level of measurement of your variables, which tells you what kind of data they contain:
- Categorical data represents groupings. These may be nominal (e.g., gender) or ordinal (e.g. level of language ability).
- Quantitative data represents amounts. These may be on an interval scale (e.g. test score) or a ratio scale (e.g. age).
Many variables can be measured at different levels of precision. For example, age data can be quantitative (8 years old) or categorical (young). If a variable is coded numerically (e.g., level of agreement from 1–5), it doesn’t automatically mean that it’s quantitative instead of categorical.
Identifying the measurement level is important for choosing appropriate statistics and hypothesis tests. For example, you can calculate a mean score with quantitative data, but not with categorical data.
In a research study, along with measures of your variables of interest, you’ll often collect data on relevant participant characteristics.
| Variable | Type of data |
|---|---|
| Age | Quantitative (ratio) |
| Gender | Categorical (nominal) |
| Race or ethnicity | Categorical (nominal) |
| Baseline test scores | Quantitative (interval) |
| Final test scores | Quantitative (interval) |
| Parental income | Quantitative (ratio) |
|---|---|
| GPA | Quantitative (interval) |
Prevent plagiarism. Run a free check.

In most cases, it’s too difficult or expensive to collect data from every member of the population you’re interested in studying. Instead, you’ll collect data from a sample.
Statistical analysis allows you to apply your findings beyond your own sample as long as you use appropriate sampling procedures . You should aim for a sample that is representative of the population.
Sampling for statistical analysis
There are two main approaches to selecting a sample.
- Probability sampling: every member of the population has a chance of being selected for the study through random selection.
- Non-probability sampling: some members of the population are more likely than others to be selected for the study because of criteria such as convenience or voluntary self-selection.
In theory, for highly generalizable findings, you should use a probability sampling method. Random selection reduces several types of research bias , like sampling bias , and ensures that data from your sample is actually typical of the population. Parametric tests can be used to make strong statistical inferences when data are collected using probability sampling.
But in practice, it’s rarely possible to gather the ideal sample. While non-probability samples are more likely to at risk for biases like self-selection bias , they are much easier to recruit and collect data from. Non-parametric tests are more appropriate for non-probability samples, but they result in weaker inferences about the population.
If you want to use parametric tests for non-probability samples, you have to make the case that:
- your sample is representative of the population you’re generalizing your findings to.
- your sample lacks systematic bias.
Keep in mind that external validity means that you can only generalize your conclusions to others who share the characteristics of your sample. For instance, results from Western, Educated, Industrialized, Rich and Democratic samples (e.g., college students in the US) aren’t automatically applicable to all non-WEIRD populations.
If you apply parametric tests to data from non-probability samples, be sure to elaborate on the limitations of how far your results can be generalized in your discussion section .
Create an appropriate sampling procedure
Based on the resources available for your research, decide on how you’ll recruit participants.
- Will you have resources to advertise your study widely, including outside of your university setting?
- Will you have the means to recruit a diverse sample that represents a broad population?
- Do you have time to contact and follow up with members of hard-to-reach groups?
Your participants are self-selected by their schools. Although you’re using a non-probability sample, you aim for a diverse and representative sample. Example: Sampling (correlational study) Your main population of interest is male college students in the US. Using social media advertising, you recruit senior-year male college students from a smaller subpopulation: seven universities in the Boston area.
Calculate sufficient sample size
Before recruiting participants, decide on your sample size either by looking at other studies in your field or using statistics. A sample that’s too small may be unrepresentative of the sample, while a sample that’s too large will be more costly than necessary.
There are many sample size calculators online. Different formulas are used depending on whether you have subgroups or how rigorous your study should be (e.g., in clinical research). As a rule of thumb, a minimum of 30 units or more per subgroup is necessary.
To use these calculators, you have to understand and input these key components:
- Significance level (alpha): the risk of rejecting a true null hypothesis that you are willing to take, usually set at 5%.
- Statistical power : the probability of your study detecting an effect of a certain size if there is one, usually 80% or higher.
- Expected effect size : a standardized indication of how large the expected result of your study will be, usually based on other similar studies.
- Population standard deviation: an estimate of the population parameter based on a previous study or a pilot study of your own.
Once you’ve collected all of your data, you can inspect them and calculate descriptive statistics that summarize them.
Inspect your data
There are various ways to inspect your data, including the following:
- Organizing data from each variable in frequency distribution tables .
- Displaying data from a key variable in a bar chart to view the distribution of responses.
- Visualizing the relationship between two variables using a scatter plot .
By visualizing your data in tables and graphs, you can assess whether your data follow a skewed or normal distribution and whether there are any outliers or missing data.
A normal distribution means that your data are symmetrically distributed around a center where most values lie, with the values tapering off at the tail ends.

In contrast, a skewed distribution is asymmetric and has more values on one end than the other. The shape of the distribution is important to keep in mind because only some descriptive statistics should be used with skewed distributions.
Extreme outliers can also produce misleading statistics, so you may need a systematic approach to dealing with these values.
Calculate measures of central tendency
Measures of central tendency describe where most of the values in a data set lie. Three main measures of central tendency are often reported:
- Mode : the most popular response or value in the data set.
- Median : the value in the exact middle of the data set when ordered from low to high.
- Mean : the sum of all values divided by the number of values.
However, depending on the shape of the distribution and level of measurement, only one or two of these measures may be appropriate. For example, many demographic characteristics can only be described using the mode or proportions, while a variable like reaction time may not have a mode at all.
Calculate measures of variability
Measures of variability tell you how spread out the values in a data set are. Four main measures of variability are often reported:
- Range : the highest value minus the lowest value of the data set.
- Interquartile range : the range of the middle half of the data set.
- Standard deviation : the average distance between each value in your data set and the mean.
- Variance : the square of the standard deviation.
Once again, the shape of the distribution and level of measurement should guide your choice of variability statistics. The interquartile range is the best measure for skewed distributions, while standard deviation and variance provide the best information for normal distributions.
Using your table, you should check whether the units of the descriptive statistics are comparable for pretest and posttest scores. For example, are the variance levels similar across the groups? Are there any extreme values? If there are, you may need to identify and remove extreme outliers in your data set or transform your data before performing a statistical test.
| Pretest scores | Posttest scores | |
|---|---|---|
| Mean | 68.44 | 75.25 |
| Standard deviation | 9.43 | 9.88 |
| Variance | 88.96 | 97.96 |
| Range | 36.25 | 45.12 |
| 30 | ||
From this table, we can see that the mean score increased after the meditation exercise, and the variances of the two scores are comparable. Next, we can perform a statistical test to find out if this improvement in test scores is statistically significant in the population. Example: Descriptive statistics (correlational study) After collecting data from 653 students, you tabulate descriptive statistics for annual parental income and GPA.
It’s important to check whether you have a broad range of data points. If you don’t, your data may be skewed towards some groups more than others (e.g., high academic achievers), and only limited inferences can be made about a relationship.
| Parental income (USD) | GPA | |
|---|---|---|
| Mean | 62,100 | 3.12 |
| Standard deviation | 15,000 | 0.45 |
| Variance | 225,000,000 | 0.16 |
| Range | 8,000–378,000 | 2.64–4.00 |
| 653 | ||
A number that describes a sample is called a statistic , while a number describing a population is called a parameter . Using inferential statistics , you can make conclusions about population parameters based on sample statistics.
Researchers often use two main methods (simultaneously) to make inferences in statistics.
- Estimation: calculating population parameters based on sample statistics.
- Hypothesis testing: a formal process for testing research predictions about the population using samples.
You can make two types of estimates of population parameters from sample statistics:
- A point estimate : a value that represents your best guess of the exact parameter.
- An interval estimate : a range of values that represent your best guess of where the parameter lies.
If your aim is to infer and report population characteristics from sample data, it’s best to use both point and interval estimates in your paper.
You can consider a sample statistic a point estimate for the population parameter when you have a representative sample (e.g., in a wide public opinion poll, the proportion of a sample that supports the current government is taken as the population proportion of government supporters).
There’s always error involved in estimation, so you should also provide a confidence interval as an interval estimate to show the variability around a point estimate.
A confidence interval uses the standard error and the z score from the standard normal distribution to convey where you’d generally expect to find the population parameter most of the time.
Hypothesis testing
Using data from a sample, you can test hypotheses about relationships between variables in the population. Hypothesis testing starts with the assumption that the null hypothesis is true in the population, and you use statistical tests to assess whether the null hypothesis can be rejected or not.
Statistical tests determine where your sample data would lie on an expected distribution of sample data if the null hypothesis were true. These tests give two main outputs:
- A test statistic tells you how much your data differs from the null hypothesis of the test.
- A p value tells you the likelihood of obtaining your results if the null hypothesis is actually true in the population.
Statistical tests come in three main varieties:
- Comparison tests assess group differences in outcomes.
- Regression tests assess cause-and-effect relationships between variables.
- Correlation tests assess relationships between variables without assuming causation.
Your choice of statistical test depends on your research questions, research design, sampling method, and data characteristics.
Parametric tests
Parametric tests make powerful inferences about the population based on sample data. But to use them, some assumptions must be met, and only some types of variables can be used. If your data violate these assumptions, you can perform appropriate data transformations or use alternative non-parametric tests instead.
A regression models the extent to which changes in a predictor variable results in changes in outcome variable(s).
- A simple linear regression includes one predictor variable and one outcome variable.
- A multiple linear regression includes two or more predictor variables and one outcome variable.
Comparison tests usually compare the means of groups. These may be the means of different groups within a sample (e.g., a treatment and control group), the means of one sample group taken at different times (e.g., pretest and posttest scores), or a sample mean and a population mean.
- A t test is for exactly 1 or 2 groups when the sample is small (30 or less).
- A z test is for exactly 1 or 2 groups when the sample is large.
- An ANOVA is for 3 or more groups.
The z and t tests have subtypes based on the number and types of samples and the hypotheses:
- If you have only one sample that you want to compare to a population mean, use a one-sample test .
- If you have paired measurements (within-subjects design), use a dependent (paired) samples test .
- If you have completely separate measurements from two unmatched groups (between-subjects design), use an independent (unpaired) samples test .
- If you expect a difference between groups in a specific direction, use a one-tailed test .
- If you don’t have any expectations for the direction of a difference between groups, use a two-tailed test .
The only parametric correlation test is Pearson’s r . The correlation coefficient ( r ) tells you the strength of a linear relationship between two quantitative variables.
However, to test whether the correlation in the sample is strong enough to be important in the population, you also need to perform a significance test of the correlation coefficient, usually a t test, to obtain a p value. This test uses your sample size to calculate how much the correlation coefficient differs from zero in the population.
You use a dependent-samples, one-tailed t test to assess whether the meditation exercise significantly improved math test scores. The test gives you:
- a t value (test statistic) of 3.00
- a p value of 0.0028
Although Pearson’s r is a test statistic, it doesn’t tell you anything about how significant the correlation is in the population. You also need to test whether this sample correlation coefficient is large enough to demonstrate a correlation in the population.
A t test can also determine how significantly a correlation coefficient differs from zero based on sample size. Since you expect a positive correlation between parental income and GPA, you use a one-sample, one-tailed t test. The t test gives you:
- a t value of 3.08
- a p value of 0.001
The final step of statistical analysis is interpreting your results.
Statistical significance
In hypothesis testing, statistical significance is the main criterion for forming conclusions. You compare your p value to a set significance level (usually 0.05) to decide whether your results are statistically significant or non-significant.
Statistically significant results are considered unlikely to have arisen solely due to chance. There is only a very low chance of such a result occurring if the null hypothesis is true in the population.
This means that you believe the meditation intervention, rather than random factors, directly caused the increase in test scores. Example: Interpret your results (correlational study) You compare your p value of 0.001 to your significance threshold of 0.05. With a p value under this threshold, you can reject the null hypothesis. This indicates a statistically significant correlation between parental income and GPA in male college students.
Note that correlation doesn’t always mean causation, because there are often many underlying factors contributing to a complex variable like GPA. Even if one variable is related to another, this may be because of a third variable influencing both of them, or indirect links between the two variables.
Effect size
A statistically significant result doesn’t necessarily mean that there are important real life applications or clinical outcomes for a finding.
In contrast, the effect size indicates the practical significance of your results. It’s important to report effect sizes along with your inferential statistics for a complete picture of your results. You should also report interval estimates of effect sizes if you’re writing an APA style paper .
With a Cohen’s d of 0.72, there’s medium to high practical significance to your finding that the meditation exercise improved test scores. Example: Effect size (correlational study) To determine the effect size of the correlation coefficient, you compare your Pearson’s r value to Cohen’s effect size criteria.
Decision errors
Type I and Type II errors are mistakes made in research conclusions. A Type I error means rejecting the null hypothesis when it’s actually true, while a Type II error means failing to reject the null hypothesis when it’s false.
You can aim to minimize the risk of these errors by selecting an optimal significance level and ensuring high power . However, there’s a trade-off between the two errors, so a fine balance is necessary.
Frequentist versus Bayesian statistics
Traditionally, frequentist statistics emphasizes null hypothesis significance testing and always starts with the assumption of a true null hypothesis.
However, Bayesian statistics has grown in popularity as an alternative approach in the last few decades. In this approach, you use previous research to continually update your hypotheses based on your expectations and observations.
Bayes factor compares the relative strength of evidence for the null versus the alternative hypothesis rather than making a conclusion about rejecting the null hypothesis or not.
If you want to know more about statistics , methodology , or research bias , make sure to check out some of our other articles with explanations and examples.
- Student’s t -distribution
- Normal distribution
- Null and Alternative Hypotheses
- Chi square tests
- Confidence interval
Methodology
- Cluster sampling
- Stratified sampling
- Data cleansing
- Reproducibility vs Replicability
- Peer review
- Likert scale
Research bias
- Implicit bias
- Framing effect
- Cognitive bias
- Placebo effect
- Hawthorne effect
- Hostile attribution bias
- Affect heuristic
Is this article helpful?
Other students also liked.
- Descriptive Statistics | Definitions, Types, Examples
- Inferential Statistics | An Easy Introduction & Examples
- Choosing the Right Statistical Test | Types & Examples
More interesting articles
- Akaike Information Criterion | When & How to Use It (Example)
- An Easy Introduction to Statistical Significance (With Examples)
- An Introduction to t Tests | Definitions, Formula and Examples
- ANOVA in R | A Complete Step-by-Step Guide with Examples
- Central Limit Theorem | Formula, Definition & Examples
- Central Tendency | Understanding the Mean, Median & Mode
- Chi-Square (Χ²) Distributions | Definition & Examples
- Chi-Square (Χ²) Table | Examples & Downloadable Table
- Chi-Square (Χ²) Tests | Types, Formula & Examples
- Chi-Square Goodness of Fit Test | Formula, Guide & Examples
- Chi-Square Test of Independence | Formula, Guide & Examples
- Coefficient of Determination (R²) | Calculation & Interpretation
- Correlation Coefficient | Types, Formulas & Examples
- Frequency Distribution | Tables, Types & Examples
- How to Calculate Standard Deviation (Guide) | Calculator & Examples
- How to Calculate Variance | Calculator, Analysis & Examples
- How to Find Degrees of Freedom | Definition & Formula
- How to Find Interquartile Range (IQR) | Calculator & Examples
- How to Find Outliers | 4 Ways with Examples & Explanation
- How to Find the Geometric Mean | Calculator & Formula
- How to Find the Mean | Definition, Examples & Calculator
- How to Find the Median | Definition, Examples & Calculator
- How to Find the Mode | Definition, Examples & Calculator
- How to Find the Range of a Data Set | Calculator & Formula
- Hypothesis Testing | A Step-by-Step Guide with Easy Examples
- Interval Data and How to Analyze It | Definitions & Examples
- Levels of Measurement | Nominal, Ordinal, Interval and Ratio
- Linear Regression in R | A Step-by-Step Guide & Examples
- Missing Data | Types, Explanation, & Imputation
- Multiple Linear Regression | A Quick Guide (Examples)
- Nominal Data | Definition, Examples, Data Collection & Analysis
- Normal Distribution | Examples, Formulas, & Uses
- Null and Alternative Hypotheses | Definitions & Examples
- One-way ANOVA | When and How to Use It (With Examples)
- Ordinal Data | Definition, Examples, Data Collection & Analysis
- Parameter vs Statistic | Definitions, Differences & Examples
- Pearson Correlation Coefficient (r) | Guide & Examples
- Poisson Distributions | Definition, Formula & Examples
- Probability Distribution | Formula, Types, & Examples
- Quartiles & Quantiles | Calculation, Definition & Interpretation
- Ratio Scales | Definition, Examples, & Data Analysis
- Simple Linear Regression | An Easy Introduction & Examples
- Skewness | Definition, Examples & Formula
- Statistical Power and Why It Matters | A Simple Introduction
- Student's t Table (Free Download) | Guide & Examples
- T-distribution: What it is and how to use it
- Test statistics | Definition, Interpretation, and Examples
- The Standard Normal Distribution | Calculator, Examples & Uses
- Two-Way ANOVA | Examples & When To Use It
- Type I & Type II Errors | Differences, Examples, Visualizations
- Understanding Confidence Intervals | Easy Examples & Formulas
- Understanding P values | Definition and Examples
- Variability | Calculating Range, IQR, Variance, Standard Deviation
- What is Effect Size and Why Does It Matter? (Examples)
- What Is Kurtosis? | Definition, Examples & Formula
- What Is Standard Error? | How to Calculate (Guide with Examples)
What is your plagiarism score?
Skip to main content
- SAS Viya Platform
- Capabilities
- Why SAS Viya?
- Move to SAS Viya
- Artificial Intelligence
- Risk Management
- All Products & Solutions
- Public Sector
- Life Sciences
- Retail & Consumer Goods
- All Industries
- Contracting with SAS
- Customer Stories
- Generative AI
Why Learn SAS?
Demand for SAS skills is growing. Advance your career and train your team in sought after skills
- Train My Team
- Course Catalog
- Free Training
- My Training
- Academic Programs
- Free Academic Software
- Certification
- Choose a Credential
- Why get certified?
- Exam Preparation
- My Certification
- Communities
- Ask the Expert
- All Webinars
- Video Tutorials
- YouTube Channel
- SAS Programming
- Statistical Procedures
- New SAS Users
- Administrators
- All Communities
- Documentation
- Installation & Configuration
- SAS Viya Administration
- SAS Viya Programming
- System Requirements
- All Documentation
- Support & Services
- Knowledge Base
- Starter Kit
- Support by Product
- Support Services
- All Support & Services
- User Groups
- Partner Program
- Find a Partner
- Sign Into PartnerNet
Learn why SAS is the world's most trusted analytics platform, and why analysts, customers and industry experts love SAS.
Learn more about SAS
- Annual Report
- Vision & Mission
- Office Locations
- Internships
- Search Jobs
- News & Events
- Newsletters
- Trust Center
- support.sas.com
- documentation.sas.com
- blogs.sas.com
- communities.sas.com
- developer.sas.com
Select Your Region
Middle East & Africa
Asia Pacific
- Canada (English)
- Canada (Français)
- United States
- Česká Republika
- Deutschland
- Schweiz (Deutsch)
- Suisse (Français)
- United Kingdom
- Middle East
- Saudi Arabia
- South Africa
- New Zealand
- Philippines
- Thailand (English)
- ประเทศไทย (ภาษาไทย)
- Worldwide Sites
Create Profile
Get access to My SAS, trials, communities and more.
Edit Profile

Statistical Analysis
Look around you. statistics are everywhere..
The field of statistics touches our lives in many ways. From the daily routines in our homes to the business of making the greatest cities run, the effects of statistics are everywhere.
Statistical Analysis Defined
What is statistical analysis? It’s the science of collecting, exploring and presenting large amounts of data to discover underlying patterns and trends. Statistics are applied every day – in research, industry and government – to become more scientific about decisions that need to be made. For example:
- Manufacturers use statistics to weave quality into beautiful fabrics, to bring lift to the airline industry and to help guitarists make beautiful music.
- Researchers keep children healthy by using statistics to analyze data from the production of viral vaccines, which ensures consistency and safety.
- Communication companies use statistics to optimize network resources, improve service and reduce customer churn by gaining greater insight into subscriber requirements.
- Government agencies around the world rely on statistics for a clear understanding of their countries, their businesses and their people.
Look around you. From the tube of toothpaste in your bathroom to the planes flying overhead, you see hundreds of products and processes every day that have been improved through the use of statistics.

Analytics Insights
Connect with the latest insights on analytics through related articles and research., more on statistical analysis.
- What are the next big trends in statistics?
- Why should students study statistics?
- Celebrating statisticians: W. Edwards Deming
- Statistics: The language of science
Statistics is so unique because it can go from health outcomes research to marketing analysis to the longevity of a light bulb. It’s a fun field because you really can do so many different things with it.
Besa Smith President and Senior Scientist Analydata
Statistical Computing
Traditional methods for statistical analysis – from sampling data to interpreting results – have been used by scientists for thousands of years. But today’s data volumes make statistics ever more valuable and powerful. Affordable storage, powerful computers and advanced algorithms have all led to an increased use of computational statistics.
Whether you are working with large data volumes or running multiple permutations of your calculations, statistical computing has become essential for today’s statistician. Popular statistical computing practices include:
- Statistical programming – From traditional analysis of variance and linear regression to exact methods and statistical visualization techniques, statistical programming is essential for making data-based decisions in every field.
- Econometrics – Modeling, forecasting and simulating business processes for improved strategic and tactical planning. This method applies statistics to economics to forecast future trends.
- Operations research – Identify the actions that will produce the best results – based on many possible options and outcomes. Scheduling, simulation, and related modeling processes are used to optimize business processes and management challenges.
- Matrix programming – Powerful computer techniques for implementing your own statistical methods and exploratory data analysis using row operation algorithms.
- Statistical quality improvement – A mathematical approach to reviewing the quality and safety characteristics for all aspects of production.

Careers in Statistical Analysis
With everyone from The New York Times to Google’s Chief Economist Hal Varien proclaiming statistics to be the latest hot career field, who are we to argue? But why is there so much talk about careers in statistical analysis and data science? It could be the shortage of trained analytical thinkers. Or it could be the demand for managing the latest big data strains. Or, maybe it’s the excitement of applying mathematical concepts to make a difference in the world.
If you talk to statisticians about what first interested them in statistical analysis, you’ll hear a lot of stories about collecting baseball cards as a child. Or applying statistics to win more games of Axis and Allies. It is often these early passions that lead statisticians into the field. As adults, those passions can carry over into the workforce as a love of analysis and reasoning, where their passions are applied to everything from the influence of friends on purchase decisions to the study of endangered species around the world.
Learn more about current and historical statisticians:
- Ask a statistician videos cover current uses and future trends in statistics.
- SAS loves stats profiles statisticians working at SAS.
- Celebrating statisticians commemorates statistics practitioners from history.
Statistics Procedures Community
Join our statistics procedures community, where you can ask questions and share your experiences with SAS statistical products. SAS Statistical Procedures
Statistical Analysis Resources
- Statistics training
- Statistical analytics tutorials
- Statistics and operations research news
- SAS ® statistics products
Want more insights?

Risk & Fraud
Discover new insights on risk and fraud through research, related articles and much more..

Get more insights on big data including articles, research and other hot topics.

Explore insights from marketing movers and shakers on a variety of timely topics.
Learn more about sas products and solutions.

The Best PhD and Masters Consulting Company

Introduction to Statistical Analysis: A Beginner’s Guide.
Statistical analysis is a crucial component of research work across various disciplines, helping researchers derive meaningful insights from data. Whether you’re conducting scientific studies, social research, or data-driven investigations, having a solid understanding of statistical analysis is essential. In this beginner’s guide, we will explore the fundamental concepts and techniques of statistical analysis specifically tailored for research work, providing you with a strong foundation to enhance the quality and credibility of your research findings.
1. Importance of Statistical Analysis in Research:
Research aims to uncover knowledge and make informed conclusions. Statistical analysis plays a pivotal role in achieving this by providing tools and methods to analyze and interpret data accurately. It helps researchers identify patterns, test hypotheses, draw inferences, and quantify the strength of relationships between variables. Understanding the significance of statistical analysis empowers researchers to make evidence-based decisions.
2. Data Collection and Organization:
Before diving into statistical analysis, researchers must collect and organize their data effectively. We will discuss the importance of proper sampling techniques, data quality assurance, and data preprocessing. Additionally, we will explore methods to handle missing data and outliers, ensuring that your dataset is reliable and suitable for analysis.
3. Exploratory Data Analysis (EDA):
Exploratory Data Analysis is a preliminary step that involves visually exploring and summarizing the main characteristics of the data. We will cover techniques such as data visualization, descriptive statistics, and data transformations to gain insights into the distribution, central tendencies, and variability of the variables in your dataset. EDA helps researchers understand the underlying structure of the data and identify potential relationships for further investigation.
4. Statistical Inference and Hypothesis Testing:
Statistical inference allows researchers to make generalizations about a population based on a sample. We will delve into hypothesis testing, covering concepts such as null and alternative hypotheses, p-values, and significance levels. By understanding these concepts, you will be able to test your research hypotheses and determine if the observed results are statistically significant.
5. Parametric and Non-parametric Tests:
Parametric and non-parametric tests are statistical techniques used to analyze data based on different assumptions about the underlying population distribution. We will explore commonly used parametric tests, such as t-tests and analysis of variance (ANOVA), as well as non-parametric tests like the Mann-Whitney U test and Kruskal-Wallis test. Understanding when to use each type of test is crucial for selecting the appropriate analysis method for your research questions.
6. Correlation and Regression Analysis:
Correlation and regression analysis allow researchers to explore relationships between variables and make predictions. We will cover Pearson correlation coefficients, multiple regression analysis, and logistic regression. These techniques enable researchers to quantify the strength and direction of associations and identify predictive factors in their research.
7. Sample Size Determination and Power Analysis:
Sample size determination is a critical aspect of research design, as it affects the validity and reliability of your findings. We will discuss methods for estimating sample size based on statistical power analysis, ensuring that your study has sufficient statistical power to detect meaningful effects. Understanding sample size determination is essential for planning robust research studies.
Conclusion:
Statistical analysis is an indispensable tool for conducting high-quality research. This beginner’s guide has provided an overview of key concepts and techniques specifically tailored for research work, enabling you to enhance the credibility and reliability of your findings. By understanding the importance of statistical analysis, collecting and organizing data effectively, performing exploratory data analysis, conducting hypothesis testing, utilizing parametric and non-parametric tests, and considering sample size determination, you will be well-equipped to carry out rigorous research and contribute valuable insights to your field. Remember, continuous learning, practice, and seeking guidance from statistical experts will further enhance your skills in statistical analysis for research.
Leave a Comment Cancel Reply
Your email address will not be published. Required fields are marked *
Save my name, email, and website in this browser for the next time I comment.
Role of Statistics
- Reference work entry
- First Online: 01 January 2014
- pp 1254–1258
- Cite this reference work entry

- Ashok Sahai 2 &
- Miodrag Lovric 2
204 Accesses
“ Modern statistics, like telescopes, microscopes, X-rays, radar, and medical scans, enables us to see things invisible to the naked eye. Modern statistics enables us to see through the mists and confusion of the world about us, to grasp the underlying reality. ”
Introduction
Despite some recent vigorously promulgated criticisms of statistical methods (particularly significance tests), methodological limitations, and misuses of statistics (see Ziliak and McCloskey 2008 ; Hurlbert and Lombardi 2009 ; Marcus 2009 ; especially Siegfried 2010 , among others), we are the ones still “living in the golden age of statistics” (Efron 1998 ).
Statistics play a vital role in collecting, summarizing, analyzing, and interpreting data in almost all branches of science such as agriculture, astronomy, biology, business, chemistry, economics, education, engineering, genetics, government, medicine, pharmacy, physics, psychology, sociology, etc. Statistical concepts and principles are ubiquitous in...
This is a preview of subscription content, log in via an institution to check access.
Access this chapter
- Get 10 units per month
- Download Article/Chapter or Ebook
- 1 Unit = 1 Article or 1 Chapter
- Cancel anytime
- Available as PDF
- Read on any device
- Instant download
- Own it forever
- Available as EPUB and PDF
- Durable hardcover edition
- Dispatched in 3 to 5 business days
- Free shipping worldwide - see info
Tax calculation will be finalised at checkout
Purchases are for personal use only
Institutional subscriptions
References and Further Reading
Brewer JK (1985) Behavioral statistics textbooks: source of myths and misconceptions? J Edu Stat, 10(3) Available at: http://www.jstor.org/stable/1164796 (Special issue: Teaching statistics)
Coleman AL (2009) The role of statistics in ophthalmology. Am J Ophthalmol 147(3):387–388
Google Scholar
Cox D (2008) The role of statistics in science and technology. Video file, available at: http://video.google.com/videoplay?docid = 1739298413105326425#
Curran-Everett D, Taylor S, Kafadar K (1998) Fundamental concepts in statistics: elucidation and illustration. J Appl Physiol 85: 775–786
Dudewicz EJ, Karian ZA (1999) The role of statistics in IS/IT: practical gains from mined data. Inform Syst Frontiers 1(3):259–266
Efron B (1998) R. A. Fisher in the 21st century. Stat Sci 13(2):95–122
Feinstein AR (2001) Principles of medical statistics. Chapman and Hall/CRC, London
Fisher R (1925) Statistical methods for research workers, Oliver and Boyd, Edinburgh
Hacking I (1990) The taming of chance. Cambridge University Press, Cambridge
Hand D (1985) The role of statistics in psychiatry. Psychol Med 15:471–476
Hand D (2008) Statistics: a very short introduction. Oxford University Press, Oxford
Hurlbert SH, Lombardi CM (2009) Final collapse of the Neyman-Pearson decision theoretic framework and rise of the neoFisherian. Ann Zool Fenn 46:311–349
Johnson R, Miller I, Freund J (2004) Miller & Freund’s probability and statistics for engineers. 7th edn. Prentice Hall, Englewood Cliffs, NJ
Kirkwood SC (2003) The role of statistics in pharmacogenomics. J Japan Soc Comp Stat 15(2):3–13
MathSciNet Google Scholar
Liu BH (1998) Statistical genomics: linkage, mapping, and QTL analysis. CRC Press, Boca Raton, p x
Magder L (2007) Against statistical inference: a commentary on the role of statistics in public health research, The 135th APHA annual meeting & exposition of APHA, Washington DC
Marcus A (2009) Fraud case rocks anesthesiology community: Mass. researcher implicated in falsification of data, other misdeeds. Anesthesiology News, 35, 3
Moore DS (1998) Statistics among the liberal arts. J Am Stat Assoc 93(444):1253–1259
Morrison D, Henkel R (eds) (2006) The significance test controversy: a reader. Aldine transaction, Piscataway, USA (reprint)
Paris21 (The partnership in statistics for development in the 21st Century) Counting down poverty: the role of statistics in world development. Available at http://www.paris21.org/documents/2532.pdf
Popper K (2002) The logic of scientific discovery. (trans: Logik der Forschung, Vienna, 1934). Routledge, London
Provost LP, Norman CL (1990) Variation through the ages. Quality Progress Special Issue on Variation, ASQC
Raftery AE (2001) Statistics in sociology, 1950–2000: a selective review. Sociol Methodol 31(1):1–45
Siegfried T (2010) Odds are, it’s wrong: science fails to face the shortcomings of statistics, Science News, 177, 26
Sprent P (2003) Statistics in medical research. Swiss Med Wkly. 133(39–40), 522–529
Srivastava TN, Rego S (2008) Statistics for management, Tata McGraw Hill, New Delhi
Straf ML (2003) Statistics: the next generation. J Am Stat Assoc 98:461 (Presidential address)
Suppes P (2007) Statistical concepts in philosophy of science. Synthese 154:485–496
MATH MathSciNet Google Scholar
v Mises R (1930) Über kausale und statistische Gesetzmäßigkeit in der Physik. Die Naturwissenschaften 18(7):145–153
Vere-Jones D (2006) The development of statistical seismology: a personal experience. Tectonophysics 413:5–12
Ziliak ST, McCloskey DN (2008) The cult of statistical significance: how the standard error costs us jobs, justice, and lives. University of Michigan Press
Zwiers FW, Storch HV (2004) On the role of statistics in climate research. Int J Climatol 24:665–680
Download references
Author information
Authors and affiliations.
St. Augustine Campus of the University of the West Indiesat Trinidad, St. Augustine, Trinidad and Tobago
Ashok Sahai ( Professor ) & Miodrag Lovric ( Professor )
You can also search for this author in PubMed Google Scholar
Editor information
Editors and affiliations.
Department of Statistics and Informatics, Faculty of Economics, University of Kragujevac, City of Kragujevac, Serbia
Miodrag Lovric
Rights and permissions
Reprints and permissions
Copyright information
© 2011 Springer-Verlag Berlin Heidelberg
About this entry
Cite this entry.
Sahai, A., Lovric, M. (2011). Role of Statistics. In: Lovric, M. (eds) International Encyclopedia of Statistical Science. Springer, Berlin, Heidelberg. https://doi.org/10.1007/978-3-642-04898-2_640
Download citation
DOI : https://doi.org/10.1007/978-3-642-04898-2_640
Published : 02 December 2014
Publisher Name : Springer, Berlin, Heidelberg
Print ISBN : 978-3-642-04897-5
Online ISBN : 978-3-642-04898-2
eBook Packages : Mathematics and Statistics Reference Module Computer Science and Engineering
Share this entry
Anyone you share the following link with will be able to read this content:
Sorry, a shareable link is not currently available for this article.
Provided by the Springer Nature SharedIt content-sharing initiative
- Publish with us
Policies and ethics
- Find a journal
- Track your research

An official website of the United States government
The .gov means it’s official. Federal government websites often end in .gov or .mil. Before sharing sensitive information, make sure you’re on a federal government site.
The site is secure. The https:// ensures that you are connecting to the official website and that any information you provide is encrypted and transmitted securely.
- Publications
- Account settings
Preview improvements coming to the PMC website in October 2024. Learn More or Try it out now .
- Advanced Search
- Journal List
- v.13(1); 2021 Jan
Trends in the Usage of Statistical Software and Their Associated Study Designs in Health Sciences Research: A Bibliometric Analysis
Emad masuadi.
1 Research Unit/Biostatistics, King Saud bin Abdulaziz University for Health Sciences, College of Medicine/King Abdullah International Medical Research Centre, Riyadh, SAU
Mohamud Mohamud
2 Research Unit/Epidemiology, King Saud bin Abdulaziz University for Health Sciences, College of Medicine, Riyadh, SAU
Muhannad Almutairi
3 Medicine, King Saud bin Abdulaziz University for Health Sciences, College of Medicine, Riyadh, SAU
Abdulaziz Alsunaidi
Abdulmohsen k alswayed, omar f aldhafeeri.
The development of statistical software in research has transformed the way scientists and researchers conduct their statistical analysis. Despite these advancements, it was not clear which statistical software is mainly used for which research design thereby creating confusion and uncertainty in choosing the right statistical tools. Therefore, this study aimed to review the trend of statistical software usage and their associated study designs in articles published in health sciences research.
This bibliometric analysis study reviewed 10,596 articles published in PubMed in three 10-year intervals (1997, 2007, and 2017). The data were collected through Google sheet and were analyzed using SPSS software. This study described the trend and usage of currently available statistical tools and the different study designs that are associated with them.
Of the statistical software mentioned in the retrieved articles, SPSS was the most common statistical tool used (52.1%) in the three-time periods followed by SAS (12.9%) and Stata (12.6%). WinBugs was the least used statistical software with only 40(0.6%) of the total articles. SPSS was mostly associated with observational (61.1%) and experimental (65.3%) study designs. On the other hand, Review Manager (43.7%) and Stata (38.3%) were the most statistical software associated with systematic reviews and meta-analyses.
In this study, SPSS was found to be the most widely used statistical software in the selected study periods. Observational studies were the most common health science research design. SPSS was associated with observational and experimental studies while Review Manager and Stata were mostly used for systematic reviews and meta-analysis.
Introduction
With the evolution of open access in the publishing world, access to empirical research has never been more widespread than it is now. For most of the researchers, however, the key feature of their articles is the robustness and repeatability of their methods section particularly the design of the study and the type of statistical tests to employ. The emergency of statistical software has transformed the way scientists and researchers conducting their statistical analysis. Therefore, performing complex and at times erroneous statistical analysis manually has become thing of the past [ 1 ].
Statistical software has many useful applications for researchers in the healthcare sciences. Furthermore, the researchers conveniently read their data by representing their data as visual aids using charts and graphs [ 2 ]. It also helps the researchers to easily calculate their results using statistical tests by accounting for their variables either numerical, categorical, or both [ 2 ]. However, in the past few decades, statistical software usage went through different stages based on their development and applications [ 3 ]. Although some software are more dedicated to a specific field, the degree of usage of specific software may depend on the preference of the investigators or the type of study design that is selected in their research.
There are different types of statistical software and each of these is used for a different type of study. In a study of the popularity of statistical software in research, Muenchen R (2016) found that the Statistical Package for Social Sciences (SPSS) is by far the most popular statistical software used in epidemiological studies [ 3 ]. Another example of popular software that is used is SAS (Statistical Analysis Systems), which is statistical software that is considered to be flexible and has better graphical facilities compared to SPSS [ 4 ]. However, it can be difficult for novice users compared to SPSS due to its more advanced commands [ 4 ]. Another statistical software that is used in health sciences research is Stata. It allows users standard and non-standard methods of data analysis due to its ability to implement a powerful programming language in the analysis for a particular use. However, some of these features may be more difficult to use than other applications [ 5 ].
A study conducted in the United States has found that about 61% of original research articles in the Journal of Health Services Research have specified which statistical software they used for the data analysis [ 6 ]. Researchers also found that Stata and SAS were the predominant statistical software used in the reviewed articles. Another study about the use of statistical software and the various ways of measuring the popularity or their market share showed that SAS and SPSS were most popular in the business world. However, SAS was found to be the most popular in job openings followed by SPSS which had just less than double the Minitab, and R-project software had one-quarter of Minitab [ 7 ]. Another similar study was conducted in Pakistan which focused on the type of study design and the statistical software used in two local journals. The investigators found that SPSS was the most commonly used software while cross-sectional study design dominated the articles published [ 8 ].
Despite the development of the different statistical software and the speed with which these tools are produced, it may be very hard for the researchers to choose which statistical software they employ given the type of study design. This is complicated by the fact that all commercially available statistical tools strive to accommodate almost all features researchers need to analyze their data. Regardless of the type of study design, the availability of these statistical software, and the familiarity of the analysts in a particular software may greatly influence which statistical tool to use during the analysis. The type of statistical software and the choice of studies they are used for in health sciences is currently under-researched either because researchers have little knowledge about the applicability of specific statistical tools or the institutional decision on which software to use for analysis. To our knowledge, no study investigated the association between the use of statistical software and the chosen study design in different health sciences fields. Therefore, this study aimed to review the trend of the statistical software usage and their associated study designs among published health sciences articles in three time periods: 1997, 2007, and 2017.
Materials and methods
This bibliometric web-based study covered 14 different statistical software. Because of health sciences being a vast and highly researched area, investigators have chosen to limit their search to one database, PubMed. This database comprises more than 30 million articles of health-related disciplines. The data collection was limited to a 10-year interval (1997, 2007, and 2017), and was accomplished from October 2018 to May 2019. The study employed a semi-structured review process to select the articles for the study. The main inclusion criterion was that the article selected used one of the following statistical software either mentioned in the abstract, methods, or in the full text if available: GraphPad, MedCalc, JMP, LISREL, WinBUGS, Review Manager, Microsoft Excel, Minitab, SAS, Epi Info, Stata, SPSS, Statistica, R Project. However, any article mentioned a similar name but did not mean the statistical software was excluded. The initial search generated 10,596 articles and the process used was as follows: All the 14 statistical software mentioned above were searched together using the Boolean operator “OR” as the connector word. Multiple names were included for the last software (R Project) because it had been mentioned in different articles with different names. Next, articles identified were filtered based on the specified periods which were 1997, 2007, and 2017. No additional filters or other restrictions such as the article language were applied.
For each selected article, the statistical software used and the study design employed were identified by reading the title and abstract. If none of the statistical software was found or the name was an acronym other than the software (e.g., SAS as SATB2-associated syndrome), then the article’s full text was examined. If the full text is not available, that article was excluded. Similarly, the study design was checked in the title and in the abstract and if not evident, the full text was reviewed if available. If two or more study designs were reported in the article, then the main study design was considered. Lastly, the PubMed identifier (PMID) number was added to avoid any errors or article duplications.
Figure Figure1 1 represented the PRISMA flow diagram of the inclusion and exclusion process of the articles. The initial search for the three-time periods specified yielded 10,596 articles. Of those 1,169 articles were excluded because of lack of access to the abstract, the free full text or no software was mentioned. Furthermore, 2,958 articles were excluded because of wrong abbreviations or the acronym had a different meaning. Finally, 6,469 articles were included in the present study. The data were collected through a Google sheet and were analyzed using IBM SPSS Statistics for Windows, Version 24.0 (IBM Corp., Armonk, NY). Categorical data were presented as frequencies and percentages. Bar charts were used to display software usage across the study periods.

Of the 10,596 generated during the literature search, 6,469 articles that were published in the years 1997, 2007, and 2017 were included in the final review. The percentages of the statistical software used in these articles are shown in Figure Figure2. 2 . SPSS was the most commonly used statistical software for data analysis with 3,368 (52.1%) articles, followed by SAS 833 (12.9%), and Stata 815 (12.6%). WinBugs was the least used statistical software with only 40 (0.6%) of the total articles.

The total percentage was 113.3% since some articles used more than one software.
As shown in Figure Figure3, 3 , SPSS was found to be the most commonly used statistical software throughout the study periods 1997 (27.9%), 2007 (59.7%), and 2017 (51.3%). SAS was second to SPSS in the first two periods while in 2017, its use has shifted down to fifth compared to Stata. Other software that have gained popularity included R-project and Review Manager. In the first time period (1997), the articles that used these tools were very few. However, in 2017, their use has shifted up to third (11.4%) and sixth (5.7%), respectively.

Of the 6,469 reviewed articles, 6,342 (98%) had clearly mentioned study designs and the rest 127 (2%) were either not clear or not mentioned in the articles. The study designs were classified into four main types: observational 4,763 (75.1%), experimental 736 (11.6%), systematic review 661 (10.4%), and research support\review article 218 (2.9%) (Figure (Figure4). 4 ). Among the observational studies, cross-sectional was the most frequently used study design with 3,585 (75.3%). In experimental study designs, randomized controlled trials were the most used design with 520 (70.7%) in the reviewed articles. Around three-quarters of the systematic review articles, 506 (76.6%) also included meta-analyses.

Association between statistical software used and study design employed is shown in Table Table1. 1 . The majority of the articles on systematic reviews\meta-analysis designs opted to use Review Manager (43.7%) followed by Stata (38.3%). Two-thirds of experimental studies used SPSS software for data analysis and only SAS software was the other major tool used in these studies. For the observational studies, again SPSS was the predominant statistical software used (61.1%) and the rest of the percentages were distributed among other statistical tools. Most review articles used R-project (60.2%) followed by SAS (27.7%) with only 6.6% of the review articles used SPSS.
| Software | Systematic review\meta-analysis (n = 661) | Experimental (n = 736) | Observation (n = 4,763) | Review articles/Research support (n = 218) |
| Epi-Info | 0.0% | 0.0% | 5.9% | 0.0% |
| Excel | 5.3% | 5.2% | 8.6% | 3.6% |
| Graphpad | 0.4% | 1.2% | 0.7% | 0.0% |
| JMP | 0.1% | 0.2% | 0.6% | 0.6% |
| Lisrel | 0.0% | 0.6% | 1.3% | 0.0% |
| Medcalc | 0.6% | 0.2% | 0.5% | 0.6% |
| Minitab | 0.0% | 0.4% | 0.0% | 0.0% |
| Review Manager | 43.7% | 0.0% | 0.0% | 0.0% |
| R-Project | 6.9% | 3.4% | 4.0% | 60.2% |
| SAS | 0.9% | 16.5% | 7.5% | 27.7% |
| SPSS | 2.7% | 65.3% | 61.1% | 6.6% |
| Stata | 38.3% | 5.2% | 8.6% | 0.6% |
| Statistica | 0.0% | 0.4% | 1.0% | 0.0% |
| Winbugs | 1.1% | 1.2% | 0.2% | 0.0% |
| Total | 100.0% | 100.0% | 100.0% | 100.0% |
The relationship between the use of statistical software and the type of research designs in health sciences is not well understood. Therefore, the aim of this study was to describe the trends of the statistical software usage and their associated study designs among published health sciences articles in three time periods. While a five-year interval was possible, the number of articles required to be included would have been overwhelming. However, this study included articles published at a 10-year interval in 1997, 2007, and 2017. With the current search strategy, the amount of data collected exceeded 10,000 articles. One important issue during the data collection was the ambiguity in the abbreviation of names for the statistical software. For example, when typing the abbreviation SAS (Statistical Analysis System) on the PubMed search engine, the search results are sometimes mixed up with the abbreviation of sleep apnea scale or subarachnoid space, there was also a marked difference in software usage across all the years.
Overall, SPSS was found to be the most popular statistical software followed by SAS and Stata. When examined the use of the statistical software, SPSS was found to be the most popular tool in the chosen three time periods. The positions of the other statistical tools fluctuated in terms of their use in the health sciences. Regarding the associated study designs, observational studies and in particular cross-sectional were found to be the predominant when compared to other study designs. This study also found that SPSS was mostly used for observational and experimental studies while Review Manager and Stata were mostly associated with systematic reviews and meta-analysis.
This study included articles in all health sciences regardless of where they were published. However, unlike our study, some articles which reported the use of statistical software have limited their search to a specific region or local journals [ 6 , 8 ]. This study found that SPSS was the most used software worldwide. In contrast, a study conducted in the United States found that Stata was the most commonly used statistical software employed in health services followed by SAS [ 7 ]. Suggesting that there could be geographical variation in the use of statistical software. Another study conducted in Pakistan which included articles published in two local journals found that SPSS was the most commonly used statistical software [ 8 ].
Other reasons that may have caused the variation of the statistical software packages may include the availability of these tools in different parts of the world and the preferences of the researchers. In the US study, for example, close to 50% of US-based researchers used Stata while the percentage of non-US articles that used Stata was only 15% [ 7 ].
For the study design, the current study found that around three-quarters of observational studies were cross-sectional. Our finding agreed with a study conducted in Saudi Arabia which reported almost a similar percentage [ 9 ]. However, the Pakistani study found half the percentage of both studies [ 8 ]. Regarding the other study designs, only 10.4% of the articles were systematic reviews or meta-analyses in this study. This lower percentage found in this study agrees with a study in the United States that investigated the relationship between the type of study design and the chances of citation in the first two years. They reported that only 4% of the 624 articles were meta-analyses or systematic reviews [ 10 ].
Limitations
Because of logistical and personnel issues, the current study only used the PubMed database. Lack of access to the full text of the retrieved titles caused a number of articles to be excluded. This may have introduced bias in reporting the type of statistical software or the chosen study design. This study depended on the reported study designs and did not verify their accuracy, as it was not the main aim of the study.
Conclusions
The purpose of this study was to inform researchers about the usage of the different statistical software packages and their associated study designs in health sciences research. In this study, SPSS was found to be the most widely used statistical software throughout the whole study period. The observational studies were the dominating health science research design with cross-sectional studies being the most common study design. SPSS was associated with observational and experimental studies while Review Manager and Stata were mostly used for systematic reviews and meta-analysis. As this the first wide-ranging study about the statistical software use and the associated study designs, we envisage that it will be of benefit to researchers to choose the most probable statistical software regarding their chosen study design.
The content published in Cureus is the result of clinical experience and/or research by independent individuals or organizations. Cureus is not responsible for the scientific accuracy or reliability of data or conclusions published herein. All content published within Cureus is intended only for educational, research and reference purposes. Additionally, articles published within Cureus should not be deemed a suitable substitute for the advice of a qualified health care professional. Do not disregard or avoid professional medical advice due to content published within Cureus.
The authors have declared that no competing interests exist.
Human Ethics
Consent was obtained by all participants in this study
Animal Ethics
Animal subjects: All authors have confirmed that this study did not involve animal subjects or tissue.
Top 9 Statistical Tools Used in Research
Well-designed research requires a well-chosen study sample and a suitable statistical test selection . To plan an epidemiological study or a clinical trial, you’ll need a solid understanding of the data . Improper inferences from it could lead to false conclusions and unethical behavior . And given the ocean of data available nowadays, it’s often a daunting task for researchers to gauge its credibility and do statistical analysis on it.
With that said, thanks to all the statistical tools available in the market that help researchers make such studies much more manageable. Statistical tools are extensively used in academic and research sectors to study human, animal, and material behaviors and reactions.
Statistical tools aid in the interpretation and use of data. They can be used to evaluate and comprehend any form of data. Some statistical tools can help you see trends, forecast future sales, and create links between causes and effects. When you’re unsure where to go with your study, other tools can assist you in navigating through enormous amounts of data.
What is Statistics? And its Importance in Research
Statistics is the study of collecting, arranging, and interpreting data from samples and inferring it to the total population. Also known as the “Science of Data,” it allows us to derive conclusions from a data set. It may also assist people in all industries in answering research or business queries and forecast outcomes, such as what show you should watch next on your favorite video app.
Statistical Tools Used in Research
Researchers often cannot discern a simple truth from a set of data. They can only draw conclusions from data after statistical analysis. On the other hand, creating a statistical analysis is a difficult task. This is when statistical tools come into play. Researchers can use statistical tools to back up their claims, make sense of a vast set of data, graphically show complex data, or help clarify many things in a short period.
Let’s go through the top 9 best statistical tools used in research below:
SPSS first stores and organizes the data, then compile the data set to generate appropriate output. SPSS is intended to work with a wide range of variable data formats.
R is a statistical computing and graphics programming language that you may use to clean, analyze and graph your data. It is frequently used to estimate and display results by researchers from various fields and lecturers of statistics and research methodologies. It’s free, making it an appealing option, but it relies upon programming code rather than drop-down menus or buttons.
Many big tech companies are using SAS due to its support and integration for vast teams. Setting up the tool might be a bit time-consuming initially, but once it’s up and running, it’ll surely streamline your statistical processes.
Moreover, MATLAB provides a multi-paradigm numerical computing environment, which means that the language may be used for both procedural and object-oriented programming. MATLAB is ideal for matrix manipulation, including data function plotting, algorithm implementation, and user interface design, among other things. Last but not least, MATLAB can also run programs written in other programming languages.
Some of the highlights of Tableau are:
7. MS EXCEL:
You can apply various formulas and functions to your data in Excel without prior knowledge of statistics. The learning curve is great, and even freshers can achieve great results quickly since everything is just a click away. This makes Excel a great choice not only for amateurs but beginners as well.
8. RAPIDMINER:
RapidMiner is a valuable platform for data preparation, machine learning, and the deployment of predictive models. RapidMiner makes it simple to develop a data model from the beginning to the end. It comes with a complete data science suite. Machine learning, deep learning, text mining, and predictive analytics are all possible with it.
9. APACHE HADOOP:
So, if you have massive data on your hands and want something that doesn’t slow you down and works in a distributed way, Hadoop is the way to go.
Learn more about Statistics and Key Tools
Elasticity of Demand Explained in Plain Terms
An introduction to statistical power and a/b testing.
Statistical power is an integral part of A/B testing. And in this article, you will learn everything you need to know about it and how it is applied in A/B testing. A/B
What Data Analytics Tools Are And How To Use Them
When it comes to improving the quality of your products and services, data analytic tools are the antidotes. Regardless, people often have questions. What are data analytic tools? Why are
Learn More…
As an IT Engineer, who is passionate about learning and sharing. I have worked and learned quite a bit from Data Engineers, Data Analysts, Business Analysts, and Key Decision Makers almost for the past 5 years. Interested in learning more about Data Science and How to leverage it for better decision-making in my business and hopefully help you do the same in yours.
Recent Posts

Data Analysis Techniques in Research – Methods, Tools & Examples

Varun Saharawat is a seasoned professional in the fields of SEO and content writing. With a profound knowledge of the intricate aspects of these disciplines, Varun has established himself as a valuable asset in the world of digital marketing and online content creation.

Data analysis techniques in research are essential because they allow researchers to derive meaningful insights from data sets to support their hypotheses or research objectives.
Data Analysis Techniques in Research : While various groups, institutions, and professionals may have diverse approaches to data analysis, a universal definition captures its essence. Data analysis involves refining, transforming, and interpreting raw data to derive actionable insights that guide informed decision-making for businesses.

A straightforward illustration of data analysis emerges when we make everyday decisions, basing our choices on past experiences or predictions of potential outcomes.
If you want to learn more about this topic and acquire valuable skills that will set you apart in today’s data-driven world, we highly recommend enrolling in the Data Analytics Course by Physics Wallah . And as a special offer for our readers, use the coupon code “READER” to get a discount on this course.
Table of Contents
What is Data Analysis?
Data analysis is the systematic process of inspecting, cleaning, transforming, and interpreting data with the objective of discovering valuable insights and drawing meaningful conclusions. This process involves several steps:
- Inspecting : Initial examination of data to understand its structure, quality, and completeness.
- Cleaning : Removing errors, inconsistencies, or irrelevant information to ensure accurate analysis.
- Transforming : Converting data into a format suitable for analysis, such as normalization or aggregation.
- Interpreting : Analyzing the transformed data to identify patterns, trends, and relationships.
Types of Data Analysis Techniques in Research
Data analysis techniques in research are categorized into qualitative and quantitative methods, each with its specific approaches and tools. These techniques are instrumental in extracting meaningful insights, patterns, and relationships from data to support informed decision-making, validate hypotheses, and derive actionable recommendations. Below is an in-depth exploration of the various types of data analysis techniques commonly employed in research:
1) Qualitative Analysis:
Definition: Qualitative analysis focuses on understanding non-numerical data, such as opinions, concepts, or experiences, to derive insights into human behavior, attitudes, and perceptions.
- Content Analysis: Examines textual data, such as interview transcripts, articles, or open-ended survey responses, to identify themes, patterns, or trends.
- Narrative Analysis: Analyzes personal stories or narratives to understand individuals’ experiences, emotions, or perspectives.
- Ethnographic Studies: Involves observing and analyzing cultural practices, behaviors, and norms within specific communities or settings.
2) Quantitative Analysis:
Quantitative analysis emphasizes numerical data and employs statistical methods to explore relationships, patterns, and trends. It encompasses several approaches:
Descriptive Analysis:
- Frequency Distribution: Represents the number of occurrences of distinct values within a dataset.
- Central Tendency: Measures such as mean, median, and mode provide insights into the central values of a dataset.
- Dispersion: Techniques like variance and standard deviation indicate the spread or variability of data.
Diagnostic Analysis:
- Regression Analysis: Assesses the relationship between dependent and independent variables, enabling prediction or understanding causality.
- ANOVA (Analysis of Variance): Examines differences between groups to identify significant variations or effects.
Predictive Analysis:
- Time Series Forecasting: Uses historical data points to predict future trends or outcomes.
- Machine Learning Algorithms: Techniques like decision trees, random forests, and neural networks predict outcomes based on patterns in data.
Prescriptive Analysis:
- Optimization Models: Utilizes linear programming, integer programming, or other optimization techniques to identify the best solutions or strategies.
- Simulation: Mimics real-world scenarios to evaluate various strategies or decisions and determine optimal outcomes.
Specific Techniques:
- Monte Carlo Simulation: Models probabilistic outcomes to assess risk and uncertainty.
- Factor Analysis: Reduces the dimensionality of data by identifying underlying factors or components.
- Cohort Analysis: Studies specific groups or cohorts over time to understand trends, behaviors, or patterns within these groups.
- Cluster Analysis: Classifies objects or individuals into homogeneous groups or clusters based on similarities or attributes.
- Sentiment Analysis: Uses natural language processing and machine learning techniques to determine sentiment, emotions, or opinions from textual data.
Also Read: AI and Predictive Analytics: Examples, Tools, Uses, Ai Vs Predictive Analytics
Data Analysis Techniques in Research Examples
To provide a clearer understanding of how data analysis techniques are applied in research, let’s consider a hypothetical research study focused on evaluating the impact of online learning platforms on students’ academic performance.
Research Objective:
Determine if students using online learning platforms achieve higher academic performance compared to those relying solely on traditional classroom instruction.
Data Collection:
- Quantitative Data: Academic scores (grades) of students using online platforms and those using traditional classroom methods.
- Qualitative Data: Feedback from students regarding their learning experiences, challenges faced, and preferences.
Data Analysis Techniques Applied:
1) Descriptive Analysis:
- Calculate the mean, median, and mode of academic scores for both groups.
- Create frequency distributions to represent the distribution of grades in each group.
2) Diagnostic Analysis:
- Conduct an Analysis of Variance (ANOVA) to determine if there’s a statistically significant difference in academic scores between the two groups.
- Perform Regression Analysis to assess the relationship between the time spent on online platforms and academic performance.
3) Predictive Analysis:
- Utilize Time Series Forecasting to predict future academic performance trends based on historical data.
- Implement Machine Learning algorithms to develop a predictive model that identifies factors contributing to academic success on online platforms.
4) Prescriptive Analysis:
- Apply Optimization Models to identify the optimal combination of online learning resources (e.g., video lectures, interactive quizzes) that maximize academic performance.
- Use Simulation Techniques to evaluate different scenarios, such as varying student engagement levels with online resources, to determine the most effective strategies for improving learning outcomes.
5) Specific Techniques:
- Conduct Factor Analysis on qualitative feedback to identify common themes or factors influencing students’ perceptions and experiences with online learning.
- Perform Cluster Analysis to segment students based on their engagement levels, preferences, or academic outcomes, enabling targeted interventions or personalized learning strategies.
- Apply Sentiment Analysis on textual feedback to categorize students’ sentiments as positive, negative, or neutral regarding online learning experiences.
By applying a combination of qualitative and quantitative data analysis techniques, this research example aims to provide comprehensive insights into the effectiveness of online learning platforms.
Also Read: Learning Path to Become a Data Analyst in 2024
Data Analysis Techniques in Quantitative Research
Quantitative research involves collecting numerical data to examine relationships, test hypotheses, and make predictions. Various data analysis techniques are employed to interpret and draw conclusions from quantitative data. Here are some key data analysis techniques commonly used in quantitative research:
1) Descriptive Statistics:
- Description: Descriptive statistics are used to summarize and describe the main aspects of a dataset, such as central tendency (mean, median, mode), variability (range, variance, standard deviation), and distribution (skewness, kurtosis).
- Applications: Summarizing data, identifying patterns, and providing initial insights into the dataset.
2) Inferential Statistics:
- Description: Inferential statistics involve making predictions or inferences about a population based on a sample of data. This technique includes hypothesis testing, confidence intervals, t-tests, chi-square tests, analysis of variance (ANOVA), regression analysis, and correlation analysis.
- Applications: Testing hypotheses, making predictions, and generalizing findings from a sample to a larger population.
3) Regression Analysis:
- Description: Regression analysis is a statistical technique used to model and examine the relationship between a dependent variable and one or more independent variables. Linear regression, multiple regression, logistic regression, and nonlinear regression are common types of regression analysis .
- Applications: Predicting outcomes, identifying relationships between variables, and understanding the impact of independent variables on the dependent variable.
4) Correlation Analysis:
- Description: Correlation analysis is used to measure and assess the strength and direction of the relationship between two or more variables. The Pearson correlation coefficient, Spearman rank correlation coefficient, and Kendall’s tau are commonly used measures of correlation.
- Applications: Identifying associations between variables and assessing the degree and nature of the relationship.
5) Factor Analysis:
- Description: Factor analysis is a multivariate statistical technique used to identify and analyze underlying relationships or factors among a set of observed variables. It helps in reducing the dimensionality of data and identifying latent variables or constructs.
- Applications: Identifying underlying factors or constructs, simplifying data structures, and understanding the underlying relationships among variables.
6) Time Series Analysis:
- Description: Time series analysis involves analyzing data collected or recorded over a specific period at regular intervals to identify patterns, trends, and seasonality. Techniques such as moving averages, exponential smoothing, autoregressive integrated moving average (ARIMA), and Fourier analysis are used.
- Applications: Forecasting future trends, analyzing seasonal patterns, and understanding time-dependent relationships in data.
7) ANOVA (Analysis of Variance):
- Description: Analysis of variance (ANOVA) is a statistical technique used to analyze and compare the means of two or more groups or treatments to determine if they are statistically different from each other. One-way ANOVA, two-way ANOVA, and MANOVA (Multivariate Analysis of Variance) are common types of ANOVA.
- Applications: Comparing group means, testing hypotheses, and determining the effects of categorical independent variables on a continuous dependent variable.
8) Chi-Square Tests:
- Description: Chi-square tests are non-parametric statistical tests used to assess the association between categorical variables in a contingency table. The Chi-square test of independence, goodness-of-fit test, and test of homogeneity are common chi-square tests.
- Applications: Testing relationships between categorical variables, assessing goodness-of-fit, and evaluating independence.
These quantitative data analysis techniques provide researchers with valuable tools and methods to analyze, interpret, and derive meaningful insights from numerical data. The selection of a specific technique often depends on the research objectives, the nature of the data, and the underlying assumptions of the statistical methods being used.
Also Read: Analysis vs. Analytics: How Are They Different?
Data Analysis Methods
Data analysis methods refer to the techniques and procedures used to analyze, interpret, and draw conclusions from data. These methods are essential for transforming raw data into meaningful insights, facilitating decision-making processes, and driving strategies across various fields. Here are some common data analysis methods:
- Description: Descriptive statistics summarize and organize data to provide a clear and concise overview of the dataset. Measures such as mean, median, mode, range, variance, and standard deviation are commonly used.
- Description: Inferential statistics involve making predictions or inferences about a population based on a sample of data. Techniques such as hypothesis testing, confidence intervals, and regression analysis are used.
3) Exploratory Data Analysis (EDA):
- Description: EDA techniques involve visually exploring and analyzing data to discover patterns, relationships, anomalies, and insights. Methods such as scatter plots, histograms, box plots, and correlation matrices are utilized.
- Applications: Identifying trends, patterns, outliers, and relationships within the dataset.
4) Predictive Analytics:
- Description: Predictive analytics use statistical algorithms and machine learning techniques to analyze historical data and make predictions about future events or outcomes. Techniques such as regression analysis, time series forecasting, and machine learning algorithms (e.g., decision trees, random forests, neural networks) are employed.
- Applications: Forecasting future trends, predicting outcomes, and identifying potential risks or opportunities.
5) Prescriptive Analytics:
- Description: Prescriptive analytics involve analyzing data to recommend actions or strategies that optimize specific objectives or outcomes. Optimization techniques, simulation models, and decision-making algorithms are utilized.
- Applications: Recommending optimal strategies, decision-making support, and resource allocation.
6) Qualitative Data Analysis:
- Description: Qualitative data analysis involves analyzing non-numerical data, such as text, images, videos, or audio, to identify themes, patterns, and insights. Methods such as content analysis, thematic analysis, and narrative analysis are used.
- Applications: Understanding human behavior, attitudes, perceptions, and experiences.
7) Big Data Analytics:
- Description: Big data analytics methods are designed to analyze large volumes of structured and unstructured data to extract valuable insights. Technologies such as Hadoop, Spark, and NoSQL databases are used to process and analyze big data.
- Applications: Analyzing large datasets, identifying trends, patterns, and insights from big data sources.
8) Text Analytics:
- Description: Text analytics methods involve analyzing textual data, such as customer reviews, social media posts, emails, and documents, to extract meaningful information and insights. Techniques such as sentiment analysis, text mining, and natural language processing (NLP) are used.
- Applications: Analyzing customer feedback, monitoring brand reputation, and extracting insights from textual data sources.
These data analysis methods are instrumental in transforming data into actionable insights, informing decision-making processes, and driving organizational success across various sectors, including business, healthcare, finance, marketing, and research. The selection of a specific method often depends on the nature of the data, the research objectives, and the analytical requirements of the project or organization.
Also Read: Quantitative Data Analysis: Types, Analysis & Examples
Data Analysis Tools
Data analysis tools are essential instruments that facilitate the process of examining, cleaning, transforming, and modeling data to uncover useful information, make informed decisions, and drive strategies. Here are some prominent data analysis tools widely used across various industries:
1) Microsoft Excel:
- Description: A spreadsheet software that offers basic to advanced data analysis features, including pivot tables, data visualization tools, and statistical functions.
- Applications: Data cleaning, basic statistical analysis, visualization, and reporting.
2) R Programming Language:
- Description: An open-source programming language specifically designed for statistical computing and data visualization.
- Applications: Advanced statistical analysis, data manipulation, visualization, and machine learning.
3) Python (with Libraries like Pandas, NumPy, Matplotlib, and Seaborn):
- Description: A versatile programming language with libraries that support data manipulation, analysis, and visualization.
- Applications: Data cleaning, statistical analysis, machine learning, and data visualization.
4) SPSS (Statistical Package for the Social Sciences):
- Description: A comprehensive statistical software suite used for data analysis, data mining, and predictive analytics.
- Applications: Descriptive statistics, hypothesis testing, regression analysis, and advanced analytics.
5) SAS (Statistical Analysis System):
- Description: A software suite used for advanced analytics, multivariate analysis, and predictive modeling.
- Applications: Data management, statistical analysis, predictive modeling, and business intelligence.
6) Tableau:
- Description: A data visualization tool that allows users to create interactive and shareable dashboards and reports.
- Applications: Data visualization , business intelligence , and interactive dashboard creation.
7) Power BI:
- Description: A business analytics tool developed by Microsoft that provides interactive visualizations and business intelligence capabilities.
- Applications: Data visualization, business intelligence, reporting, and dashboard creation.
8) SQL (Structured Query Language) Databases (e.g., MySQL, PostgreSQL, Microsoft SQL Server):
- Description: Database management systems that support data storage, retrieval, and manipulation using SQL queries.
- Applications: Data retrieval, data cleaning, data transformation, and database management.
9) Apache Spark:
- Description: A fast and general-purpose distributed computing system designed for big data processing and analytics.
- Applications: Big data processing, machine learning, data streaming, and real-time analytics.
10) IBM SPSS Modeler:
- Description: A data mining software application used for building predictive models and conducting advanced analytics.
- Applications: Predictive modeling, data mining, statistical analysis, and decision optimization.
These tools serve various purposes and cater to different data analysis needs, from basic statistical analysis and data visualization to advanced analytics, machine learning, and big data processing. The choice of a specific tool often depends on the nature of the data, the complexity of the analysis, and the specific requirements of the project or organization.
Also Read: How to Analyze Survey Data: Methods & Examples
Importance of Data Analysis in Research
The importance of data analysis in research cannot be overstated; it serves as the backbone of any scientific investigation or study. Here are several key reasons why data analysis is crucial in the research process:
- Data analysis helps ensure that the results obtained are valid and reliable. By systematically examining the data, researchers can identify any inconsistencies or anomalies that may affect the credibility of the findings.
- Effective data analysis provides researchers with the necessary information to make informed decisions. By interpreting the collected data, researchers can draw conclusions, make predictions, or formulate recommendations based on evidence rather than intuition or guesswork.
- Data analysis allows researchers to identify patterns, trends, and relationships within the data. This can lead to a deeper understanding of the research topic, enabling researchers to uncover insights that may not be immediately apparent.
- In empirical research, data analysis plays a critical role in testing hypotheses. Researchers collect data to either support or refute their hypotheses, and data analysis provides the tools and techniques to evaluate these hypotheses rigorously.
- Transparent and well-executed data analysis enhances the credibility of research findings. By clearly documenting the data analysis methods and procedures, researchers allow others to replicate the study, thereby contributing to the reproducibility of research findings.
- In fields such as business or healthcare, data analysis helps organizations allocate resources more efficiently. By analyzing data on consumer behavior, market trends, or patient outcomes, organizations can make strategic decisions about resource allocation, budgeting, and planning.
- In public policy and social sciences, data analysis is instrumental in developing and evaluating policies and interventions. By analyzing data on social, economic, or environmental factors, policymakers can assess the effectiveness of existing policies and inform the development of new ones.
- Data analysis allows for continuous improvement in research methods and practices. By analyzing past research projects, identifying areas for improvement, and implementing changes based on data-driven insights, researchers can refine their approaches and enhance the quality of future research endeavors.
However, it is important to remember that mastering these techniques requires practice and continuous learning. That’s why we highly recommend the Data Analytics Course by Physics Wallah . Not only does it cover all the fundamentals of data analysis, but it also provides hands-on experience with various tools such as Excel, Python, and Tableau. Plus, if you use the “ READER ” coupon code at checkout, you can get a special discount on the course.
For Latest Tech Related Information, Join Our Official Free Telegram Group : PW Skills Telegram Group
Data Analysis Techniques in Research FAQs
What are the 5 techniques for data analysis.
The five techniques for data analysis include: Descriptive Analysis Diagnostic Analysis Predictive Analysis Prescriptive Analysis Qualitative Analysis
What are techniques of data analysis in research?
Techniques of data analysis in research encompass both qualitative and quantitative methods. These techniques involve processes like summarizing raw data, investigating causes of events, forecasting future outcomes, offering recommendations based on predictions, and examining non-numerical data to understand concepts or experiences.
What are the 3 methods of data analysis?
The three primary methods of data analysis are: Qualitative Analysis Quantitative Analysis Mixed-Methods Analysis
What are the four types of data analysis techniques?
The four types of data analysis techniques are: Descriptive Analysis Diagnostic Analysis Predictive Analysis Prescriptive Analysis

- The Best Data And Analytics Courses For Beginners

Unlock the world of data and analytics courses with our guide! Whether you're looking to boost your career or curious…
- Top 20 Big Data Tools Used By Professionals

There are plenty of big data tools available online for free. However, some of the handpicked big data tools used…
- How to Become a Data Analyst

Data Analyst roles are in high demand, offering exciting career opportunities in various industries. Read this article to discover how…

Related Articles
- Analytics For BI: What is Business Intelligence and Analytics?
- Google Data Analytics Professional Certificate Review, Cost, Eligibility
- Analysis of Algorithm in Data Structure
- 6 Benefits of Data Analytics That Will Blow Your Mind!
- Comprehensive Data Analytics Syllabus: Courses and Curriculum
- Accounting and Data Analytics: Types, Tools, Challenges
- Best 5 Unique Strategies to Use Artificial Intelligence Data Analytics

Standard statistical tools in research and data analysis
Introduction.
Statistics is a field of science concerned with gathering, organising, analysing, and extrapolating data from samples to the entire population. This necessitates a well-designed study, a well-chosen study sample, and a proper statistical test selection. A good understanding of statistics is required to design epidemiological research or a clinical trial. Improper statistical approaches might lead to erroneous findings and unethical behaviour.
A variable is a trait that differs from one person to the next within a population. Quantitative variables are measured by a scale and provide quantitative information, such as height and weight. Qualitative factors, such as sex and eye colour, provide qualitative information (Figure 1).
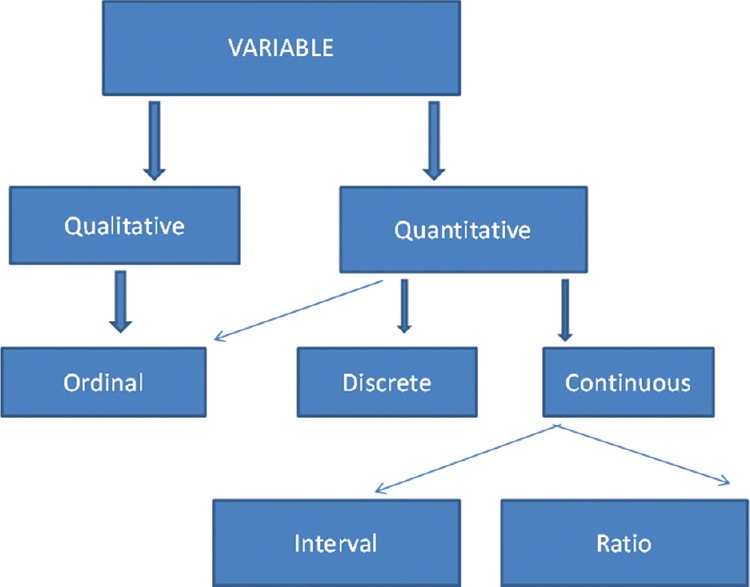
Figure 1. Classification of variables [1]
Quantitative variables
Discrete and continuous measures are used to split quantitative or numerical data. Continuous data can take on any value, whereas discrete numerical data is stored as a whole number such as 0, 1, 2, 3,… (integer). Discrete data is made up of countable observations, while continuous data is made up of measurable observations. Discrete data examples include the number of respiratory arrest episodes or re-intubation in an intensive care unit. Continuous data includes serial serum glucose levels, partial pressure of oxygen in arterial blood, and oesophageal temperature. A hierarchical scale with increasing precision can be used based on category, ordinal, interval and ratio scales (Figure 1).
Descriptive statistics try to explain how variables in a sample or population are related. The mean, median, and mode forms, descriptive statistics give an overview of data. Inferential statistics use a random sample of data from that group to characterise and infer about a community as a whole. It’s useful when it’s not possible to investigate every single person in a group.

Descriptive statistics
The central tendency describes how observations cluster about a centre point, whereas the degree of dispersion describes the spread towards the extremes.
Inferential statistics
In inferential statistics, data from a sample is analysed to conclude the entire population. The goal is to prove or disprove the theories. A hypothesis is a suggested explanation for a phenomenon (plural hypotheses). Hypothesis testing is essential to process for making logical choices regarding observed effects’ veracity.
SOFTWARES FOR STATISTICS, SAMPLE SIZE CALCULATION AND POWER ANALYSIS
There are several statistical software packages accessible today. The most commonly used software systems are Statistical Package for the Social Sciences (SPSS – manufactured by IBM corporation), Statistical Analysis System (SAS – developed by SAS Institute North Carolina, Minitab (developed by Minitab Inc), United States of America), R (designed by Ross Ihaka and Robert Gentleman from the R core team), Stata (developed by StataCorp), and MS Excel. There are several websites linked to statistical power studies. Here are a few examples:
- StatPages.net – contains connections to a variety of online power calculators.
- G-Power — a downloadable power analysis software that works on DOS.
- ANOVA power analysis creates an interactive webpage that estimates the power or sample size required to achieve a specified power for one effect in a factorial ANOVA design.
- Sample Power is software created by SPSS. It generates a comprehensive report on the computer screen that may be copied and pasted into another document.
A researcher must be familiar with the most important statistical approaches for doing research. This will aid in the implementation of a well-designed study that yields accurate and valid data. Incorrect statistical approaches can result in erroneous findings, mistakes, and reduced paper’s importance. Poor statistics can lead to poor research, which can lead to immoral behaviour. As a result, proper statistical understanding and the right application of statistical tests are essential. A thorough understanding of fundamental statistical methods will go a long way toward enhancing study designs and creating high-quality medical research that may be used to develop evidence-based guidelines.
[1] Ali, Zulfiqar, and S Bala Bhaskar. “Basic statistical tools in research and data analysis.” Indian journal of anaesthesia vol. 60,9 (2016): 662-669. doi:10.4103/0019-5049.190623
[2] Ali, Zulfiqar, and S Bala Bhaskar. “Basic statistical tools in research and data analysis.” Indian journal of anaesthesia vol. 60,9 (2016): 662-669. doi:10.4103/0019-5049.190623
- ANOVA power analysis
- Quantitative Data analysis
- quantitative variables
- R programming
- sample size calculation.
- A global market analysis (1)
- Academic (22)
- Algorithms (1)
- Big Data Analytics (4)
- Bio Statistics (3)
- Clinical Prediction Model (1)
- Corporate (9)
- Corporate statistics service (1)
- Data Analyses (23)
- Data collection (11)
- Genomics & Bioinformatics (1)
- Guidelines (2)
- Machine Learning – Blogs (1)
- Meta-analysis service (2)
- Network Analysis (1)
- Predictive analyses (2)
- Qualitative (1)
- Quantitaive (2)
- Quantitative Data analysis service (1)
- Research (59)
- Shipping & Logistics (1)
- Statistical analysis service (7)
- Statistical models (1)
- Statistical Report Writing (1)
- Statistical Software (10)
- Statistics (64)
- Survey & Interview from Statswork (1)
- Uncategorized (1)
Recent Posts
- Top 10 Machine Learning Algorithms Expected to Shape the Future of AI
- Data-Driven Governance: Revolutionizing State Youth Policies through Web Scraping
- The Future is Now: The Potential of Predictive Analytics Models and Algorithms
- 2024 Vision: Exploring the Impact and Evolution of Advanced Analytics Tools
- Application of machine learning in marketing
Statswork is a pioneer statistical consulting company providing full assistance to researchers and scholars. Statswork offers expert consulting assistance and enhancing researchers by our distinct statistical process and communication throughout the research process with us.
Functional Area
– Research Planning – Tool Development – Data Mining – Data Collection – Statistics Coursework – Research Methodology – Meta Analysis – Data Analysis
- – Corporate
- – Statistical Software
- – Statistics
Corporate Office
#10, Kutty Street, Nungambakkam, Chennai, Tamil Nadu – 600034, India No : +91 4433182000, UK No : +44-1223926607 , US No : +1-9725029262 Email: [email protected]
Website: www.statswork.com
© 2024 Statswork. All Rights Reserved
The importance of statistical tools in research
Chat with Paper: Save time, read 10X faster with AI
Preparation and Characterization of Hydroxyapatite and Optimizing Its Properties Using Regression Model
Related papers (5), basic statistical tools in research and data analysis., teaching multivariate analysis to business-major students, statistical methods and common problems in medical or biomedical science research., statistical analysis in microbiology: statnotes, some basic aspects of statistical methods and sample size determination in health science research, trending questions (3).
Statistical tools like t-test, F-test, regression analysis, and ANOVA are crucial for comparing data, ensuring accuracy, and simplifying analysis in research studies.
- "T-test, F-test, regression analysis, ANOVA" - "Statistical tools for accuracy, bias, and precision in research"
The mean is used in statistical tools to provide a central value representing a dataset, aiding in quantifying accuracy, bias, and precision in analytical work.
- Submit a Manuscript
- Advanced search
American Journal of Neuroradiology
Advanced Search
Assessing the Emergence and Evolution of Artificial Intelligence and Machine Learning Research in Neuroradiology
- Find this author on Google Scholar
- Find this author on PubMed
- Search for this author on this site
- ORCID record for Alexandre Boutet
- ORCID record for Samuel S. Haile
- ORCID record for Hyo Jin Son
- ORCID record for Mikail Malik
- ORCID record for Mehran Nasralla
- ORCID record for Jurgen Germann
- ORCID record for Farzad Khalvati
- ORCID record for Birgit B. Ertl-Wagner
- Figures & Data
- Info & Metrics
This article requires a subscription to view the full text. If you have a subscription you may use the login form below to view the article. Access to this article can also be purchased.
BACKGROUND AND PURPOSE: Interest in artificial intelligence (AI) and machine learning (ML) has been growing in neuroradiology, but there is limited knowledge on how this interest has manifested into research and specifically, its qualities and characteristics. This study aims to characterize the emergence and evolution of AI/ML articles within neuroradiology and provide a comprehensive overview of the trends, challenges, and future directions of the field.
MATERIALS AND METHODS: We performed a bibliometric analysis of the American Journal of Neuroradiology ; the journal was queried for original research articles published since inception (January 1, 1980) to December 3, 2022 that contained any of the following key terms: “machine learning,” “artificial intelligence,” “radiomics,” “deep learning,” “neural network,” “generative adversarial network,” “object detection,” or “natural language processing.” Articles were screened by 2 independent reviewers, and categorized into statistical modeling (type 1), AI/ML development (type 2), both representing developmental research work but without a direct clinical integration, or end-user application (type 3), which is the closest surrogate of potential AI/ML integration into day-to-day practice. To better understand the limiting factors to type 3 articles being published, we analyzed type 2 articles as they should represent the precursor work leading to type 3.
RESULTS: A total of 182 articles were identified with 79% being nonintegration focused (type 1 n = 53, type 2 n = 90) and 21% ( n = 39) being type 3. The total number of articles published grew roughly 5-fold in the last 5 years, with the nonintegration focused articles mainly driving this growth. Additionally, a minority of type 2 articles addressed bias (22%) and explainability (16%). These articles were primarily led by radiologists (63%), with most (60%) having additional postgraduate degrees.
CONCLUSIONS: AI/ML publications have been rapidly increasing in neuroradiology with only a minority of this growth being attributable to end-user application. Areas identified for improvement include enhancing the quality of type 2 articles, namely external validation, and addressing both bias and explainability. These results ultimately provide authors, editors, clinicians, and policymakers important insights to promote a shift toward integrating practical AI/ML solutions in neuroradiology.
- ABBREVIATIONS:
Alexandre Boutet and Samuel S. Haile are co-first authors that contributed equally.
Farzad Khalvati and Birgit B. Ertl-Wagner are co-supervisors of this article.
Disclosure forms provided by the authors are available with the full text and PDF of this article at www.ajnr.org .
- © 2024 by American Journal of Neuroradiology
Log in using your username and password
Thank you for your interest in spreading the word on American Journal of Neuroradiology.
NOTE: We only request your email address so that the person you are recommending the page to knows that you wanted them to see it, and that it is not junk mail. We do not capture any email address.
Citation Manager Formats
- EndNote (tagged)
- EndNote 8 (xml)
- RefWorks Tagged
- Ref Manager

- Tweet Widget
- Facebook Like
- Google Plus One
Jump to section
- MATERIALS AND METHODS
- CONCLUSIONS
Related Articles
- No related articles found.
- Google Scholar
Cited By...
- No citing articles found.
This article has not yet been cited by articles in journals that are participating in Crossref Cited-by Linking.
More in this TOC Section
- A Deep Learning Approach to Predict Recanalization First-Pass Effect following Mechanical Thrombectomy in Patients with Acute Ischemic Stroke
- Evaluating Biases and Quality Issues in Intermodality Image Translation Studies for Neuroradiology: A Systematic Review
Similar Articles
- SUGGESTED TOPICS
- The Magazine
- Newsletters
- Managing Yourself
- Managing Teams
- Work-life Balance
- The Big Idea
- Data & Visuals
- Reading Lists
- Case Selections
- HBR Learning
- Topic Feeds
- Account Settings
- Email Preferences
Research: Using AI at Work Makes Us Lonelier and Less Healthy
- David De Cremer
- Joel Koopman

Employees who use AI as a core part of their jobs report feeling more isolated, drinking more, and sleeping less than employees who don’t.
The promise of AI is alluring — optimized productivity, lightning-fast data analysis, and freedom from mundane tasks — and both companies and workers alike are fascinated (and more than a little dumbfounded) by how these tools allow them to do more and better work faster than ever before. Yet in fervor to keep pace with competitors and reap the efficiency gains associated with deploying AI, many organizations have lost sight of their most important asset: the humans whose jobs are being fragmented into tasks that are increasingly becoming automated. Across four studies, employees who use it as a core part of their jobs reported feeling lonelier, drinking more, and suffering from insomnia more than employees who don’t.
Imagine this: Jia, a marketing analyst, arrives at work, logs into her computer, and is greeted by an AI assistant that has already sorted through her emails, prioritized her tasks for the day, and generated first drafts of reports that used to take hours to write. Jia (like everyone who has spent time working with these tools) marvels at how much time she can save by using AI. Inspired by the efficiency-enhancing effects of AI, Jia feels that she can be so much more productive than before. As a result, she gets focused on completing as many tasks as possible in conjunction with her AI assistant.
- David De Cremer is a professor of management and technology at Northeastern University and the Dunton Family Dean of its D’Amore-McKim School of Business. His website is daviddecremer.com .
- JK Joel Koopman is the TJ Barlow Professor of Business Administration at the Mays Business School of Texas A&M University. His research interests include prosocial behavior, organizational justice, motivational processes, and research methodology. He has won multiple awards from Academy of Management’s HR Division (Early Career Achievement Award and David P. Lepak Service Award) along with the 2022 SIOP Distinguished Early Career Contributions award, and currently serves on the Leadership Committee for the HR Division of the Academy of Management .
Partner Center
| You might be using an unsupported or outdated browser. To get the best possible experience please use the latest version of Chrome, Firefox, Safari, or Microsoft Edge to view this website. |
60 SEO Statistics For 2024

Updated: Nov 28, 2023, 2:48pm

Table of Contents
Key seo statistics in 2024, search engine statistics, keyword statistics, ranking statistics, link building statistics, video search statistics, mobile seo statistics, voice search statistics, local seo statistics, seo industry statistics.
As a small business owner, SEO should be top of mind. This is particularly true if you’re on a budget and don’t want to spend thousands of dollars on paid ads. SEO can improve your website’s visibility and in turn, increase conversions and sales.
With a solid SEO strategy, you may also build brand awareness and trust with current and prospective customers. Whether you’re new to SEO, working with a third-party SEO service , or consider yourself a seasoned vet, these SEO statistics will provide some insight into the current state of the industry and how it might change in the future.
Featured Partners
Starting at $2,500 per month
Harrisburg, PA

On WebFX's Website
Funnel Boost Media
Starting at $1500 per month
San Antonio, TX

On Funnel Boost Media's Website
HigherVisibility
Starting at $1,000 per month
Memphis, TN

On Highervisibility's Website
Organic clicks accounted for 45.1% of all search result clicks in 2022
Out of the total search engine clicks on desktop devices, 45.1% came from organic clicks 6 . This shows that users are more likely to trust organic search results than those that come from other sources, such as paid ads. By taking advantage of SEO, you can win more traffic.
26% of searches resulted in no clicks
Not every search leads a user to a third-party website from an organic search result. In fact, 26% of searches resulted in zero clicks 6 . These zero-click searches were likely informational queries rather than commercial queries with high purchase intent. Users may find the information they’re looking for directly on the search results page and therefore have no reason to click through to any website.
Less than 1% of users get to the second page of search results
When users search for something, they don’t want to dig for the information they’re looking for. That’s why it’s no surprise that only 0.44% of Google search users visit second-page results 12 . To succeed online, it’s essential that your website ranks on page one for as many relevant keywords as possible.
The first organic result in a search results page has an average click-through rate of 27.6%
Click-through rate (CTR) shows how often users who see your organic search result actually click through to your web page. Page one results have an average click-through rate of 27.6%, compared to page two results, which have a much lower average rate of 15.8% 12 . The higher your web page ranks, the more clicks you’re likely to receive.
Building credibility is the main benefit of SEO
No matter what products or services you sell or how long you’ve been in business, credibility is important 6 . If users trust your brand, they’ll feel more confident buying from you. A strong SEO strategy can also position you as a trustworthy leader in your industry and help you stand out from your competitors.
SEOs say their biggest challenges are lack of resources and strategy issues
It’s not easy to succeed in SEO, especially if you’re struggling with your strategy and/or don’t have the resources to design and implement it. Fortunately, you can take SEO courses to expand your knowledge and skills. Another option is to outsource SEO to the pros so you can focus on other, big-picture tasks, such as growing your business.
SEOs say that the biggest shifts in the industry are AI and Google updates
When asked about the “biggest shifts” and industry changes in SEO, 18.7% of respondents said machine learning and artificial intelligence while 18% said Google updates 1 . Since SEO is ever-evolving, it’s important to stay up to date on the latest changes so you can adjust your strategy accordingly.
Google’s algorithm has over 200 factors
Google considers more than 200 signals or clues when it determines its search engine rankings 10 . Penguin, which was created in 2012, is one of these signals. It helps reduce the presence of sites that use black hat SEO techniques. Other factors include domain age, keyword usage, content length, duplicate content, grammar and mobile usability.
Over 90% of searches worldwide happen on Google
While Google is not the only search engine out there, it’s where you should focus your SEO efforts as it has 90.68% of the search engine market share 17 . Once you’re pleased with how you’re ranking in Google, you can expand your efforts to other search engines, such as Bing, Yahoo, Naver and DuckDuckGo.
Google also owns almost 94% of market share for mobile search
When it comes to mobile search market share, Google takes the cake as well. Out of all the mobile searches that occur, 93.77% are on Google 17 . This reinforces the importance of ensuring your website is SEO-friendly on mobile devices. It should look great and be easy to navigate on iOS and Android.
The second and third most used search engines worldwide are Yahoo and Bing with 3.23% and 3.17% market shares, respectively
Google is the most popular search engine and Yahoo and Bing are right behind it 17 . Since Google is blocked in some countries such as China, it might make sense to focus on Yahoo and Bing as well. Just keep in mind that these search engines have different algorithms than Google so your strategy might need to change.
In the past five years, Google has done approximately 36 major algorithm updates
Google updates its algorithm often to improve search quality and keep digital marketers on their toes. In fact, the search engine completed 36 algorithms between September 2018 and September 2023 18 . Thirteen of these updates were considered core updates. As a business owner who uses SEO, it’s your job to familiarize yourself with these updates as they come out.
The average internet user conducts three to four searches per day on search engines
Searching on Google is an everyday activity, just like taking a shower and brushing your teeth. On average, a Google user performs three to four searches per day 12 . It’s how they get answers to their questions and find solutions to their problems.
The most Google traffic comes from the United States, India and Brazil
People from around the world depend on Google search. Research shows that 27.03% of its traffic comes from the United States, followed by India (4.46%) and Brazil (4.41%) 2 . If you sell to customers abroad, make sure most of your content targets the U.S. market.
Google has over 8.5 billion searches per day worldwide
Believe it or not, Google runs around 99,000 search queries per second. This adds up to 8.5 billion searches per day in every part of the world 8 . If your website isn’t optimized for organic Google search, you’re missing out and need to design an SEO strategy as soon as possible.
About 95% of keywords have a volume of 10 or less searches per month
Keywords are words or phrases users type into search engines to find the content they’re looking for. Not all keywords are popular as 95% of all keywords have 10 or fewer searches per month 13 . A keyword research tool can give you some insight on what these keywords are in your industry so you know where to focus your SEO efforts.
15% of searches are brand new searches that have never been searched before by Google
You can find out which relevant keywords were searched for in the past. However, 15% of searches that Google sees every day are brand new 10 . This means the search engine constantly has to work to ensure users receive the best content for their queries.
There are more than 19,000 keywords with over 100,000 monthly search volume in the U.S.
There are 19,881 high-volume keywords with more than 100,000 monthly searches in the U.S 13 . You should identify what these keywords are so you can tailor your content around them. However, don’t forget to target uncommon or rare keywords as well. While higher-volume keywords can attract a wider audience, lower-volume keywords are easier to rank for.
Google’s Keyword Planner can overestimate keyword volumes by as much as 91%
Google Keyword Planner is a free tool you can use to learn about keywords related to your business and their search volumes. If you do take advantage of it, keep in mind that the search volumes it reveals are not 100% accurate. The tool can overestimate keyword impressions by up to 91% 19 .
14.1% of all keywords are phrased as a question
It’s not uncommon for users to use words such as “how,” “what,” “where” and “who” while searching as 14% of all keywords are questions 12 . By using questions in your content, you can build trust and draw in highly relevant traffic. When you create content for question keywords, keep things clear and concise, use bullet points and numbers, and add supportive images.
The most searched keywords on Google are ‘youtube,’ ‘facebook’ and ‘whatsapp web’
Social media and communication sites including “YouTube,” “Facebook” and “WhatsApp Web” are the most popular keywords users search for in Google 6 . Their volumes are 1,200,000,000, 867,000,000 and 543,300,000, respectively. This highlights the power of using social media in your digital marketing strategy.
According to experts, the most important ranking factors in 2023 are quality content, backlinks and search intent/relevance
SEO experts believe that the keys to ranking high in search engines in 2023 are quality content, backlinks and search intent or relevance 20 . Therefore, you should prioritize these factors as you develop and implement your SEO strategy.
Google rewrites the title 61% of the time while rewriting the description about 63% of the time
Each web page has a meta title and meta description that inform search engines what they’re about. The titles and descriptions you write are not set in stone as Google rewrites 61% of titles 13 and 62.78% of descriptions 1 . To write quality metadata, use the right keywords and be conversational.
The most common types of featured snippets are paragraphs (82%) and lists (11%)
Featured snippets are short excerpts of text that show up at the top of Google’s search results to quickly answer a user’s question. Most of these snippets are in paragraph form (81.95%) while the rest are in list form (10.77%) 1 . To increase your chances of ranking for a featured snippet, write content that answers questions, add a table of contents with anchor links and insert an FAQ section.
The average ‘age’ of top result pages is 2.6 years old
Unfortunately, high search engine rankings don’t happen overnight. On average, pages that are at the top of search results are 2.6 years old 13 . With patience and hard work, you can slowly but surely watch your pages jump up in rankings.
Click-through rates decline at an average of 32.3% for each position on the first page
There’s no denying that earning a spot at the top of search engine results takes hard work. However, this hard work is often worth it when you consider that the higher you rank, the more likely users are to click through to your web page. The average click-through rate for the number one spot is 27%, compared to the 2.4% click-through rate at the number 10 spot 12 .
Over 90% of pages never get organic traffic
In a perfect world, all of your pages would rank organically. The reality, however, is that more than 90% of pages never do 13 . To make sure your pages are not part of this statistic, create original, high-quality content, build backlinks to authoritative websites, and ensure they’re indexed.
The top-ranked search results typically have 3.8 times more backlinks than lower-ranked results
Backlinks are essentially votes that tell Google your web page is valuable and informative. They’re important to build as the top-ranked search results usually have 3.8 more backlinks than results in spots two through 10 12 . To build backlinks, reclaim unlinked mentions, try to earn a spot on “Best X” lists, reach out to journalists, become a source for other publishers and update old content.
About 95% of pages have no backlinks at all
Despite the fact that backlinks are essential if you want your pages to rank well, 95% of all web pages don’t have them 12 . Be a part of the 5% of pages with high-quality backlinks that lead to excellent search engine rankings. If you don’t have the time or knowledge to do so, don’t be afraid to consult an SEO professional.
In 2022, backlinks had an average cost of $361.44
Top-quality backlinks from highly authoritative sites with high domain authorities (DAs) do not come cheap. In 2022, they were an average of $361.44 13 . The price you might pay for a backlink will likely depend on DA, content quality, domain quality, top relevance, organic traffic and the country or language.
Long-form content receives 77% more links than short-form content
It can take a lot more time and effort to write a long blog post than a short blog post. However, the extra time commitment can pay off. Data shows that longer content with 3,000 or more words received 77.2% more links than shorter content with 1,000 or fewer words 12 .
The top link-building strategy in 2022 according to experts was to publish link-worthy content
Content is king, especially if you want to build quality backlinks that improve your SEO. Experts in the field believed that in 2022, content was the key to link-building success 1 . The content you create should be relevant, engaging and useful to your particular target audience. Don’t forget to make sure it’s 100% original.
26% of searches include a video in the results
According to research from BrightEdge, 26% of search results have a video thumbnail. 21 If you’re wondering if it’s worth it to add videos to your web pages, the answer is likely “yes.” Videos can help you stand out and get noticed by Google.
Videos have a 41% higher CTR than plain text results
Video content can make it easier and faster for your audience to get the information they’re looking for. That’s why it’s no surprise videos have a 41% higher click-through rate than text-filled pages 22 . If you’ve done everything you can but your page isn’t ranking as well as you’d like it to, add a video.
Mobile users are 12.5 times more likely to see organic image results and three times more likely to see organic video results
If you’re investing in videos and images for your website, make sure they’re optimized for mobile. Here’s why: mobile users saw 12.5 times more images and three times more videos in organic search 6 .
HD videos rank higher than lower-quality videos
High-definition, or HD, videos offer higher resolution and quality than standard-definition videos. Therefore, YouTube chose to highlight them 18 . Not only will poor-quality videos frustrate your users, they can also lead to lost views and subscribers. In addition, you may receive dislikes. If possible, put in the extra effort and turn your videos into HD videos.
63% of searches are conducted on a mobile device in the U.S.
Mobile devices made up 63% of organic search engine visits in the U.S., as of the fourth quarter of 2021 2 . To make sure your website is optimized for mobile search, use a responsive design, simplify your navigation, eliminate pop-ups and keep all content short and concise. Don’t forget to improve page speed as well.
58% of searches are conducted on a mobile device, globally
If you serve customers abroad, you should know that 58.33% of global organic search visits were conducted on mobile devices, as of the first quarter of 2023 2 . Therefore, it’s important that your website accommodates mobile search as well as an international audience.
Mobile users conduct about 4.96 billion searches per day worldwide
Every day, there are 4.96 billion mobile searches performed across the globe 2 . When you design your website for the global mobile market, remember to limit scrolling, add large, mobile-friendly buttons and ensure a clean, efficient design.
57% of local searches come from a mobile device and tablet
When users are out and about looking for a product or service in their local area, they’re likely to use their mobile devices to find it. In fact, 57% of all local searches are made on mobile devices and tablets 3 . This means your website should be compatible on mobile devices and tailor to local audiences.
Appearing first for a mobile search doesn’t mean you’ll appear in first position on a desktop search
It can be exciting to earn the number one spot on mobile search engine results pages (SERPs). However, that doesn’t mean you’ll be number one on desktop SERPs as well. Only 17% of websites kept their positions across both mobile and desktop SERPs. In addition, 37% lost their spots when searches came from mobile 6 .
20% of Google App searches are conducted by voice
Voice search allows users to speak to a mobile or desktop device to conduct a Google search. It can come in handy when they have their hands full or are on the go. Of all the searches in the Google App, 20% of them are performed by voice 10 .
50% of U.S. consumers use voice search every day
These days, voice search is more popular than ever before. In fact, half of all U.S. customers use it on a daily basis 4 . To ensure your website supports voice search and captures this audience, target question keywords and other long-tailed keywords, prioritize local SEO, use schema makeup and optimize speed.
Over 1 billion voice searches are conducted every month
Users perform over 1 billion voice searches every month 6 . If you’re not investing in voice search optimization, you’re missing out. As you tweak your website to meet the needs of those who use voice search, think about your audience’s voice search behavior and how you can create content that aligns with their intent.
Voice searches are longer than text-based searches, on average
It’s easier to say a long word or phrase than to type it. That’s why voice searches tend to be longer than text-based searches 8 . By using long-tailed keywords that are relevant to your business and target audience, you can cater to voice search users.
70% of voice search results pull from ‘Featured Snippets’ and ‘People Also Ask’
While Featured Snippets are highlighted text excerpts that appear at the top of a Google search results page, People Also Ask is a feature that shows users additional content and answers related to their search query. Featured Snippets and People Also Ask account for 70% of voice search results 6 .
Experts forecast that by 2024, voice search queries will increase to 2 billion per month
There’s a good chance voice search will continue to grow in popularity. SEO experts predict that the number of monthly voice search queries will increase from 1 billion to 2 billion in 2024. If you haven’t optimized your site for voice, now is the time to do so 24 .
The top voice assistants are Amazon, Google and Apple, with 69%, 25% and 5% market share in 2021, respectively
Voice assistants are programs that allow users to perform voice searches. As of June 2021, the leading voice assistant is Amazon (69%), followed by Google (25%) and Apple (5%). As long as your site accommodates voice search, it can reach users, no matter which voice assistant they choose to use 7 .
46% of all Google searches are local
Local SEO targets customers in a specific city, region or neighborhood. When you consider the fact that almost half of all Google searches have local intent, you’ll want to ensure local SEO is part of your overall SEO strategy, especially if you sell to customers in certain geographic areas 8 .
50% of smartphone users visited a store within a day of their local search
If your goal is to get customers in the door as soon as possible, local search is essential. Half of all smartphone users who perform a local search went to a store they found through it within a day 10 .
Four in five people use search engines for local queries
The popularity of local queries is significant. Four out of five people use search engines to meet a need they have in their local area 10 . To optimize your website for local search, claim your Google Business Profile listing, add your business to local directories, create content with local search terms and add schema markup.
‘Open now near me’ searches have increased by 400%
Customers don’t want to wait long to go to a business and buy what they need. That’s why they often search “open now near me.” These searches have gone up by 400% from September 2019 to August 2020 and September 2020 to August 2021 10 . By claiming your Google Business Profile listing and adding your hours, you can take advantage of this trend.
18% of local searches lead to a purchase within 24 hours
If you’d like to convert users while your product or service is fresh in their minds, local search is key. Compared to 7% of non-local searches, 18% of local smartphone searches resulted in a purchase within a day 10 .
42% of local searchers click into map pack results
Google Maps Pack is a set of three Google Maps search results that usually appear when users perform local searches for businesses. Earning a spot on the Google Maps Pack can do wonders for your business as 42% of local searchers click on these results 12 . To increase your chances of becoming a Google Maps Pack result, claim your Google Business Profile listing, generate more online reviews and build citations.
Almost 64% of customers are likely to read Google reviews before visiting a local business
Don’t underestimate the power of Google reviews as 63.6% of customers will read them before they stop into a local business 11 . To get more Google reviews, provide excellent customer service, add review links to your website and emails, and simply ask for reviews from current and former customers.

The average SEO budget for a small business is almost $500 per month
You don’t have to spend thousands upon thousands of dollars on SEO. On average, a small business budget is $497.16 per month 12 . You can always increase your budget as you see results and earn more revenue.
SEO agencies charge an average of over $3,200 per month
If you don’t have the in-house time or expertise to focus on SEO, you might consider an agency. However, keep in mind that SEO agencies can be pricey. You can expect to pay an average of $3,209 per month for their services 13 .
SEO roles are projected to grow by 22% between 2020 and 2030
SEO specialists can work for digital marketing agencies or in-house marketing departments. The demand for these types of professionals is forecasted to increase by 22% between 2020 and 2030 14 . Depending on your budget and goals, you might want to hire an SEO specialist to assist with your SEO strategy.
The SEO industry is forecasted to be worth almost $218 billion by 2030
Rest assured SEO isn’t going anywhere anytime soon. By 2030, the SEO services market is predicted to grow to $217,846 15 . As a small business, SEO should be a part of your overall marketing plan today, tomorrow and years down the road.
52% of business leaders develop content with the help of AI
Content marketing, which focuses on creating useful and informative content can lead to better SEO results. Thanks to the rise in AI content generation tools, you can simplify your content marketing efforts, just like 52% of business leaders who are currently doing so 16 .
- Search Engine Journal
- ReviewTrackers
- Think with Google
- Ranktrackers
- Best Accredited Colleges
- The Business Research Company
- Siege Media
- Search Engine Land
- MonsterInsights
- BrightEdge Research
- Best SEO Software For Small Business
- Best Social Media Management Software
- Best Email Marketing Software
- Best SEO Services For Small Business
- Best Mass Texting Services
- Best Mailchimp Alternatives
- Best ActiveCampaign Alternatives
- Top SEMRush Alternatives
- Top ahrefs Alternatives
- Hootsuite Review
- MailerLite Review
- ActiveCampaign Review
- Constant Contact Review
- Sprout Social Review
- SEMRush Review
- Mailchimp Review
- Small Business Marketing
- What Is Marketing?
- What Is Digital Marketing?
- Digital Marketing Strategy Guide
- Digital Marketing Tips
- Search Engine Marketing Guide
- SEO Marketing Guide
- Social Media Marketing
- Content Marketing
- PPC Advertising Guide
- Tips For Generating Leads Online
- The 4 Ps Of Marketing
- How To Get More Followers On Instagram
- How To Start A Podcast
- E-Commerce SEO
- WordPress SEO Guide
Next Up In Marketing
- Best SEO Tools & Software
- Best Social Media Management Tools
- Best SEO Services
- Best Chatbots

What Is A Double VPN?
BigCommerce Vs. Magento (Adobe Commerce): 2024 Comparison
What Is Black Hat SEO?
Strikingly Review 2024: Features, Pros & Cons
Traqq Review 2024: Features, Pros And Cons
How To Become A Landlord In 2024
Anna Baluch is a freelance writer from Cleveland, Ohio. She enjoys writing about a variety of health and personal finance topics. When she's away from her laptop, she can be found working out, trying new restaurants, and spending time with her family. Connect to her on LinkedIn.
Advancing social justice, promoting decent work ILO is a specialized agency of the United Nations

Main Figures on Forced Labour
27.6 million
people are in forced labour.
US$ 236 billion
generated in illegal profits every year.
3.9 million
of them are in State-imposed form of forced labour.
of them are women and girls (4.9 million in forced commercial sexual exploitation, and 6 million in other economic sectors).
of them are children (3.3 million). More than half of these children are in commercial sexual exploitation.
3 times more
risk of forced labour for migrant workers.
- Victims of forced labour include 17.3 million exploited in the private sector; 6.3 million in forced commercial sexual exploitation, and 3.9 million in forced labour imposed by State.
- The Asia and the Pacific region has the highest number of people in forced labour (15.1 million) and the Arab States the highest prevalence (5.3 per thousand people).
- Addressing decent work deficits in the informal economy, as part of broader efforts towards economic formalization, is a priority for progress against forced labour.
Source: 2022 Global Estimates
Forced Labour Observatory
The Forced Labour Observatory (FLO) is a database that provides comprehensive global and country information on forced labour, including on international and national legal and institutional frameworks; enforcement, prevention and protection measures, as well as information related to access to justice; remedies, and cooperation.
Global Reports

2021 Global Estimates of Modern Slavery: Forced Labour and Forced Marriage
The latest estimates show that forced labour and forced marriage have increased significantly in the last five years, according to the International Labour Organization, Walk Free and the International Organisation for Migration.
- Full Report
- Executive Summary
- Press Release
- Third estimates: Modern Slavery (2017)
- Second estimates: Forced Labour (2012)
- First estimates: Forced Labour (2005)

Profits and Poverty: The Economics of Forced Labour (2024)
The study investigates the underlying factors that drive forced labour, of which a major one is illegal profits.
- Press release
- First edition of the report and second estimates (2014)
- First estimates of illegal profits from forced labour (2005)
Main Statistical Tools on Forced Labour
- Hard to See, Harder to Count: Guidelines for Forced Labour Surveys
- Ethical Guidelines for Research on Forced Labour
- Evidence Gap Map on Forced Labour
- Global Research Agenda (child labour, forced labour and human trafficking)
ICLS and forced labour

The International Conference of Labour Statisticians (ICLS) is the authoritative body to set global standards in labour statistics. During its 20th meeting, in October 2018, the ICLS adopted the "Guidelines concerning the measurement of forced labour". The intent of the guidelines is to facilitate the process of testing the measurement of forced labour in different national circumstances and/or measurement objectives.
- Guidelines concerning the measurement of forced labour (ICLS 2018)
- Measurement of forced labour: stocktaking and way forward (ICLS 2023 Room document 22)
- All ICLS documents
IMAGES
VIDEO
COMMENTS
The Importance of Statistical Tools in Research Work International Journal of Scientific and Innovative Mathematical Research (IJSIMR) Page 52 parametric tests. Commonly used parametric tests are listed in the first column of the table and include t test and analysis of variance.
Statistical methods involved in carrying out a study include planning, designing, collecting data, analysing, drawing meaningful interpretation and reporting of the research findings. The statistical analysis gives meaning to the meaningless numbers, thereby breathing life into a lifeless data. The results and inferences are precise only if ...
In the field of research, statistics is important for the following reasons: Reason 1: Statistics allows researchers to design studies such that the findings from the studies can be extrapolated to a larger population. Reason 2: Statistics allows researchers to perform hypothesis tests to determine if some claim about a new drug, new procedure ...
Introduction. Statistical analysis is necessary for any research project seeking to make quantitative conclusions. The following is a primer for research-based statistical analysis. It is intended to be a high-level overview of appropriate statistical testing, while not diving too deep into any specific methodology.
Important Statistical Tools In Research. Researchers in the biological field find statistical analysis in research as the scariest aspect of completing research. However, statistical tools in research can help researchers understand what to do with data and how to interpret the results, making this process as easy as possible. 1.
Statistics is a crucial process behind how we make discoveries in science, make decisions based on data, and make predictions. Statistics allows you to understand a subject much more deeply. In this post, I cover two main reasons why studying the field of statistics is crucial in modern society. First, statisticians are guides for learning from ...
Statistical analysis means investigating trends, patterns, and relationships using quantitative data. It is an important research tool used by scientists, governments, businesses, and other organizations. To draw valid conclusions, statistical analysis requires careful planning from the very start of the research process. You need to specify ...
The purpose of statistical analysis is to clarify and not confuse. It is a tool for answering questions. It allows us to take large bodies of information and summarize them with a few simple statements. It lets us come to solid conclusions even when the realities of the research world make it difficult to isolate the problems we seek to study.
Statistical programming - From traditional analysis of variance and linear regression to exact methods and statistical visualization techniques, statistical programming is essential for making data-based decisions in every field. Econometrics - Modeling, forecasting and simulating business processes for improved strategic and tactical planning.
Statistical analysis is an indispensable tool for conducting high-quality research. This beginner's guide has provided an overview of key concepts and techniques specifically tailored for research work, enabling you to enhance the credibility and reliability of your findings. By understanding the importance of statistical analysis, collecting ...
Coleman ( 2009) believes that statistics play a vital role in "helping us to make decisions about new diagnostic tools and treatments and the care of our patients in the face of uncertainty because, when dealing with patients, we are never 100% certain about an outcome.". (i) Pharmacogenomics.
This study described the trend and usage of currently available statistical tools and the different study designs that are associated with them. Results. Of the statistical software mentioned in the retrieved articles, SPSS was the most common statistical tool used (52.1%) in the three-time periods followed by SAS (12.9%) and Stata (12.6%).
Abstract. Statistical methods involved in carrying out a study include planning, designing, collecting data, analysing, drawing meaningful interpretation and reporting of the research findings ...
Let's go through the top 9 best statistical tools used in research below: 1. SPSS: SPSS (Statistical Package for the Social Sciences) is a collection of software tools compiled as a single package. This program's primary function is to analyze scientific data in social science. This information can be utilized for market research, surveys ...
Importance of Data Analysis in Research. The importance of data analysis in research cannot be overstated; it serves as the backbone of any scientific investigation or study. Here are several key reasons why data analysis is crucial in the research process: Data analysis helps ensure that the results obtained are valid and reliable.
Inferential statistics. In inferential statistics, data from a sample is analysed to conclude the entire population. The goal is to prove or disprove the theories. A hypothesis is a suggested explanation for a phenomenon (plural hypotheses). Hypothesis testing is essential to process for making logical choices regarding observed effects ...
Statistical methods are an essential and vital tool in scientific research and scientific research. It helps in designing experiments, analyzing and interpreting data. It also contributes to ...
Begum K. and Ahmed A. (2015) Discuss the Importance of Statistical Tools in Research Work and suggest that in research and dissertations for different types of fields, it is necessary to have knowledge of different types of statistical tools like - "mean, median, mode, t-test, "F-test", and regression analysis.
The function of statistics in research is to purpose as a tool in conniving research, analyzing its data and portrayal of conclusions. there from. Most research studies result in a extensive ...
4. SPSS (Statistical package for the social sciences) is the set of software programs that are combined together in a single package. The basic application of this program is to analyze scientific data related with the social science. This data can be used for market research, surveys, data mining, etc. With the help of the obtained statistical ...
Statistics is a broad subject useful in almost all disciplines particularly in Research studies. Each and every researcher should have some knowledge of Statistics and must use statistical tools in research, one should know about the importance of statistical tools and how to use them in their research. The quality assurance of the work must be dealt with: the statistical operation necessary ...
Articles were screened by 2 independent reviewers, and categorized into statistical modeling (type 1), AI/ML development (type 2), both representing developmental research work but without a direct clinical integration, or end-user application (type 3), which is the closest surrogate of potential AI/ML integration into day-to-day practice.
The promise of AI is alluring — optimized productivity, lightning-fast data analysis, and freedom from mundane tasks — and both companies and workers alike are fascinated (and more than a ...
Abstract. The purpose of this paper is to elaborate on the importance of the Statistical Package for the Social Sciences, widely known as SPSS in the field of social sciences as an effective tool ...
People from around the world depend on Google search. Research shows that 27.03% of its traffic comes from the United States, followed by India (4.46%) and Brazil (4.41%) 2. If you sell to ...
The International Conference of Labour Statisticians (ICLS) is the authoritative body to set global standards in labour statistics. During its 20th meeting, in October 2018, the ICLS adopted the "Guidelines concerning the measurement of forced labour".
Abstract. The review present some considerations on statistic and statistical tools in different fields and tips to become familiar with statistical tools and the importance of statistical tools ...
View the latest statistics and graphs of the number of refugees and other people forced to flee. ... At a time when more than 1 in every 69 people on Earth has been forced to flee, our work at UNHCR is more important than ever before. UNHCR personnel. Our workforce is the backbone of UNHCR. As of 31 December 2023, we employ 20,305 people, of ...