- Affiliate Program

- UNITED STATES
- 台灣 (TAIWAN)
- TÜRKIYE (TURKEY)
- Academic Editing Services
- - Research Paper
- - Journal Manuscript
- - Dissertation
- - College & University Assignments
- Admissions Editing Services
- - Application Essay
- - Personal Statement
- - Recommendation Letter
- - Cover Letter
- - CV/Resume
- Business Editing Services
- - Business Documents
- - Report & Brochure
- - Website & Blog
- Writer Editing Services
- - Script & Screenplay
- Our Editors
- Client Reviews
- Editing & Proofreading Prices
- Wordvice Points
- Partner Discount
- Plagiarism Checker
- APA Citation Generator
- MLA Citation Generator
- Chicago Citation Generator
- Vancouver Citation Generator
- - APA Style
- - MLA Style
- - Chicago Style
- - Vancouver Style
- Writing & Editing Guide
- Academic Resources
- Admissions Resources

How to Write the Results/Findings Section in Research
What is the research paper Results section and what does it do?
The Results section of a scientific research paper represents the core findings of a study derived from the methods applied to gather and analyze information. It presents these findings in a logical sequence without bias or interpretation from the author, setting up the reader for later interpretation and evaluation in the Discussion section. A major purpose of the Results section is to break down the data into sentences that show its significance to the research question(s).
The Results section appears third in the section sequence in most scientific papers. It follows the presentation of the Methods and Materials and is presented before the Discussion section —although the Results and Discussion are presented together in many journals. This section answers the basic question “What did you find in your research?”
What is included in the Results section?
The Results section should include the findings of your study and ONLY the findings of your study. The findings include:
- Data presented in tables, charts, graphs, and other figures (may be placed into the text or on separate pages at the end of the manuscript)
- A contextual analysis of this data explaining its meaning in sentence form
- All data that corresponds to the central research question(s)
- All secondary findings (secondary outcomes, subgroup analyses, etc.)
If the scope of the study is broad, or if you studied a variety of variables, or if the methodology used yields a wide range of different results, the author should present only those results that are most relevant to the research question stated in the Introduction section .
As a general rule, any information that does not present the direct findings or outcome of the study should be left out of this section. Unless the journal requests that authors combine the Results and Discussion sections, explanations and interpretations should be omitted from the Results.
How are the results organized?
The best way to organize your Results section is “logically.” One logical and clear method of organizing research results is to provide them alongside the research questions—within each research question, present the type of data that addresses that research question.
Let’s look at an example. Your research question is based on a survey among patients who were treated at a hospital and received postoperative care. Let’s say your first research question is:

“What do hospital patients over age 55 think about postoperative care?”
This can actually be represented as a heading within your Results section, though it might be presented as a statement rather than a question:
Attitudes towards postoperative care in patients over the age of 55
Now present the results that address this specific research question first. In this case, perhaps a table illustrating data from a survey. Likert items can be included in this example. Tables can also present standard deviations, probabilities, correlation matrices, etc.
Following this, present a content analysis, in words, of one end of the spectrum of the survey or data table. In our example case, start with the POSITIVE survey responses regarding postoperative care, using descriptive phrases. For example:
“Sixty-five percent of patients over 55 responded positively to the question “ Are you satisfied with your hospital’s postoperative care ?” (Fig. 2)
Include other results such as subcategory analyses. The amount of textual description used will depend on how much interpretation of tables and figures is necessary and how many examples the reader needs in order to understand the significance of your research findings.
Next, present a content analysis of another part of the spectrum of the same research question, perhaps the NEGATIVE or NEUTRAL responses to the survey. For instance:
“As Figure 1 shows, 15 out of 60 patients in Group A responded negatively to Question 2.”
After you have assessed the data in one figure and explained it sufficiently, move on to your next research question. For example:
“How does patient satisfaction correspond to in-hospital improvements made to postoperative care?”

This kind of data may be presented through a figure or set of figures (for instance, a paired T-test table).
Explain the data you present, here in a table, with a concise content analysis:
“The p-value for the comparison between the before and after groups of patients was .03% (Fig. 2), indicating that the greater the dissatisfaction among patients, the more frequent the improvements that were made to postoperative care.”
Let’s examine another example of a Results section from a study on plant tolerance to heavy metal stress . In the Introduction section, the aims of the study are presented as “determining the physiological and morphological responses of Allium cepa L. towards increased cadmium toxicity” and “evaluating its potential to accumulate the metal and its associated environmental consequences.” The Results section presents data showing how these aims are achieved in tables alongside a content analysis, beginning with an overview of the findings:
“Cadmium caused inhibition of root and leave elongation, with increasing effects at higher exposure doses (Fig. 1a-c).”
The figure containing this data is cited in parentheses. Note that this author has combined three graphs into one single figure. Separating the data into separate graphs focusing on specific aspects makes it easier for the reader to assess the findings, and consolidating this information into one figure saves space and makes it easy to locate the most relevant results.

Following this overall summary, the relevant data in the tables is broken down into greater detail in text form in the Results section.
- “Results on the bio-accumulation of cadmium were found to be the highest (17.5 mg kgG1) in the bulb, when the concentration of cadmium in the solution was 1×10G2 M and lowest (0.11 mg kgG1) in the leaves when the concentration was 1×10G3 M.”
Captioning and Referencing Tables and Figures
Tables and figures are central components of your Results section and you need to carefully think about the most effective way to use graphs and tables to present your findings . Therefore, it is crucial to know how to write strong figure captions and to refer to them within the text of the Results section.
The most important advice one can give here as well as throughout the paper is to check the requirements and standards of the journal to which you are submitting your work. Every journal has its own design and layout standards, which you can find in the author instructions on the target journal’s website. Perusing a journal’s published articles will also give you an idea of the proper number, size, and complexity of your figures.
Regardless of which format you use, the figures should be placed in the order they are referenced in the Results section and be as clear and easy to understand as possible. If there are multiple variables being considered (within one or more research questions), it can be a good idea to split these up into separate figures. Subsequently, these can be referenced and analyzed under separate headings and paragraphs in the text.
To create a caption, consider the research question being asked and change it into a phrase. For instance, if one question is “Which color did participants choose?”, the caption might be “Color choice by participant group.” Or in our last research paper example, where the question was “What is the concentration of cadmium in different parts of the onion after 14 days?” the caption reads:
“Fig. 1(a-c): Mean concentration of Cd determined in (a) bulbs, (b) leaves, and (c) roots of onions after a 14-day period.”
Steps for Composing the Results Section
Because each study is unique, there is no one-size-fits-all approach when it comes to designing a strategy for structuring and writing the section of a research paper where findings are presented. The content and layout of this section will be determined by the specific area of research, the design of the study and its particular methodologies, and the guidelines of the target journal and its editors. However, the following steps can be used to compose the results of most scientific research studies and are essential for researchers who are new to preparing a manuscript for publication or who need a reminder of how to construct the Results section.
Step 1 : Consult the guidelines or instructions that the target journal or publisher provides authors and read research papers it has published, especially those with similar topics, methods, or results to your study.
- The guidelines will generally outline specific requirements for the results or findings section, and the published articles will provide sound examples of successful approaches.
- Note length limitations on restrictions on content. For instance, while many journals require the Results and Discussion sections to be separate, others do not—qualitative research papers often include results and interpretations in the same section (“Results and Discussion”).
- Reading the aims and scope in the journal’s “ guide for authors ” section and understanding the interests of its readers will be invaluable in preparing to write the Results section.
Step 2 : Consider your research results in relation to the journal’s requirements and catalogue your results.
- Focus on experimental results and other findings that are especially relevant to your research questions and objectives and include them even if they are unexpected or do not support your ideas and hypotheses.
- Catalogue your findings—use subheadings to streamline and clarify your report. This will help you avoid excessive and peripheral details as you write and also help your reader understand and remember your findings. Create appendices that might interest specialists but prove too long or distracting for other readers.
- Decide how you will structure of your results. You might match the order of the research questions and hypotheses to your results, or you could arrange them according to the order presented in the Methods section. A chronological order or even a hierarchy of importance or meaningful grouping of main themes or categories might prove effective. Consider your audience, evidence, and most importantly, the objectives of your research when choosing a structure for presenting your findings.
Step 3 : Design figures and tables to present and illustrate your data.
- Tables and figures should be numbered according to the order in which they are mentioned in the main text of the paper.
- Information in figures should be relatively self-explanatory (with the aid of captions), and their design should include all definitions and other information necessary for readers to understand the findings without reading all of the text.
- Use tables and figures as a focal point to tell a clear and informative story about your research and avoid repeating information. But remember that while figures clarify and enhance the text, they cannot replace it.
Step 4 : Draft your Results section using the findings and figures you have organized.
- The goal is to communicate this complex information as clearly and precisely as possible; precise and compact phrases and sentences are most effective.
- In the opening paragraph of this section, restate your research questions or aims to focus the reader’s attention to what the results are trying to show. It is also a good idea to summarize key findings at the end of this section to create a logical transition to the interpretation and discussion that follows.
- Try to write in the past tense and the active voice to relay the findings since the research has already been done and the agent is usually clear. This will ensure that your explanations are also clear and logical.
- Make sure that any specialized terminology or abbreviation you have used here has been defined and clarified in the Introduction section .
Step 5 : Review your draft; edit and revise until it reports results exactly as you would like to have them reported to your readers.
- Double-check the accuracy and consistency of all the data, as well as all of the visual elements included.
- Read your draft aloud to catch language errors (grammar, spelling, and mechanics), awkward phrases, and missing transitions.
- Ensure that your results are presented in the best order to focus on objectives and prepare readers for interpretations, valuations, and recommendations in the Discussion section . Look back over the paper’s Introduction and background while anticipating the Discussion and Conclusion sections to ensure that the presentation of your results is consistent and effective.
- Consider seeking additional guidance on your paper. Find additional readers to look over your Results section and see if it can be improved in any way. Peers, professors, or qualified experts can provide valuable insights.
One excellent option is to use a professional English proofreading and editing service such as Wordvice, including our paper editing service . With hundreds of qualified editors from dozens of scientific fields, Wordvice has helped thousands of authors revise their manuscripts and get accepted into their target journals. Read more about the proofreading and editing process before proceeding with getting academic editing services and manuscript editing services for your manuscript.
As the representation of your study’s data output, the Results section presents the core information in your research paper. By writing with clarity and conciseness and by highlighting and explaining the crucial findings of their study, authors increase the impact and effectiveness of their research manuscripts.
For more articles and videos on writing your research manuscript, visit Wordvice’s Resources page.
Wordvice Resources
- How to Write a Research Paper Introduction
- Which Verb Tenses to Use in a Research Paper
- How to Write an Abstract for a Research Paper
- How to Write a Research Paper Title
- Useful Phrases for Academic Writing
- Common Transition Terms in Academic Papers
- Active and Passive Voice in Research Papers
- 100+ Verbs That Will Make Your Research Writing Amazing
- Tips for Paraphrasing in Research Papers
- USC Libraries
- Research Guides
Organizing Your Social Sciences Research Paper
- 7. The Results
- Purpose of Guide
- Design Flaws to Avoid
- Independent and Dependent Variables
- Glossary of Research Terms
- Reading Research Effectively
- Narrowing a Topic Idea
- Broadening a Topic Idea
- Extending the Timeliness of a Topic Idea
- Academic Writing Style
- Applying Critical Thinking
- Choosing a Title
- Making an Outline
- Paragraph Development
- Research Process Video Series
- Executive Summary
- The C.A.R.S. Model
- Background Information
- The Research Problem/Question
- Theoretical Framework
- Citation Tracking
- Content Alert Services
- Evaluating Sources
- Primary Sources
- Secondary Sources
- Tiertiary Sources
- Scholarly vs. Popular Publications
- Qualitative Methods
- Quantitative Methods
- Insiderness
- Using Non-Textual Elements
- Limitations of the Study
- Common Grammar Mistakes
- Writing Concisely
- Avoiding Plagiarism
- Footnotes or Endnotes?
- Further Readings
- Generative AI and Writing
- USC Libraries Tutorials and Other Guides
- Bibliography
The results section is where you report the findings of your study based upon the methodology [or methodologies] you applied to gather information. The results section should state the findings of the research arranged in a logical sequence without bias or interpretation. A section describing results should be particularly detailed if your paper includes data generated from your own research.
Annesley, Thomas M. "Show Your Cards: The Results Section and the Poker Game." Clinical Chemistry 56 (July 2010): 1066-1070.
Importance of a Good Results Section
When formulating the results section, it's important to remember that the results of a study do not prove anything . Findings can only confirm or reject the hypothesis underpinning your study. However, the act of articulating the results helps you to understand the problem from within, to break it into pieces, and to view the research problem from various perspectives.
The page length of this section is set by the amount and types of data to be reported . Be concise. Use non-textual elements appropriately, such as figures and tables, to present findings more effectively. In deciding what data to describe in your results section, you must clearly distinguish information that would normally be included in a research paper from any raw data or other content that could be included as an appendix. In general, raw data that has not been summarized should not be included in the main text of your paper unless requested to do so by your professor.
Avoid providing data that is not critical to answering the research question . The background information you described in the introduction section should provide the reader with any additional context or explanation needed to understand the results. A good strategy is to always re-read the background section of your paper after you have written up your results to ensure that the reader has enough context to understand the results [and, later, how you interpreted the results in the discussion section of your paper that follows].
Bavdekar, Sandeep B. and Sneha Chandak. "Results: Unraveling the Findings." Journal of the Association of Physicians of India 63 (September 2015): 44-46; Brett, Paul. "A Genre Analysis of the Results Section of Sociology Articles." English for Specific Speakers 13 (1994): 47-59; Go to English for Specific Purposes on ScienceDirect;Burton, Neil et al. Doing Your Education Research Project . Los Angeles, CA: SAGE, 2008; Results. The Structure, Format, Content, and Style of a Journal-Style Scientific Paper. Department of Biology. Bates College; Kretchmer, Paul. Twelve Steps to Writing an Effective Results Section. San Francisco Edit; "Reporting Findings." In Making Sense of Social Research Malcolm Williams, editor. (London;: SAGE Publications, 2003) pp. 188-207.
Structure and Writing Style
I. Organization and Approach
For most research papers in the social and behavioral sciences, there are two possible ways of organizing the results . Both approaches are appropriate in how you report your findings, but use only one approach.
- Present a synopsis of the results followed by an explanation of key findings . This approach can be used to highlight important findings. For example, you may have noticed an unusual correlation between two variables during the analysis of your findings. It is appropriate to highlight this finding in the results section. However, speculating as to why this correlation exists and offering a hypothesis about what may be happening belongs in the discussion section of your paper.
- Present a result and then explain it, before presenting the next result then explaining it, and so on, then end with an overall synopsis . This is the preferred approach if you have multiple results of equal significance. It is more common in longer papers because it helps the reader to better understand each finding. In this model, it is helpful to provide a brief conclusion that ties each of the findings together and provides a narrative bridge to the discussion section of the your paper.
NOTE: Just as the literature review should be arranged under conceptual categories rather than systematically describing each source, you should also organize your findings under key themes related to addressing the research problem. This can be done under either format noted above [i.e., a thorough explanation of the key results or a sequential, thematic description and explanation of each finding].
II. Content
In general, the content of your results section should include the following:
- Introductory context for understanding the results by restating the research problem underpinning your study . This is useful in re-orientating the reader's focus back to the research problem after having read a review of the literature and your explanation of the methods used for gathering and analyzing information.
- Inclusion of non-textual elements, such as, figures, charts, photos, maps, tables, etc. to further illustrate key findings, if appropriate . Rather than relying entirely on descriptive text, consider how your findings can be presented visually. This is a helpful way of condensing a lot of data into one place that can then be referred to in the text. Consider referring to appendices if there is a lot of non-textual elements.
- A systematic description of your results, highlighting for the reader observations that are most relevant to the topic under investigation . Not all results that emerge from the methodology used to gather information may be related to answering the " So What? " question. Do not confuse observations with interpretations; observations in this context refers to highlighting important findings you discovered through a process of reviewing prior literature and gathering data.
- The page length of your results section is guided by the amount and types of data to be reported . However, focus on findings that are important and related to addressing the research problem. It is not uncommon to have unanticipated results that are not relevant to answering the research question. This is not to say that you don't acknowledge tangential findings and, in fact, can be referred to as areas for further research in the conclusion of your paper. However, spending time in the results section describing tangential findings clutters your overall results section and distracts the reader.
- A short paragraph that concludes the results section by synthesizing the key findings of the study . Highlight the most important findings you want readers to remember as they transition into the discussion section. This is particularly important if, for example, there are many results to report, the findings are complicated or unanticipated, or they are impactful or actionable in some way [i.e., able to be pursued in a feasible way applied to practice].
NOTE: Always use the past tense when referring to your study's findings. Reference to findings should always be described as having already happened because the method used to gather the information has been completed.
III. Problems to Avoid
When writing the results section, avoid doing the following :
- Discussing or interpreting your results . Save this for the discussion section of your paper, although where appropriate, you should compare or contrast specific results to those found in other studies [e.g., "Similar to the work of Smith [1990], one of the findings of this study is the strong correlation between motivation and academic achievement...."].
- Reporting background information or attempting to explain your findings. This should have been done in your introduction section, but don't panic! Often the results of a study point to the need for additional background information or to explain the topic further, so don't think you did something wrong. Writing up research is rarely a linear process. Always revise your introduction as needed.
- Ignoring negative results . A negative result generally refers to a finding that does not support the underlying assumptions of your study. Do not ignore them. Document these findings and then state in your discussion section why you believe a negative result emerged from your study. Note that negative results, and how you handle them, can give you an opportunity to write a more engaging discussion section, therefore, don't be hesitant to highlight them.
- Including raw data or intermediate calculations . Ask your professor if you need to include any raw data generated by your study, such as transcripts from interviews or data files. If raw data is to be included, place it in an appendix or set of appendices that are referred to in the text.
- Be as factual and concise as possible in reporting your findings . Do not use phrases that are vague or non-specific, such as, "appeared to be greater than other variables..." or "demonstrates promising trends that...." Subjective modifiers should be explained in the discussion section of the paper [i.e., why did one variable appear greater? Or, how does the finding demonstrate a promising trend?].
- Presenting the same data or repeating the same information more than once . If you want to highlight a particular finding, it is appropriate to do so in the results section. However, you should emphasize its significance in relation to addressing the research problem in the discussion section. Do not repeat it in your results section because you can do that in the conclusion of your paper.
- Confusing figures with tables . Be sure to properly label any non-textual elements in your paper. Don't call a chart an illustration or a figure a table. If you are not sure, go here .
Annesley, Thomas M. "Show Your Cards: The Results Section and the Poker Game." Clinical Chemistry 56 (July 2010): 1066-1070; Bavdekar, Sandeep B. and Sneha Chandak. "Results: Unraveling the Findings." Journal of the Association of Physicians of India 63 (September 2015): 44-46; Burton, Neil et al. Doing Your Education Research Project . Los Angeles, CA: SAGE, 2008; Caprette, David R. Writing Research Papers. Experimental Biosciences Resources. Rice University; Hancock, Dawson R. and Bob Algozzine. Doing Case Study Research: A Practical Guide for Beginning Researchers . 2nd ed. New York: Teachers College Press, 2011; Introduction to Nursing Research: Reporting Research Findings. Nursing Research: Open Access Nursing Research and Review Articles. (January 4, 2012); Kretchmer, Paul. Twelve Steps to Writing an Effective Results Section. San Francisco Edit ; Ng, K. H. and W. C. Peh. "Writing the Results." Singapore Medical Journal 49 (2008): 967-968; Reporting Research Findings. Wilder Research, in partnership with the Minnesota Department of Human Services. (February 2009); Results. The Structure, Format, Content, and Style of a Journal-Style Scientific Paper. Department of Biology. Bates College; Schafer, Mickey S. Writing the Results. Thesis Writing in the Sciences. Course Syllabus. University of Florida.
Writing Tip
Why Don't I Just Combine the Results Section with the Discussion Section?
It's not unusual to find articles in scholarly social science journals where the author(s) have combined a description of the findings with a discussion about their significance and implications. You could do this. However, if you are inexperienced writing research papers, consider creating two distinct sections for each section in your paper as a way to better organize your thoughts and, by extension, your paper. Think of the results section as the place where you report what your study found; think of the discussion section as the place where you interpret the information and answer the "So What?" question. As you become more skilled writing research papers, you can consider melding the results of your study with a discussion of its implications.
Driscoll, Dana Lynn and Aleksandra Kasztalska. Writing the Experimental Report: Methods, Results, and Discussion. The Writing Lab and The OWL. Purdue University.
- << Previous: Insiderness
- Next: Using Non-Textual Elements >>
- Last Updated: Jun 18, 2024 10:45 AM
- URL: https://libguides.usc.edu/writingguide

- Manuscript Preparation
How to write the results section of a research paper
- 3 minute read
- 69.5K views
Table of Contents
At its core, a research paper aims to fill a gap in the research on a given topic. As a result, the results section of the paper, which describes the key findings of the study, is often considered the core of the paper. This is the section that gets the most attention from reviewers, peers, students, and any news organization reporting on your findings. Writing a clear, concise, and logical results section is, therefore, one of the most important parts of preparing your manuscript.
Difference between results and discussion
Before delving into how to write the results section, it is important to first understand the difference between the results and discussion sections. The results section needs to detail the findings of the study. The aim of this section is not to draw connections between the different findings or to compare it to previous findings in literature—that is the purview of the discussion section. Unlike the discussion section, which can touch upon the hypothetical, the results section needs to focus on the purely factual. In some cases, it may even be preferable to club these two sections together into a single section. For example, while writing a review article, it can be worthwhile to club these two sections together, as the main results in this case are the conclusions that can be drawn from the literature.
Structure of the results section
Although the main purpose of the results section in a research paper is to report the findings, it is necessary to present an introduction and repeat the research question. This establishes a connection to the previous section of the paper and creates a smooth flow of information.
Next, the results section needs to communicate the findings of your research in a systematic manner. The section needs to be organized such that the primary research question is addressed first, then the secondary research questions. If the research addresses multiple questions, the results section must individually connect with each of the questions. This ensures clarity and minimizes confusion while reading.
Consider representing your results visually. For example, graphs, tables, and other figures can help illustrate the findings of your paper, especially if there is a large amount of data in the results.
Remember, an appealing results section can help peer reviewers better understand the merits of your research, thereby increasing your chances of publication.
Practical guidance for writing an effective results section for a research paper
- Always use simple and clear language. Avoid the use of uncertain or out-of-focus expressions.
- The findings of the study must be expressed in an objective and unbiased manner. While it is acceptable to correlate certain findings in the discussion section, it is best to avoid overinterpreting the results.
- If the research addresses more than one hypothesis, use sub-sections to describe the results. This prevents confusion and promotes understanding.
- Ensure that negative results are included in this section, even if they do not support the research hypothesis.
- Wherever possible, use illustrations like tables, figures, charts, or other visual representations to showcase the results of your research paper. Mention these illustrations in the text, but do not repeat the information that they convey.
- For statistical data, it is adequate to highlight the tests and explain their results. The initial or raw data should not be mentioned in the results section of a research paper.
The results section of a research paper is usually the most impactful section because it draws the greatest attention. Regardless of the subject of your research paper, a well-written results section is capable of generating interest in your research.
For detailed information and assistance on writing the results of a research paper, refer to Elsevier Author Services.

- Research Process
Writing a good review article

Why is data validation important in research?
You may also like.

Page-Turner Articles are More Than Just Good Arguments: Be Mindful of Tone and Structure!

A Must-see for Researchers! How to Ensure Inclusivity in Your Scientific Writing

Make Hook, Line, and Sinker: The Art of Crafting Engaging Introductions

Can Describing Study Limitations Improve the Quality of Your Paper?

A Guide to Crafting Shorter, Impactful Sentences in Academic Writing

6 Steps to Write an Excellent Discussion in Your Manuscript

How to Write Clear and Crisp Civil Engineering Papers? Here are 5 Key Tips to Consider

The Clear Path to An Impactful Paper: ②
Input your search keywords and press Enter.

An official website of the United States government
The .gov means it’s official. Federal government websites often end in .gov or .mil. Before sharing sensitive information, make sure you’re on a federal government site.
The site is secure. The https:// ensures that you are connecting to the official website and that any information you provide is encrypted and transmitted securely.
- Publications
- Account settings
- My Bibliography
- Collections
- Citation manager
Save citation to file
Email citation, add to collections.
- Create a new collection
- Add to an existing collection
Add to My Bibliography
Your saved search, create a file for external citation management software, your rss feed.
- Search in PubMed
- Search in NLM Catalog
- Add to Search
How to Write an Effective Results Section
Affiliation.
- 1 Rothman Orthopaedics Institute, Philadelphia, PA.
- PMID: 31145152
- DOI: 10.1097/BSD.0000000000000845
Developing a well-written research paper is an important step in completing a scientific study. This paper is where the principle investigator and co-authors report the purpose, methods, findings, and conclusions of the study. A key element of writing a research paper is to clearly and objectively report the study's findings in the Results section. The Results section is where the authors inform the readers about the findings from the statistical analysis of the data collected to operationalize the study hypothesis, optimally adding novel information to the collective knowledge on the subject matter. By utilizing clear, concise, and well-organized writing techniques and visual aids in the reporting of the data, the author is able to construct a case for the research question at hand even without interpreting the data.
PubMed Disclaimer
Similar articles
- How to Write Effective Discussion and Conclusion Sections. Makar G, Foltz C, Lendner M, Vaccaro AR. Makar G, et al. Clin Spine Surg. 2018 Oct;31(8):345-346. doi: 10.1097/BSD.0000000000000687. Clin Spine Surg. 2018. PMID: 29979216
- How to write an original radiological research manuscript. Bannas P, Reeder SB. Bannas P, et al. Eur Radiol. 2017 Nov;27(11):4455-4460. doi: 10.1007/s00330-017-4879-8. Epub 2017 Jun 14. Eur Radiol. 2017. PMID: 28616726 Free PMC article. Review.
- Rules to be adopted for publishing a scientific paper. Picardi N. Picardi N. Ann Ital Chir. 2016;87:1-3. Ann Ital Chir. 2016. PMID: 28474609
- The rites of writing papers: steps to successful publishing for psychiatrists. Brakoulias V, Macfarlane MD, Looi JC. Brakoulias V, et al. Australas Psychiatry. 2015 Feb;23(1):32-6. doi: 10.1177/1039856214560180. Epub 2014 Dec 2. Australas Psychiatry. 2015. PMID: 25469001
- How to write a research paper. Alexandrov AV. Alexandrov AV. Cerebrovasc Dis. 2004;18(2):135-8. doi: 10.1159/000079266. Epub 2004 Jun 23. Cerebrovasc Dis. 2004. PMID: 15218279 Review.
- Essential Guide to Manuscript Writing for Academic Dummies: An Editor's Perspective. Aga SS, Nissar S. Aga SS, et al. Biochem Res Int. 2022 Sep 1;2022:1492058. doi: 10.1155/2022/1492058. eCollection 2022. Biochem Res Int. 2022. PMID: 36092536 Free PMC article. Review.
- Search in MeSH
LinkOut - more resources
Full text sources.
- Ovid Technologies, Inc.
- Wolters Kluwer

- Citation Manager
NCBI Literature Resources
MeSH PMC Bookshelf Disclaimer
The PubMed wordmark and PubMed logo are registered trademarks of the U.S. Department of Health and Human Services (HHS). Unauthorized use of these marks is strictly prohibited.

- Langson Library
- Science Library
- Grunigen Medical Library
- Law Library
- Connect From Off-Campus
- Accessibility
- Gateway Study Center
Email this link
Writing a scientific paper.
- Writing a lab report
- INTRODUCTION
Writing a "good" results section
Figures and Captions in Lab Reports
"Results Checklist" from: How to Write a Good Scientific Paper. Chris A. Mack. SPIE. 2018.
Additional tips for results sections.
- LITERATURE CITED
- Bibliography of guides to scientific writing and presenting
- Peer Review
- Presentations
- Lab Report Writing Guides on the Web
This is the core of the paper. Don't start the results sections with methods you left out of the Materials and Methods section. You need to give an overall description of the experiments and present the data you found.
- Factual statements supported by evidence. Short and sweet without excess words
- Present representative data rather than endlessly repetitive data
- Discuss variables only if they had an effect (positive or negative)
- Use meaningful statistics
- Avoid redundancy. If it is in the tables or captions you may not need to repeat it
A short article by Dr. Brett Couch and Dr. Deena Wassenberg, Biology Program, University of Minnesota
- Present the results of the paper, in logical order, using tables and graphs as necessary.
- Explain the results and show how they help to answer the research questions posed in the Introduction. Evidence does not explain itself; the results must be presented and then explained.
- Avoid: presenting results that are never discussed; presenting results in chronological order rather than logical order; ignoring results that do not support the conclusions;
- Number tables and figures separately beginning with 1 (i.e. Table 1, Table 2, Figure 1, etc.).
- Do not attempt to evaluate the results in this section. Report only what you found; hold all discussion of the significance of the results for the Discussion section.
- It is not necessary to describe every step of your statistical analyses. Scientists understand all about null hypotheses, rejection rules, and so forth and do not need to be reminded of them. Just say something like, "Honeybees did not use the flowers in proportion to their availability (X2 = 7.9, p<0.05, d.f.= 4, chi-square test)." Likewise, cite tables and figures without describing in detail how the data were manipulated. Explanations of this sort should appear in a legend or caption written on the same page as the figure or table.
- You must refer in the text to each figure or table you include in your paper.
- Tables generally should report summary-level data, such as means ± standard deviations, rather than all your raw data. A long list of all your individual observations will mean much less than a few concise, easy-to-read tables or figures that bring out the main findings of your study.
- Only use a figure (graph) when the data lend themselves to a good visual representation. Avoid using figures that show too many variables or trends at once, because they can be hard to understand.
From: https://writingcenter.gmu.edu/guides/imrad-results-discussion
- << Previous: METHODS
- Next: DISCUSSION >>
- Last Updated: Aug 4, 2023 9:33 AM
- URL: https://guides.lib.uci.edu/scientificwriting
Off-campus? Please use the Software VPN and choose the group UCIFull to access licensed content. For more information, please Click here
Software VPN is not available for guests, so they may not have access to some content when connecting from off-campus.
From Data to Discovery: The Findings Section of a Research Paper
Discover the role of the findings section of a research paper here. Explore strategies and techniques to maximize your understanding.

Are you curious about the Findings section of a research paper? Did you know that this is a part where all the juicy results and discoveries are laid out for the world to see? Undoubtedly, the findings section of a research paper plays a critical role in presenting and interpreting the collected data. It serves as a comprehensive account of the study’s results and their implications.
Well, look no further because we’ve got you covered! In this article, we’re diving into the ins and outs of presenting and interpreting data in the findings section. We’ll be sharing tips and tricks on how to effectively present your findings, whether it’s through tables, graphs, or good old descriptive statistics.
Overview of the Findings Section of a Research Paper
The findings section of a research paper presents the results and outcomes of the study or investigation. It is a crucial part of the research paper where researchers interpret and analyze the data collected and draw conclusions based on their findings. This section aims to answer the research questions or hypotheses formulated earlier in the paper and provide evidence to support or refute them.
In the findings section, researchers typically present the data clearly and organized. They may use tables, graphs, charts, or other visual aids to illustrate the patterns, trends, or relationships observed in the data. The findings should be presented objectively, without any bias or personal opinions, and should be accompanied by appropriate statistical analyses or methods to ensure the validity and reliability of the results.
Organizing the Findings Section
The findings section of the research paper organizes and presents the results obtained from the study in a clear and logical manner. Here is a suggested structure for organizing the Findings section:
Introduction to the Findings
Start the section by providing a brief overview of the research objectives and the methodology employed. Recapitulate the research questions or hypotheses addressed in the study.
To learn more about methodology, read this article .
Descriptive Statistics and Data Presentation
Present the collected data using appropriate descriptive statistics. This may involve using tables, graphs, charts, or other visual representations to convey the information effectively. Remember: we can easily help you with that.
Data Analysis and Interpretation
Perform a thorough analysis of the data collected and describe the key findings. Present the results of statistical analyses or any other relevant methods used to analyze the data.
Discussion of Findings
Analyze and interpret the findings in the context of existing literature or theoretical frameworks . Discuss any patterns, trends, or relationships observed in the data. Compare and contrast the results with prior studies, highlighting similarities and differences.
Limitations and Constraints
Acknowledge and discuss any limitations or constraints that may have influenced the findings. This could include issues such as sample size, data collection methods, or potential biases.
Summarize the main findings of the study and emphasize their significance. Revisit the research questions or hypotheses and discuss whether they have been supported or refuted by the findings.
Presenting Data in the Findings Section
There are several ways to present data in the findings section of a research paper. Here are some common methods:
- Tables : Tables are commonly used to present organized and structured data. They are particularly useful when presenting numerical data with multiple variables or categories. Tables allow readers to easily compare and interpret the information presented. Learn how to cite tables in research papers here .
- Graphs and Charts: Graphs and charts are effective visual tools for presenting data, especially when illustrating trends, patterns, or relationships. Common types include bar graphs, line graphs, scatter plots, pie charts, and histograms. Graphs and charts provide a visual representation of the data, making it easier for readers to comprehend and interpret.
- Figures and Images: Figures and images can be used to present data that requires visual representation, such as maps, diagrams, or experimental setups. They can enhance the understanding of complex data or provide visual evidence to support the research findings.
- Descriptive Statistics: Descriptive statistics provide summary measures of central tendency (e.g., mean, median, mode) and dispersion (e.g., standard deviation, range) for numerical data. These statistics can be included in the text or presented in tables or graphs to provide a concise summary of the data distribution.
How to Effectively Interpret Results
Interpreting the results is a crucial aspect of the findings section in a research paper. It involves analyzing the data collected and drawing meaningful conclusions based on the findings. Following are the guidelines on how to effectively interpret the results.
Step 1 – Begin with a Recap
Start by restating the research questions or hypotheses to provide context for the interpretation. Remind readers of the specific objectives of the study to help them understand the relevance of the findings.
Step 2 – Relate Findings to Research Questions
Clearly articulate how the results address the research questions or hypotheses. Discuss each finding in relation to the original objectives and explain how it contributes to answering the research questions or supporting/refuting the hypotheses.
Step 3 – Compare with Existing Literature
Compare and contrast the findings with previous studies or existing literature. Highlight similarities, differences, or discrepancies between your results and those of other researchers. Discuss any consistencies or contradictions and provide possible explanations for the observed variations.
Step 4 – Consider Limitations and Alternative Explanations
Acknowledge the limitations of the study and discuss how they may have influenced the results. Explore alternative explanations or factors that could potentially account for the findings. Evaluate the robustness of the results in light of the limitations and alternative interpretations.
Step 5 – Discuss Implications and Significance
Highlight any potential applications or areas where further research is needed based on the outcomes of the study.
Step 6 – Address Inconsistencies and Contradictions
If there are any inconsistencies or contradictions in the findings, address them directly. Discuss possible reasons for the discrepancies and consider their implications for the overall interpretation. Be transparent about any uncertainties or unresolved issues.
Step 7 – Be Objective and Data-Driven
Present the interpretation objectively, based on the evidence and data collected. Avoid personal biases or subjective opinions. Use logical reasoning and sound arguments to support your interpretations.
Reporting Statistical Significance
When reporting statistical significance in the findings section of a research paper, it is important to accurately convey the results of statistical analyses and their implications. Here are some guidelines on how to report statistical significance effectively:
- Clearly State the Statistical Test: Begin by clearly stating the specific statistical test or analysis used to determine statistical significance. For example, you might mention that a t-test, chi-square test, ANOVA, correlation analysis, or regression analysis was employed.
- Report the Test Statistic: Provide the value of the test statistic obtained from the analysis. This could be the t-value, F-value, chi-square value, correlation coefficient, or any other relevant statistic depending on the test used.
- State the Degrees of Freedom: Indicate the degrees of freedom associated with the statistical test. Degrees of freedom represent the number of independent pieces of information available for estimating a statistic. For example, in a t-test, degrees of freedom would be mentioned as (df = n1 + n2 – 2) for an independent samples test or (df = N – 2) for a paired samples test.
- Report the p-value: The p-value indicates the probability of obtaining results as extreme or more extreme than the observed results, assuming the null hypothesis is true. Report the p-value associated with the statistical test. For example, p < 0.05 denotes statistical significance at the conventional level of α = 0.05.
- Provide the Conclusion: Based on the p-value obtained, state whether the results are statistically significant or not. If the p-value is less than the predetermined threshold (e.g., p < 0.05), state that the results are statistically significant. If the p-value is greater than the threshold, state that the results are not statistically significant.
- Discuss the Interpretation: After reporting statistical significance, discuss the practical or theoretical implications of the finding. Explain what the significant result means in the context of your research questions or hypotheses. Address the effect size and practical significance of the findings, if applicable.
- Consider Effect Size Measures: Along with statistical significance, it is often important to report effect size measures. Effect size quantifies the magnitude of the relationship or difference observed in the data. Common effect size measures include Cohen’s d, eta-squared, or Pearson’s r. Reporting effect size provides additional meaningful information about the strength of the observed effects.
- Be Accurate and Transparent: Ensure that the reported statistical significance and associated values are accurate. Avoid misinterpreting or misrepresenting the results. Be transparent about the statistical tests conducted, any assumptions made, and potential limitations or caveats that may impact the interpretation of the significant results.
Conclusion of the Findings Section
The conclusion of the findings section in a research paper serves as a summary and synthesis of the key findings and their implications. It is an opportunity to tie together the results, discuss their significance, and address the research objectives. Here are some guidelines on how to write the conclusion of the Findings section:
Summarize the Key Findings
Begin by summarizing the main findings of the study. Provide a concise overview of the significant results, patterns, or relationships that emerged from the data analysis. Highlight the most important findings that directly address the research questions or hypotheses.
Revisit the Research Objectives
Remind the reader of the research objectives stated at the beginning of the paper. Discuss how the findings contribute to achieving those objectives and whether they support or challenge the initial research questions or hypotheses.
Suggest Future Directions
Identify areas for further research or future directions based on the findings. Discuss any unanswered questions, unresolved issues, or new avenues of inquiry that emerged during the study. Propose potential research opportunities that can build upon the current findings.
The Best Scientific Figures to Represent Your Findings
Have you heard of any tool that helps you represent your findings through visuals like graphs, pie charts, and infographics? Well, if you haven’t, then here’s the tool you need to explore – Mind the Graph . It’s the tool that has the best scientific figures to represent your findings. Go, try it now, and make your research findings stand out!

Subscribe to our newsletter
Exclusive high quality content about effective visual communication in science.
About Sowjanya Pedada
Sowjanya is a passionate writer and an avid reader. She holds MBA in Agribusiness Management and now is working as a content writer. She loves to play with words and hopes to make a difference in the world through her writings. Apart from writing, she is interested in reading fiction novels and doing craftwork. She also loves to travel and explore different cuisines and spend time with her family and friends.
Content tags
Organizing Academic Research Papers: 7. The Results
- Purpose of Guide
- Design Flaws to Avoid
- Glossary of Research Terms
- Narrowing a Topic Idea
- Broadening a Topic Idea
- Extending the Timeliness of a Topic Idea
- Academic Writing Style
- Choosing a Title
- Making an Outline
- Paragraph Development
- Executive Summary
- Background Information
- The Research Problem/Question
- Theoretical Framework
- Citation Tracking
- Content Alert Services
- Evaluating Sources
- Primary Sources
- Secondary Sources
- Tertiary Sources
- What Is Scholarly vs. Popular?
- Qualitative Methods
- Quantitative Methods
- Using Non-Textual Elements
- Limitations of the Study
- Common Grammar Mistakes
- Avoiding Plagiarism
- Footnotes or Endnotes?
- Further Readings
- Annotated Bibliography
- Dealing with Nervousness
- Using Visual Aids
- Grading Someone Else's Paper
- How to Manage Group Projects
- Multiple Book Review Essay
- Reviewing Collected Essays
- About Informed Consent
- Writing Field Notes
- Writing a Policy Memo
- Writing a Research Proposal
- Acknowledgements
The results section of the research paper is where you report the findings of your study based upon the information gathered as a result of the methodology [or methodologies] you applied. The results section should simply state the findings, without bias or interpretation, and arranged in a logical sequence. The results section should always be written in the past tense. A section describing results [a.k.a., "findings"] is particularly necessary if your paper includes data generated from your own research.
Importance of a Good Results Section
When formulating the results section, it's important to remember that the results of a study do not prove anything . Research results can only confirm or reject the research problem underpinning your study. However, the act of articulating the results helps you to understand the problem from within, to break it into pieces, and to view the research problem from various perspectives.
The page length of this section is set by the amount and types of data to be reported . Be concise, using non-textual elements, such as figures and tables, if appropriate, to present results more effectively. In deciding what data to describe in your results section, you must clearly distinguish material that would normally be included in a research paper from any raw data or other material that could be included as an appendix. In general, raw data should not be included in the main text of your paper unless requested to do so by your professor.
Avoid providing data that is not critical to answering the research question . The background information you described in the introduction section should provide the reader with any additional context or explanation needed to understand the results. A good rule is to always re-read the background section of your paper after you have written up your results to ensure that the reader has enough context to understand the results [and, later, how you interpreted the results in the discussion section of your paper].
Bates College; Burton, Neil et al. Doing Your Education Research Project . Los Angeles, CA: SAGE, 2008; Results . The Structure, Format, Content, and Style of a Journal-Style Scientific Paper. Department of Biology. Bates College.
Structure and Writing Style
I. Structure and Approach
For most research paper formats, there are two ways of presenting and organizing the results .
- Present the results followed by a short explanation of the findings . For example, you may have noticed an unusual correlation between two variables during the analysis of your findings. It is correct to point this out in the results section. However, speculating as to why this correlation exists, and offering a hypothesis about what may be happening, belongs in the discussion section of your paper.
- Present a section and then discuss it, before presenting the next section then discussing it, and so on . This is more common in longer papers because it helps the reader to better understand each finding. In this model, it can be helpful to provide a brief conclusion in the results section that ties each of the findings together and links to the discussion.
NOTE: The discussion section should generally follow the same format chosen in presenting and organizing the results.
II. Content
In general, the content of your results section should include the following elements:
- An introductory context for understanding the results by restating the research problem that underpins the purpose of your study.
- A summary of your key findings arranged in a logical sequence that generally follows your methodology section.
- Inclusion of non-textual elements, such as, figures, charts, photos, maps, tables, etc. to further illustrate the findings, if appropriate.
- In the text, a systematic description of your results, highlighting for the reader observations that are most relevant to the topic under investigation [remember that not all results that emerge from the methodology that you used to gather the data may be relevant].
- Use of the past tense when refering to your results.
- The page length of your results section is guided by the amount and types of data to be reported. However, focus only on findings that are important and related to addressing the research problem.
Using Non-textual Elements
- Either place figures, tables, charts, etc. within the text of the result, or include them in the back of the report--do one or the other but never do both.
- In the text, refer to each non-textual element in numbered order [e.g., Table 1, Table 2; Chart 1, Chart 2; Map 1, Map 2].
- If you place non-textual elements at the end of the report, make sure they are clearly distinguished from any attached appendix materials, such as raw data.
- Regardless of placement, each non-textual element must be numbered consecutively and complete with caption [caption goes under the figure, table, chart, etc.]
- Each non-textual element must be titled, numbered consecutively, and complete with a heading [title with description goes above the figure, table, chart, etc.].
- In proofreading your results section, be sure that each non-textual element is sufficiently complete so that it could stand on its own, separate from the text.
III. Problems to Avoid
When writing the results section, avoid doing the following :
- Discussing or interpreting your results . Save all this for the next section of your paper, although where appropriate, you should compare or contrast specific results to those found in other studies [e.g., "Similar to Smith [1990], one of the findings of this study is the strong correlation between motivation and academic achievement...."].
- Reporting background information or attempting to explain your findings ; this should have been done in your Introduction section, but don't panic! Often the results of a study point to the need to provide additional background information or to explain the topic further, so don't think you did something wrong. Revise your introduction as needed.
- Ignoring negative results . If some of your results fail to support your hypothesis, do not ignore them. Document them, then state in your discussion section why you believe a negative result emerged from your study. Note that negative results, and how you handle them, often provides you with the opportunity to write a more engaging discussion section, therefore, don't be afraid to highlight them.
- Including raw data or intermediate calculations . Ask your professor if you need to include any raw data generated by your study, such as transcripts from interviews or data files. If raw data is to be included, place it in an appendix or set of appendices that are referred to in the text.
- Be as factual and concise as possible in reporting your findings . Do not use phrases that are vague or non-specific, such as, "appeared to be greater or lesser than..." or "demonstrates promising trends that...."
- Presenting the same data or repeating the same information more than once . If you feel the need to highlight something, you will have a chance to do that in the discussion section.
- Confusing figures with tables . Be sure to properly label any non-textual elements in your paper. If you are not sure, look up the term in a dictionary.
Burton, Neil et al. Doing Your Education Research Project . Los Angeles, CA: SAGE, 2008; Caprette, David R. Writing Research Papers . Experimental Biosciences Resources. Rice University; Hancock, Dawson R. and Bob Algozzine. Doing Case Study Research: A Practical Guide for Beginning Researchers . 2nd ed. New York: Teachers College Press, 2011; Introduction to Nursing Research: Reporting Research Findings. Nursing Research: Open Access Nursing Research and Review Articles. (January 4, 2012); Reporting Research Findings. Wilder Research, in partnership with the Minnesota Department of Human Services. (February 2009); Results . The Structure, Format, Content, and Style of a Journal-Style Scientific Paper. Department of Biology. Bates College; Schafer, Mickey S. Writing the Results . Thesis Writing in the Sciences. Course Syllabus. University of Florida.
Writing Tip
Why Don't I Just Combine the Results Section with the Discussion Section?
It's not unusual to find articles in social science journals where the author(s) have combined a description of the findings from the study with a discussion about their implications. You could do this. However, if you are inexperienced writing research papers, consider creating two sections for each element in your paper as a way to better organize your thoughts and, by extension, your paper. Think of the results section as the place where you report what your study found; think of the discussion section as the place where you interpret your data and answer the "so what?" question. As you become more skilled writing research papers, you may want to meld the results of your study with a discussion of its implications.
- << Previous: Quantitative Methods
- Next: Using Non-Textual Elements >>
- Last Updated: Jul 18, 2023 11:58 AM
- URL: https://library.sacredheart.edu/c.php?g=29803
- QuickSearch
- Library Catalog
- Databases A-Z
- Publication Finder
- Course Reserves
- Citation Linker
- Digital Commons
- Our Website
Research Support
- Ask a Librarian
- Appointments
- Interlibrary Loan (ILL)
- Research Guides
- Databases by Subject
- Citation Help
Using the Library
- Reserve a Group Study Room
- Renew Books
- Honors Study Rooms
- Off-Campus Access
- Library Policies
- Library Technology
User Information
- Grad Students
- Online Students
- COVID-19 Updates
- Staff Directory
- News & Announcements
- Library Newsletter
My Accounts
- Interlibrary Loan
- Staff Site Login
FIND US ON
Data analysis write-ups
What should a data-analysis write-up look like.
Writing up the results of a data analysis is not a skill that anyone is born with. It requires practice and, at least in the beginning, a bit of guidance.
Organization
When writing your report, organization will set you free. A good outline is: 1) overview of the problem, 2) your data and modeling approach, 3) the results of your data analysis (plots, numbers, etc), and 4) your substantive conclusions.
1) Overview Describe the problem. What substantive question are you trying to address? This needn’t be long, but it should be clear.
2) Data and model What data did you use to address the question, and how did you do it? When describing your approach, be specific. For example:
- Don’t say, “I ran a regression” when you instead can say, “I fit a linear regression model to predict price that included a house’s size and neighborhood as predictors.”
- Justify important features of your modeling approach. For example: “Neighborhood was included as a categorical predictor in the model because Figure 2 indicated clear differences in price across the neighborhoods.”
Sometimes your Data and Model section will contain plots or tables, and sometimes it won’t. If you feel that a plot helps the reader understand the problem or data set itself—as opposed to your results—then go ahead and include it. A great example here is Tables 1 and 2 in the main paper on the PREDIMED study . These tables help the reader understand some important properties of the data and approach, but not the results of the study itself.
3) Results In your results section, include any figures and tables necessary to make your case. Label them (Figure 1, 2, etc), give them informative captions, and refer to them in the text by their numbered labels where you discuss them. Typical things to include here may include: pictures of the data; pictures and tables that show the fitted model; tables of model coefficients and summaries.
4) Conclusion What did you learn from the analysis? What is the answer, if any, to the question you set out to address?
General advice
Make the sections as short or long as they need to be. For example, a conclusions section is often pretty short, while a results section is usually a bit longer.
It’s OK to use the first person to avoid awkward or bizarre sentence constructions, but try to do so sparingly.
Do not include computer code unless explicitly called for. Note: model outputs do not count as computer code. Outputs should be used as evidence in your results section (ideally formatted in a nice way). By code, I mean the sequence of commands you used to process the data and produce the outputs.
When in doubt, use shorter words and sentences.
A very common way for reports to go wrong is when the writer simply narrates the thought process he or she followed: :First I did this, but it didn’t work. Then I did something else, and I found A, B, and C. I wasn’t really sure what to make of B, but C was interesting, so I followed up with D and E. Then having done this…” Do not do this. The desire for specificity is admirable, but the overall effect is one of amateurism. Follow the recommended outline above.
Here’s a good example of a write-up for an analysis of a few relatively simple problems. Because the problems are so straightforward, there’s not much of a need for an outline of the kind described above. Nonetheless, the spirit of these guidelines is clearly in evidence. Notice the clear exposition, the labeled figures and tables that are referred to in the text, and the careful integration of visual and numerical evidence into the overall argument. This is one worth emulating.
- Privacy Policy
Home » Research Paper – Structure, Examples and Writing Guide
Research Paper – Structure, Examples and Writing Guide
Table of Contents

Research Paper
Definition:
Research Paper is a written document that presents the author’s original research, analysis, and interpretation of a specific topic or issue.
It is typically based on Empirical Evidence, and may involve qualitative or quantitative research methods, or a combination of both. The purpose of a research paper is to contribute new knowledge or insights to a particular field of study, and to demonstrate the author’s understanding of the existing literature and theories related to the topic.
Structure of Research Paper
The structure of a research paper typically follows a standard format, consisting of several sections that convey specific information about the research study. The following is a detailed explanation of the structure of a research paper:
The title page contains the title of the paper, the name(s) of the author(s), and the affiliation(s) of the author(s). It also includes the date of submission and possibly, the name of the journal or conference where the paper is to be published.
The abstract is a brief summary of the research paper, typically ranging from 100 to 250 words. It should include the research question, the methods used, the key findings, and the implications of the results. The abstract should be written in a concise and clear manner to allow readers to quickly grasp the essence of the research.
Introduction
The introduction section of a research paper provides background information about the research problem, the research question, and the research objectives. It also outlines the significance of the research, the research gap that it aims to fill, and the approach taken to address the research question. Finally, the introduction section ends with a clear statement of the research hypothesis or research question.
Literature Review
The literature review section of a research paper provides an overview of the existing literature on the topic of study. It includes a critical analysis and synthesis of the literature, highlighting the key concepts, themes, and debates. The literature review should also demonstrate the research gap and how the current study seeks to address it.
The methods section of a research paper describes the research design, the sample selection, the data collection and analysis procedures, and the statistical methods used to analyze the data. This section should provide sufficient detail for other researchers to replicate the study.
The results section presents the findings of the research, using tables, graphs, and figures to illustrate the data. The findings should be presented in a clear and concise manner, with reference to the research question and hypothesis.
The discussion section of a research paper interprets the findings and discusses their implications for the research question, the literature review, and the field of study. It should also address the limitations of the study and suggest future research directions.
The conclusion section summarizes the main findings of the study, restates the research question and hypothesis, and provides a final reflection on the significance of the research.
The references section provides a list of all the sources cited in the paper, following a specific citation style such as APA, MLA or Chicago.
How to Write Research Paper
You can write Research Paper by the following guide:
- Choose a Topic: The first step is to select a topic that interests you and is relevant to your field of study. Brainstorm ideas and narrow down to a research question that is specific and researchable.
- Conduct a Literature Review: The literature review helps you identify the gap in the existing research and provides a basis for your research question. It also helps you to develop a theoretical framework and research hypothesis.
- Develop a Thesis Statement : The thesis statement is the main argument of your research paper. It should be clear, concise and specific to your research question.
- Plan your Research: Develop a research plan that outlines the methods, data sources, and data analysis procedures. This will help you to collect and analyze data effectively.
- Collect and Analyze Data: Collect data using various methods such as surveys, interviews, observations, or experiments. Analyze data using statistical tools or other qualitative methods.
- Organize your Paper : Organize your paper into sections such as Introduction, Literature Review, Methods, Results, Discussion, and Conclusion. Ensure that each section is coherent and follows a logical flow.
- Write your Paper : Start by writing the introduction, followed by the literature review, methods, results, discussion, and conclusion. Ensure that your writing is clear, concise, and follows the required formatting and citation styles.
- Edit and Proofread your Paper: Review your paper for grammar and spelling errors, and ensure that it is well-structured and easy to read. Ask someone else to review your paper to get feedback and suggestions for improvement.
- Cite your Sources: Ensure that you properly cite all sources used in your research paper. This is essential for giving credit to the original authors and avoiding plagiarism.
Research Paper Example
Note : The below example research paper is for illustrative purposes only and is not an actual research paper. Actual research papers may have different structures, contents, and formats depending on the field of study, research question, data collection and analysis methods, and other factors. Students should always consult with their professors or supervisors for specific guidelines and expectations for their research papers.
Research Paper Example sample for Students:
Title: The Impact of Social Media on Mental Health among Young Adults
Abstract: This study aims to investigate the impact of social media use on the mental health of young adults. A literature review was conducted to examine the existing research on the topic. A survey was then administered to 200 university students to collect data on their social media use, mental health status, and perceived impact of social media on their mental health. The results showed that social media use is positively associated with depression, anxiety, and stress. The study also found that social comparison, cyberbullying, and FOMO (Fear of Missing Out) are significant predictors of mental health problems among young adults.
Introduction: Social media has become an integral part of modern life, particularly among young adults. While social media has many benefits, including increased communication and social connectivity, it has also been associated with negative outcomes, such as addiction, cyberbullying, and mental health problems. This study aims to investigate the impact of social media use on the mental health of young adults.
Literature Review: The literature review highlights the existing research on the impact of social media use on mental health. The review shows that social media use is associated with depression, anxiety, stress, and other mental health problems. The review also identifies the factors that contribute to the negative impact of social media, including social comparison, cyberbullying, and FOMO.
Methods : A survey was administered to 200 university students to collect data on their social media use, mental health status, and perceived impact of social media on their mental health. The survey included questions on social media use, mental health status (measured using the DASS-21), and perceived impact of social media on their mental health. Data were analyzed using descriptive statistics and regression analysis.
Results : The results showed that social media use is positively associated with depression, anxiety, and stress. The study also found that social comparison, cyberbullying, and FOMO are significant predictors of mental health problems among young adults.
Discussion : The study’s findings suggest that social media use has a negative impact on the mental health of young adults. The study highlights the need for interventions that address the factors contributing to the negative impact of social media, such as social comparison, cyberbullying, and FOMO.
Conclusion : In conclusion, social media use has a significant impact on the mental health of young adults. The study’s findings underscore the need for interventions that promote healthy social media use and address the negative outcomes associated with social media use. Future research can explore the effectiveness of interventions aimed at reducing the negative impact of social media on mental health. Additionally, longitudinal studies can investigate the long-term effects of social media use on mental health.
Limitations : The study has some limitations, including the use of self-report measures and a cross-sectional design. The use of self-report measures may result in biased responses, and a cross-sectional design limits the ability to establish causality.
Implications: The study’s findings have implications for mental health professionals, educators, and policymakers. Mental health professionals can use the findings to develop interventions that address the negative impact of social media use on mental health. Educators can incorporate social media literacy into their curriculum to promote healthy social media use among young adults. Policymakers can use the findings to develop policies that protect young adults from the negative outcomes associated with social media use.
References :
- Twenge, J. M., & Campbell, W. K. (2019). Associations between screen time and lower psychological well-being among children and adolescents: Evidence from a population-based study. Preventive medicine reports, 15, 100918.
- Primack, B. A., Shensa, A., Escobar-Viera, C. G., Barrett, E. L., Sidani, J. E., Colditz, J. B., … & James, A. E. (2017). Use of multiple social media platforms and symptoms of depression and anxiety: A nationally-representative study among US young adults. Computers in Human Behavior, 69, 1-9.
- Van der Meer, T. G., & Verhoeven, J. W. (2017). Social media and its impact on academic performance of students. Journal of Information Technology Education: Research, 16, 383-398.
Appendix : The survey used in this study is provided below.
Social Media and Mental Health Survey
- How often do you use social media per day?
- Less than 30 minutes
- 30 minutes to 1 hour
- 1 to 2 hours
- 2 to 4 hours
- More than 4 hours
- Which social media platforms do you use?
- Others (Please specify)
- How often do you experience the following on social media?
- Social comparison (comparing yourself to others)
- Cyberbullying
- Fear of Missing Out (FOMO)
- Have you ever experienced any of the following mental health problems in the past month?
- Do you think social media use has a positive or negative impact on your mental health?
- Very positive
- Somewhat positive
- Somewhat negative
- Very negative
- In your opinion, which factors contribute to the negative impact of social media on mental health?
- Social comparison
- In your opinion, what interventions could be effective in reducing the negative impact of social media on mental health?
- Education on healthy social media use
- Counseling for mental health problems caused by social media
- Social media detox programs
- Regulation of social media use
Thank you for your participation!
Applications of Research Paper
Research papers have several applications in various fields, including:
- Advancing knowledge: Research papers contribute to the advancement of knowledge by generating new insights, theories, and findings that can inform future research and practice. They help to answer important questions, clarify existing knowledge, and identify areas that require further investigation.
- Informing policy: Research papers can inform policy decisions by providing evidence-based recommendations for policymakers. They can help to identify gaps in current policies, evaluate the effectiveness of interventions, and inform the development of new policies and regulations.
- Improving practice: Research papers can improve practice by providing evidence-based guidance for professionals in various fields, including medicine, education, business, and psychology. They can inform the development of best practices, guidelines, and standards of care that can improve outcomes for individuals and organizations.
- Educating students : Research papers are often used as teaching tools in universities and colleges to educate students about research methods, data analysis, and academic writing. They help students to develop critical thinking skills, research skills, and communication skills that are essential for success in many careers.
- Fostering collaboration: Research papers can foster collaboration among researchers, practitioners, and policymakers by providing a platform for sharing knowledge and ideas. They can facilitate interdisciplinary collaborations and partnerships that can lead to innovative solutions to complex problems.
When to Write Research Paper
Research papers are typically written when a person has completed a research project or when they have conducted a study and have obtained data or findings that they want to share with the academic or professional community. Research papers are usually written in academic settings, such as universities, but they can also be written in professional settings, such as research organizations, government agencies, or private companies.
Here are some common situations where a person might need to write a research paper:
- For academic purposes: Students in universities and colleges are often required to write research papers as part of their coursework, particularly in the social sciences, natural sciences, and humanities. Writing research papers helps students to develop research skills, critical thinking skills, and academic writing skills.
- For publication: Researchers often write research papers to publish their findings in academic journals or to present their work at academic conferences. Publishing research papers is an important way to disseminate research findings to the academic community and to establish oneself as an expert in a particular field.
- To inform policy or practice : Researchers may write research papers to inform policy decisions or to improve practice in various fields. Research findings can be used to inform the development of policies, guidelines, and best practices that can improve outcomes for individuals and organizations.
- To share new insights or ideas: Researchers may write research papers to share new insights or ideas with the academic or professional community. They may present new theories, propose new research methods, or challenge existing paradigms in their field.
Purpose of Research Paper
The purpose of a research paper is to present the results of a study or investigation in a clear, concise, and structured manner. Research papers are written to communicate new knowledge, ideas, or findings to a specific audience, such as researchers, scholars, practitioners, or policymakers. The primary purposes of a research paper are:
- To contribute to the body of knowledge : Research papers aim to add new knowledge or insights to a particular field or discipline. They do this by reporting the results of empirical studies, reviewing and synthesizing existing literature, proposing new theories, or providing new perspectives on a topic.
- To inform or persuade: Research papers are written to inform or persuade the reader about a particular issue, topic, or phenomenon. They present evidence and arguments to support their claims and seek to persuade the reader of the validity of their findings or recommendations.
- To advance the field: Research papers seek to advance the field or discipline by identifying gaps in knowledge, proposing new research questions or approaches, or challenging existing assumptions or paradigms. They aim to contribute to ongoing debates and discussions within a field and to stimulate further research and inquiry.
- To demonstrate research skills: Research papers demonstrate the author’s research skills, including their ability to design and conduct a study, collect and analyze data, and interpret and communicate findings. They also demonstrate the author’s ability to critically evaluate existing literature, synthesize information from multiple sources, and write in a clear and structured manner.
Characteristics of Research Paper
Research papers have several characteristics that distinguish them from other forms of academic or professional writing. Here are some common characteristics of research papers:
- Evidence-based: Research papers are based on empirical evidence, which is collected through rigorous research methods such as experiments, surveys, observations, or interviews. They rely on objective data and facts to support their claims and conclusions.
- Structured and organized: Research papers have a clear and logical structure, with sections such as introduction, literature review, methods, results, discussion, and conclusion. They are organized in a way that helps the reader to follow the argument and understand the findings.
- Formal and objective: Research papers are written in a formal and objective tone, with an emphasis on clarity, precision, and accuracy. They avoid subjective language or personal opinions and instead rely on objective data and analysis to support their arguments.
- Citations and references: Research papers include citations and references to acknowledge the sources of information and ideas used in the paper. They use a specific citation style, such as APA, MLA, or Chicago, to ensure consistency and accuracy.
- Peer-reviewed: Research papers are often peer-reviewed, which means they are evaluated by other experts in the field before they are published. Peer-review ensures that the research is of high quality, meets ethical standards, and contributes to the advancement of knowledge in the field.
- Objective and unbiased: Research papers strive to be objective and unbiased in their presentation of the findings. They avoid personal biases or preconceptions and instead rely on the data and analysis to draw conclusions.
Advantages of Research Paper
Research papers have many advantages, both for the individual researcher and for the broader academic and professional community. Here are some advantages of research papers:
- Contribution to knowledge: Research papers contribute to the body of knowledge in a particular field or discipline. They add new information, insights, and perspectives to existing literature and help advance the understanding of a particular phenomenon or issue.
- Opportunity for intellectual growth: Research papers provide an opportunity for intellectual growth for the researcher. They require critical thinking, problem-solving, and creativity, which can help develop the researcher’s skills and knowledge.
- Career advancement: Research papers can help advance the researcher’s career by demonstrating their expertise and contributions to the field. They can also lead to new research opportunities, collaborations, and funding.
- Academic recognition: Research papers can lead to academic recognition in the form of awards, grants, or invitations to speak at conferences or events. They can also contribute to the researcher’s reputation and standing in the field.
- Impact on policy and practice: Research papers can have a significant impact on policy and practice. They can inform policy decisions, guide practice, and lead to changes in laws, regulations, or procedures.
- Advancement of society: Research papers can contribute to the advancement of society by addressing important issues, identifying solutions to problems, and promoting social justice and equality.
Limitations of Research Paper
Research papers also have some limitations that should be considered when interpreting their findings or implications. Here are some common limitations of research papers:
- Limited generalizability: Research findings may not be generalizable to other populations, settings, or contexts. Studies often use specific samples or conditions that may not reflect the broader population or real-world situations.
- Potential for bias : Research papers may be biased due to factors such as sample selection, measurement errors, or researcher biases. It is important to evaluate the quality of the research design and methods used to ensure that the findings are valid and reliable.
- Ethical concerns: Research papers may raise ethical concerns, such as the use of vulnerable populations or invasive procedures. Researchers must adhere to ethical guidelines and obtain informed consent from participants to ensure that the research is conducted in a responsible and respectful manner.
- Limitations of methodology: Research papers may be limited by the methodology used to collect and analyze data. For example, certain research methods may not capture the complexity or nuance of a particular phenomenon, or may not be appropriate for certain research questions.
- Publication bias: Research papers may be subject to publication bias, where positive or significant findings are more likely to be published than negative or non-significant findings. This can skew the overall findings of a particular area of research.
- Time and resource constraints: Research papers may be limited by time and resource constraints, which can affect the quality and scope of the research. Researchers may not have access to certain data or resources, or may be unable to conduct long-term studies due to practical limitations.
About the author

Muhammad Hassan
Researcher, Academic Writer, Web developer
You may also like

Research Findings – Types Examples and Writing...

Research Paper Title – Writing Guide and Example

How to Publish a Research Paper – Step by Step...

Research Contribution – Thesis Guide

What is a Hypothesis – Types, Examples and...

Scope of the Research – Writing Guide and...
An official website of the United States government
The .gov means it’s official. Federal government websites often end in .gov or .mil. Before sharing sensitive information, make sure you’re on a federal government site.
The site is secure. The https:// ensures that you are connecting to the official website and that any information you provide is encrypted and transmitted securely.
- Publications
- Account settings
Preview improvements coming to the PMC website in October 2024. Learn More or Try it out now .
- Advanced Search
- Journal List
- J Korean Med Sci
- v.37(16); 2022 Apr 25
A Practical Guide to Writing Quantitative and Qualitative Research Questions and Hypotheses in Scholarly Articles
Edward barroga.
1 Department of General Education, Graduate School of Nursing Science, St. Luke’s International University, Tokyo, Japan.
Glafera Janet Matanguihan
2 Department of Biological Sciences, Messiah University, Mechanicsburg, PA, USA.
The development of research questions and the subsequent hypotheses are prerequisites to defining the main research purpose and specific objectives of a study. Consequently, these objectives determine the study design and research outcome. The development of research questions is a process based on knowledge of current trends, cutting-edge studies, and technological advances in the research field. Excellent research questions are focused and require a comprehensive literature search and in-depth understanding of the problem being investigated. Initially, research questions may be written as descriptive questions which could be developed into inferential questions. These questions must be specific and concise to provide a clear foundation for developing hypotheses. Hypotheses are more formal predictions about the research outcomes. These specify the possible results that may or may not be expected regarding the relationship between groups. Thus, research questions and hypotheses clarify the main purpose and specific objectives of the study, which in turn dictate the design of the study, its direction, and outcome. Studies developed from good research questions and hypotheses will have trustworthy outcomes with wide-ranging social and health implications.
INTRODUCTION
Scientific research is usually initiated by posing evidenced-based research questions which are then explicitly restated as hypotheses. 1 , 2 The hypotheses provide directions to guide the study, solutions, explanations, and expected results. 3 , 4 Both research questions and hypotheses are essentially formulated based on conventional theories and real-world processes, which allow the inception of novel studies and the ethical testing of ideas. 5 , 6
It is crucial to have knowledge of both quantitative and qualitative research 2 as both types of research involve writing research questions and hypotheses. 7 However, these crucial elements of research are sometimes overlooked; if not overlooked, then framed without the forethought and meticulous attention it needs. Planning and careful consideration are needed when developing quantitative or qualitative research, particularly when conceptualizing research questions and hypotheses. 4
There is a continuing need to support researchers in the creation of innovative research questions and hypotheses, as well as for journal articles that carefully review these elements. 1 When research questions and hypotheses are not carefully thought of, unethical studies and poor outcomes usually ensue. Carefully formulated research questions and hypotheses define well-founded objectives, which in turn determine the appropriate design, course, and outcome of the study. This article then aims to discuss in detail the various aspects of crafting research questions and hypotheses, with the goal of guiding researchers as they develop their own. Examples from the authors and peer-reviewed scientific articles in the healthcare field are provided to illustrate key points.
DEFINITIONS AND RELATIONSHIP OF RESEARCH QUESTIONS AND HYPOTHESES
A research question is what a study aims to answer after data analysis and interpretation. The answer is written in length in the discussion section of the paper. Thus, the research question gives a preview of the different parts and variables of the study meant to address the problem posed in the research question. 1 An excellent research question clarifies the research writing while facilitating understanding of the research topic, objective, scope, and limitations of the study. 5
On the other hand, a research hypothesis is an educated statement of an expected outcome. This statement is based on background research and current knowledge. 8 , 9 The research hypothesis makes a specific prediction about a new phenomenon 10 or a formal statement on the expected relationship between an independent variable and a dependent variable. 3 , 11 It provides a tentative answer to the research question to be tested or explored. 4
Hypotheses employ reasoning to predict a theory-based outcome. 10 These can also be developed from theories by focusing on components of theories that have not yet been observed. 10 The validity of hypotheses is often based on the testability of the prediction made in a reproducible experiment. 8
Conversely, hypotheses can also be rephrased as research questions. Several hypotheses based on existing theories and knowledge may be needed to answer a research question. Developing ethical research questions and hypotheses creates a research design that has logical relationships among variables. These relationships serve as a solid foundation for the conduct of the study. 4 , 11 Haphazardly constructed research questions can result in poorly formulated hypotheses and improper study designs, leading to unreliable results. Thus, the formulations of relevant research questions and verifiable hypotheses are crucial when beginning research. 12
CHARACTERISTICS OF GOOD RESEARCH QUESTIONS AND HYPOTHESES
Excellent research questions are specific and focused. These integrate collective data and observations to confirm or refute the subsequent hypotheses. Well-constructed hypotheses are based on previous reports and verify the research context. These are realistic, in-depth, sufficiently complex, and reproducible. More importantly, these hypotheses can be addressed and tested. 13
There are several characteristics of well-developed hypotheses. Good hypotheses are 1) empirically testable 7 , 10 , 11 , 13 ; 2) backed by preliminary evidence 9 ; 3) testable by ethical research 7 , 9 ; 4) based on original ideas 9 ; 5) have evidenced-based logical reasoning 10 ; and 6) can be predicted. 11 Good hypotheses can infer ethical and positive implications, indicating the presence of a relationship or effect relevant to the research theme. 7 , 11 These are initially developed from a general theory and branch into specific hypotheses by deductive reasoning. In the absence of a theory to base the hypotheses, inductive reasoning based on specific observations or findings form more general hypotheses. 10
TYPES OF RESEARCH QUESTIONS AND HYPOTHESES
Research questions and hypotheses are developed according to the type of research, which can be broadly classified into quantitative and qualitative research. We provide a summary of the types of research questions and hypotheses under quantitative and qualitative research categories in Table 1 .
| Quantitative research questions | Quantitative research hypotheses |
|---|---|
| Descriptive research questions | Simple hypothesis |
| Comparative research questions | Complex hypothesis |
| Relationship research questions | Directional hypothesis |
| Non-directional hypothesis | |
| Associative hypothesis | |
| Causal hypothesis | |
| Null hypothesis | |
| Alternative hypothesis | |
| Working hypothesis | |
| Statistical hypothesis | |
| Logical hypothesis | |
| Hypothesis-testing | |
| Qualitative research questions | Qualitative research hypotheses |
| Contextual research questions | Hypothesis-generating |
| Descriptive research questions | |
| Evaluation research questions | |
| Explanatory research questions | |
| Exploratory research questions | |
| Generative research questions | |
| Ideological research questions | |
| Ethnographic research questions | |
| Phenomenological research questions | |
| Grounded theory questions | |
| Qualitative case study questions |
Research questions in quantitative research
In quantitative research, research questions inquire about the relationships among variables being investigated and are usually framed at the start of the study. These are precise and typically linked to the subject population, dependent and independent variables, and research design. 1 Research questions may also attempt to describe the behavior of a population in relation to one or more variables, or describe the characteristics of variables to be measured ( descriptive research questions ). 1 , 5 , 14 These questions may also aim to discover differences between groups within the context of an outcome variable ( comparative research questions ), 1 , 5 , 14 or elucidate trends and interactions among variables ( relationship research questions ). 1 , 5 We provide examples of descriptive, comparative, and relationship research questions in quantitative research in Table 2 .
| Quantitative research questions | |
|---|---|
| Descriptive research question | |
| - Measures responses of subjects to variables | |
| - Presents variables to measure, analyze, or assess | |
| What is the proportion of resident doctors in the hospital who have mastered ultrasonography (response of subjects to a variable) as a diagnostic technique in their clinical training? | |
| Comparative research question | |
| - Clarifies difference between one group with outcome variable and another group without outcome variable | |
| Is there a difference in the reduction of lung metastasis in osteosarcoma patients who received the vitamin D adjunctive therapy (group with outcome variable) compared with osteosarcoma patients who did not receive the vitamin D adjunctive therapy (group without outcome variable)? | |
| - Compares the effects of variables | |
| How does the vitamin D analogue 22-Oxacalcitriol (variable 1) mimic the antiproliferative activity of 1,25-Dihydroxyvitamin D (variable 2) in osteosarcoma cells? | |
| Relationship research question | |
| - Defines trends, association, relationships, or interactions between dependent variable and independent variable | |
| Is there a relationship between the number of medical student suicide (dependent variable) and the level of medical student stress (independent variable) in Japan during the first wave of the COVID-19 pandemic? | |
Hypotheses in quantitative research
In quantitative research, hypotheses predict the expected relationships among variables. 15 Relationships among variables that can be predicted include 1) between a single dependent variable and a single independent variable ( simple hypothesis ) or 2) between two or more independent and dependent variables ( complex hypothesis ). 4 , 11 Hypotheses may also specify the expected direction to be followed and imply an intellectual commitment to a particular outcome ( directional hypothesis ) 4 . On the other hand, hypotheses may not predict the exact direction and are used in the absence of a theory, or when findings contradict previous studies ( non-directional hypothesis ). 4 In addition, hypotheses can 1) define interdependency between variables ( associative hypothesis ), 4 2) propose an effect on the dependent variable from manipulation of the independent variable ( causal hypothesis ), 4 3) state a negative relationship between two variables ( null hypothesis ), 4 , 11 , 15 4) replace the working hypothesis if rejected ( alternative hypothesis ), 15 explain the relationship of phenomena to possibly generate a theory ( working hypothesis ), 11 5) involve quantifiable variables that can be tested statistically ( statistical hypothesis ), 11 6) or express a relationship whose interlinks can be verified logically ( logical hypothesis ). 11 We provide examples of simple, complex, directional, non-directional, associative, causal, null, alternative, working, statistical, and logical hypotheses in quantitative research, as well as the definition of quantitative hypothesis-testing research in Table 3 .
| Quantitative research hypotheses | |
|---|---|
| Simple hypothesis | |
| - Predicts relationship between single dependent variable and single independent variable | |
| If the dose of the new medication (single independent variable) is high, blood pressure (single dependent variable) is lowered. | |
| Complex hypothesis | |
| - Foretells relationship between two or more independent and dependent variables | |
| The higher the use of anticancer drugs, radiation therapy, and adjunctive agents (3 independent variables), the higher would be the survival rate (1 dependent variable). | |
| Directional hypothesis | |
| - Identifies study direction based on theory towards particular outcome to clarify relationship between variables | |
| Privately funded research projects will have a larger international scope (study direction) than publicly funded research projects. | |
| Non-directional hypothesis | |
| - Nature of relationship between two variables or exact study direction is not identified | |
| - Does not involve a theory | |
| Women and men are different in terms of helpfulness. (Exact study direction is not identified) | |
| Associative hypothesis | |
| - Describes variable interdependency | |
| - Change in one variable causes change in another variable | |
| A larger number of people vaccinated against COVID-19 in the region (change in independent variable) will reduce the region’s incidence of COVID-19 infection (change in dependent variable). | |
| Causal hypothesis | |
| - An effect on dependent variable is predicted from manipulation of independent variable | |
| A change into a high-fiber diet (independent variable) will reduce the blood sugar level (dependent variable) of the patient. | |
| Null hypothesis | |
| - A negative statement indicating no relationship or difference between 2 variables | |
| There is no significant difference in the severity of pulmonary metastases between the new drug (variable 1) and the current drug (variable 2). | |
| Alternative hypothesis | |
| - Following a null hypothesis, an alternative hypothesis predicts a relationship between 2 study variables | |
| The new drug (variable 1) is better on average in reducing the level of pain from pulmonary metastasis than the current drug (variable 2). | |
| Working hypothesis | |
| - A hypothesis that is initially accepted for further research to produce a feasible theory | |
| Dairy cows fed with concentrates of different formulations will produce different amounts of milk. | |
| Statistical hypothesis | |
| - Assumption about the value of population parameter or relationship among several population characteristics | |
| - Validity tested by a statistical experiment or analysis | |
| The mean recovery rate from COVID-19 infection (value of population parameter) is not significantly different between population 1 and population 2. | |
| There is a positive correlation between the level of stress at the workplace and the number of suicides (population characteristics) among working people in Japan. | |
| Logical hypothesis | |
| - Offers or proposes an explanation with limited or no extensive evidence | |
| If healthcare workers provide more educational programs about contraception methods, the number of adolescent pregnancies will be less. | |
| Hypothesis-testing (Quantitative hypothesis-testing research) | |
| - Quantitative research uses deductive reasoning. | |
| - This involves the formation of a hypothesis, collection of data in the investigation of the problem, analysis and use of the data from the investigation, and drawing of conclusions to validate or nullify the hypotheses. | |
Research questions in qualitative research
Unlike research questions in quantitative research, research questions in qualitative research are usually continuously reviewed and reformulated. The central question and associated subquestions are stated more than the hypotheses. 15 The central question broadly explores a complex set of factors surrounding the central phenomenon, aiming to present the varied perspectives of participants. 15
There are varied goals for which qualitative research questions are developed. These questions can function in several ways, such as to 1) identify and describe existing conditions ( contextual research question s); 2) describe a phenomenon ( descriptive research questions ); 3) assess the effectiveness of existing methods, protocols, theories, or procedures ( evaluation research questions ); 4) examine a phenomenon or analyze the reasons or relationships between subjects or phenomena ( explanatory research questions ); or 5) focus on unknown aspects of a particular topic ( exploratory research questions ). 5 In addition, some qualitative research questions provide new ideas for the development of theories and actions ( generative research questions ) or advance specific ideologies of a position ( ideological research questions ). 1 Other qualitative research questions may build on a body of existing literature and become working guidelines ( ethnographic research questions ). Research questions may also be broadly stated without specific reference to the existing literature or a typology of questions ( phenomenological research questions ), may be directed towards generating a theory of some process ( grounded theory questions ), or may address a description of the case and the emerging themes ( qualitative case study questions ). 15 We provide examples of contextual, descriptive, evaluation, explanatory, exploratory, generative, ideological, ethnographic, phenomenological, grounded theory, and qualitative case study research questions in qualitative research in Table 4 , and the definition of qualitative hypothesis-generating research in Table 5 .
| Qualitative research questions | |
|---|---|
| Contextual research question | |
| - Ask the nature of what already exists | |
| - Individuals or groups function to further clarify and understand the natural context of real-world problems | |
| What are the experiences of nurses working night shifts in healthcare during the COVID-19 pandemic? (natural context of real-world problems) | |
| Descriptive research question | |
| - Aims to describe a phenomenon | |
| What are the different forms of disrespect and abuse (phenomenon) experienced by Tanzanian women when giving birth in healthcare facilities? | |
| Evaluation research question | |
| - Examines the effectiveness of existing practice or accepted frameworks | |
| How effective are decision aids (effectiveness of existing practice) in helping decide whether to give birth at home or in a healthcare facility? | |
| Explanatory research question | |
| - Clarifies a previously studied phenomenon and explains why it occurs | |
| Why is there an increase in teenage pregnancy (phenomenon) in Tanzania? | |
| Exploratory research question | |
| - Explores areas that have not been fully investigated to have a deeper understanding of the research problem | |
| What factors affect the mental health of medical students (areas that have not yet been fully investigated) during the COVID-19 pandemic? | |
| Generative research question | |
| - Develops an in-depth understanding of people’s behavior by asking ‘how would’ or ‘what if’ to identify problems and find solutions | |
| How would the extensive research experience of the behavior of new staff impact the success of the novel drug initiative? | |
| Ideological research question | |
| - Aims to advance specific ideas or ideologies of a position | |
| Are Japanese nurses who volunteer in remote African hospitals able to promote humanized care of patients (specific ideas or ideologies) in the areas of safe patient environment, respect of patient privacy, and provision of accurate information related to health and care? | |
| Ethnographic research question | |
| - Clarifies peoples’ nature, activities, their interactions, and the outcomes of their actions in specific settings | |
| What are the demographic characteristics, rehabilitative treatments, community interactions, and disease outcomes (nature, activities, their interactions, and the outcomes) of people in China who are suffering from pneumoconiosis? | |
| Phenomenological research question | |
| - Knows more about the phenomena that have impacted an individual | |
| What are the lived experiences of parents who have been living with and caring for children with a diagnosis of autism? (phenomena that have impacted an individual) | |
| Grounded theory question | |
| - Focuses on social processes asking about what happens and how people interact, or uncovering social relationships and behaviors of groups | |
| What are the problems that pregnant adolescents face in terms of social and cultural norms (social processes), and how can these be addressed? | |
| Qualitative case study question | |
| - Assesses a phenomenon using different sources of data to answer “why” and “how” questions | |
| - Considers how the phenomenon is influenced by its contextual situation. | |
| How does quitting work and assuming the role of a full-time mother (phenomenon assessed) change the lives of women in Japan? | |
| Qualitative research hypotheses | |
|---|---|
| Hypothesis-generating (Qualitative hypothesis-generating research) | |
| - Qualitative research uses inductive reasoning. | |
| - This involves data collection from study participants or the literature regarding a phenomenon of interest, using the collected data to develop a formal hypothesis, and using the formal hypothesis as a framework for testing the hypothesis. | |
| - Qualitative exploratory studies explore areas deeper, clarifying subjective experience and allowing formulation of a formal hypothesis potentially testable in a future quantitative approach. | |
Qualitative studies usually pose at least one central research question and several subquestions starting with How or What . These research questions use exploratory verbs such as explore or describe . These also focus on one central phenomenon of interest, and may mention the participants and research site. 15
Hypotheses in qualitative research
Hypotheses in qualitative research are stated in the form of a clear statement concerning the problem to be investigated. Unlike in quantitative research where hypotheses are usually developed to be tested, qualitative research can lead to both hypothesis-testing and hypothesis-generating outcomes. 2 When studies require both quantitative and qualitative research questions, this suggests an integrative process between both research methods wherein a single mixed-methods research question can be developed. 1
FRAMEWORKS FOR DEVELOPING RESEARCH QUESTIONS AND HYPOTHESES
Research questions followed by hypotheses should be developed before the start of the study. 1 , 12 , 14 It is crucial to develop feasible research questions on a topic that is interesting to both the researcher and the scientific community. This can be achieved by a meticulous review of previous and current studies to establish a novel topic. Specific areas are subsequently focused on to generate ethical research questions. The relevance of the research questions is evaluated in terms of clarity of the resulting data, specificity of the methodology, objectivity of the outcome, depth of the research, and impact of the study. 1 , 5 These aspects constitute the FINER criteria (i.e., Feasible, Interesting, Novel, Ethical, and Relevant). 1 Clarity and effectiveness are achieved if research questions meet the FINER criteria. In addition to the FINER criteria, Ratan et al. described focus, complexity, novelty, feasibility, and measurability for evaluating the effectiveness of research questions. 14
The PICOT and PEO frameworks are also used when developing research questions. 1 The following elements are addressed in these frameworks, PICOT: P-population/patients/problem, I-intervention or indicator being studied, C-comparison group, O-outcome of interest, and T-timeframe of the study; PEO: P-population being studied, E-exposure to preexisting conditions, and O-outcome of interest. 1 Research questions are also considered good if these meet the “FINERMAPS” framework: Feasible, Interesting, Novel, Ethical, Relevant, Manageable, Appropriate, Potential value/publishable, and Systematic. 14
As we indicated earlier, research questions and hypotheses that are not carefully formulated result in unethical studies or poor outcomes. To illustrate this, we provide some examples of ambiguous research question and hypotheses that result in unclear and weak research objectives in quantitative research ( Table 6 ) 16 and qualitative research ( Table 7 ) 17 , and how to transform these ambiguous research question(s) and hypothesis(es) into clear and good statements.
| Variables | Unclear and weak statement (Statement 1) | Clear and good statement (Statement 2) | Points to avoid |
|---|---|---|---|
| Research question | Which is more effective between smoke moxibustion and smokeless moxibustion? | “Moreover, regarding smoke moxibustion versus smokeless moxibustion, it remains unclear which is more effective, safe, and acceptable to pregnant women, and whether there is any difference in the amount of heat generated.” | 1) Vague and unfocused questions |
| 2) Closed questions simply answerable by yes or no | |||
| 3) Questions requiring a simple choice | |||
| Hypothesis | The smoke moxibustion group will have higher cephalic presentation. | “Hypothesis 1. The smoke moxibustion stick group (SM group) and smokeless moxibustion stick group (-SLM group) will have higher rates of cephalic presentation after treatment than the control group. | 1) Unverifiable hypotheses |
| Hypothesis 2. The SM group and SLM group will have higher rates of cephalic presentation at birth than the control group. | 2) Incompletely stated groups of comparison | ||
| Hypothesis 3. There will be no significant differences in the well-being of the mother and child among the three groups in terms of the following outcomes: premature birth, premature rupture of membranes (PROM) at < 37 weeks, Apgar score < 7 at 5 min, umbilical cord blood pH < 7.1, admission to neonatal intensive care unit (NICU), and intrauterine fetal death.” | 3) Insufficiently described variables or outcomes | ||
| Research objective | To determine which is more effective between smoke moxibustion and smokeless moxibustion. | “The specific aims of this pilot study were (a) to compare the effects of smoke moxibustion and smokeless moxibustion treatments with the control group as a possible supplement to ECV for converting breech presentation to cephalic presentation and increasing adherence to the newly obtained cephalic position, and (b) to assess the effects of these treatments on the well-being of the mother and child.” | 1) Poor understanding of the research question and hypotheses |
| 2) Insufficient description of population, variables, or study outcomes |
a These statements were composed for comparison and illustrative purposes only.
b These statements are direct quotes from Higashihara and Horiuchi. 16
| Variables | Unclear and weak statement (Statement 1) | Clear and good statement (Statement 2) | Points to avoid |
|---|---|---|---|
| Research question | Does disrespect and abuse (D&A) occur in childbirth in Tanzania? | How does disrespect and abuse (D&A) occur and what are the types of physical and psychological abuses observed in midwives’ actual care during facility-based childbirth in urban Tanzania? | 1) Ambiguous or oversimplistic questions |
| 2) Questions unverifiable by data collection and analysis | |||
| Hypothesis | Disrespect and abuse (D&A) occur in childbirth in Tanzania. | Hypothesis 1: Several types of physical and psychological abuse by midwives in actual care occur during facility-based childbirth in urban Tanzania. | 1) Statements simply expressing facts |
| Hypothesis 2: Weak nursing and midwifery management contribute to the D&A of women during facility-based childbirth in urban Tanzania. | 2) Insufficiently described concepts or variables | ||
| Research objective | To describe disrespect and abuse (D&A) in childbirth in Tanzania. | “This study aimed to describe from actual observations the respectful and disrespectful care received by women from midwives during their labor period in two hospitals in urban Tanzania.” | 1) Statements unrelated to the research question and hypotheses |
| 2) Unattainable or unexplorable objectives |
a This statement is a direct quote from Shimoda et al. 17
The other statements were composed for comparison and illustrative purposes only.
CONSTRUCTING RESEARCH QUESTIONS AND HYPOTHESES
To construct effective research questions and hypotheses, it is very important to 1) clarify the background and 2) identify the research problem at the outset of the research, within a specific timeframe. 9 Then, 3) review or conduct preliminary research to collect all available knowledge about the possible research questions by studying theories and previous studies. 18 Afterwards, 4) construct research questions to investigate the research problem. Identify variables to be accessed from the research questions 4 and make operational definitions of constructs from the research problem and questions. Thereafter, 5) construct specific deductive or inductive predictions in the form of hypotheses. 4 Finally, 6) state the study aims . This general flow for constructing effective research questions and hypotheses prior to conducting research is shown in Fig. 1 .

Research questions are used more frequently in qualitative research than objectives or hypotheses. 3 These questions seek to discover, understand, explore or describe experiences by asking “What” or “How.” The questions are open-ended to elicit a description rather than to relate variables or compare groups. The questions are continually reviewed, reformulated, and changed during the qualitative study. 3 Research questions are also used more frequently in survey projects than hypotheses in experiments in quantitative research to compare variables and their relationships.
Hypotheses are constructed based on the variables identified and as an if-then statement, following the template, ‘If a specific action is taken, then a certain outcome is expected.’ At this stage, some ideas regarding expectations from the research to be conducted must be drawn. 18 Then, the variables to be manipulated (independent) and influenced (dependent) are defined. 4 Thereafter, the hypothesis is stated and refined, and reproducible data tailored to the hypothesis are identified, collected, and analyzed. 4 The hypotheses must be testable and specific, 18 and should describe the variables and their relationships, the specific group being studied, and the predicted research outcome. 18 Hypotheses construction involves a testable proposition to be deduced from theory, and independent and dependent variables to be separated and measured separately. 3 Therefore, good hypotheses must be based on good research questions constructed at the start of a study or trial. 12
In summary, research questions are constructed after establishing the background of the study. Hypotheses are then developed based on the research questions. Thus, it is crucial to have excellent research questions to generate superior hypotheses. In turn, these would determine the research objectives and the design of the study, and ultimately, the outcome of the research. 12 Algorithms for building research questions and hypotheses are shown in Fig. 2 for quantitative research and in Fig. 3 for qualitative research.

EXAMPLES OF RESEARCH QUESTIONS FROM PUBLISHED ARTICLES
- EXAMPLE 1. Descriptive research question (quantitative research)
- - Presents research variables to be assessed (distinct phenotypes and subphenotypes)
- “BACKGROUND: Since COVID-19 was identified, its clinical and biological heterogeneity has been recognized. Identifying COVID-19 phenotypes might help guide basic, clinical, and translational research efforts.
- RESEARCH QUESTION: Does the clinical spectrum of patients with COVID-19 contain distinct phenotypes and subphenotypes? ” 19
- EXAMPLE 2. Relationship research question (quantitative research)
- - Shows interactions between dependent variable (static postural control) and independent variable (peripheral visual field loss)
- “Background: Integration of visual, vestibular, and proprioceptive sensations contributes to postural control. People with peripheral visual field loss have serious postural instability. However, the directional specificity of postural stability and sensory reweighting caused by gradual peripheral visual field loss remain unclear.
- Research question: What are the effects of peripheral visual field loss on static postural control ?” 20
- EXAMPLE 3. Comparative research question (quantitative research)
- - Clarifies the difference among groups with an outcome variable (patients enrolled in COMPERA with moderate PH or severe PH in COPD) and another group without the outcome variable (patients with idiopathic pulmonary arterial hypertension (IPAH))
- “BACKGROUND: Pulmonary hypertension (PH) in COPD is a poorly investigated clinical condition.
- RESEARCH QUESTION: Which factors determine the outcome of PH in COPD?
- STUDY DESIGN AND METHODS: We analyzed the characteristics and outcome of patients enrolled in the Comparative, Prospective Registry of Newly Initiated Therapies for Pulmonary Hypertension (COMPERA) with moderate or severe PH in COPD as defined during the 6th PH World Symposium who received medical therapy for PH and compared them with patients with idiopathic pulmonary arterial hypertension (IPAH) .” 21
- EXAMPLE 4. Exploratory research question (qualitative research)
- - Explores areas that have not been fully investigated (perspectives of families and children who receive care in clinic-based child obesity treatment) to have a deeper understanding of the research problem
- “Problem: Interventions for children with obesity lead to only modest improvements in BMI and long-term outcomes, and data are limited on the perspectives of families of children with obesity in clinic-based treatment. This scoping review seeks to answer the question: What is known about the perspectives of families and children who receive care in clinic-based child obesity treatment? This review aims to explore the scope of perspectives reported by families of children with obesity who have received individualized outpatient clinic-based obesity treatment.” 22
- EXAMPLE 5. Relationship research question (quantitative research)
- - Defines interactions between dependent variable (use of ankle strategies) and independent variable (changes in muscle tone)
- “Background: To maintain an upright standing posture against external disturbances, the human body mainly employs two types of postural control strategies: “ankle strategy” and “hip strategy.” While it has been reported that the magnitude of the disturbance alters the use of postural control strategies, it has not been elucidated how the level of muscle tone, one of the crucial parameters of bodily function, determines the use of each strategy. We have previously confirmed using forward dynamics simulations of human musculoskeletal models that an increased muscle tone promotes the use of ankle strategies. The objective of the present study was to experimentally evaluate a hypothesis: an increased muscle tone promotes the use of ankle strategies. Research question: Do changes in the muscle tone affect the use of ankle strategies ?” 23
EXAMPLES OF HYPOTHESES IN PUBLISHED ARTICLES
- EXAMPLE 1. Working hypothesis (quantitative research)
- - A hypothesis that is initially accepted for further research to produce a feasible theory
- “As fever may have benefit in shortening the duration of viral illness, it is plausible to hypothesize that the antipyretic efficacy of ibuprofen may be hindering the benefits of a fever response when taken during the early stages of COVID-19 illness .” 24
- “In conclusion, it is plausible to hypothesize that the antipyretic efficacy of ibuprofen may be hindering the benefits of a fever response . The difference in perceived safety of these agents in COVID-19 illness could be related to the more potent efficacy to reduce fever with ibuprofen compared to acetaminophen. Compelling data on the benefit of fever warrant further research and review to determine when to treat or withhold ibuprofen for early stage fever for COVID-19 and other related viral illnesses .” 24
- EXAMPLE 2. Exploratory hypothesis (qualitative research)
- - Explores particular areas deeper to clarify subjective experience and develop a formal hypothesis potentially testable in a future quantitative approach
- “We hypothesized that when thinking about a past experience of help-seeking, a self distancing prompt would cause increased help-seeking intentions and more favorable help-seeking outcome expectations .” 25
- “Conclusion
- Although a priori hypotheses were not supported, further research is warranted as results indicate the potential for using self-distancing approaches to increasing help-seeking among some people with depressive symptomatology.” 25
- EXAMPLE 3. Hypothesis-generating research to establish a framework for hypothesis testing (qualitative research)
- “We hypothesize that compassionate care is beneficial for patients (better outcomes), healthcare systems and payers (lower costs), and healthcare providers (lower burnout). ” 26
- Compassionomics is the branch of knowledge and scientific study of the effects of compassionate healthcare. Our main hypotheses are that compassionate healthcare is beneficial for (1) patients, by improving clinical outcomes, (2) healthcare systems and payers, by supporting financial sustainability, and (3) HCPs, by lowering burnout and promoting resilience and well-being. The purpose of this paper is to establish a scientific framework for testing the hypotheses above . If these hypotheses are confirmed through rigorous research, compassionomics will belong in the science of evidence-based medicine, with major implications for all healthcare domains.” 26
- EXAMPLE 4. Statistical hypothesis (quantitative research)
- - An assumption is made about the relationship among several population characteristics ( gender differences in sociodemographic and clinical characteristics of adults with ADHD ). Validity is tested by statistical experiment or analysis ( chi-square test, Students t-test, and logistic regression analysis)
- “Our research investigated gender differences in sociodemographic and clinical characteristics of adults with ADHD in a Japanese clinical sample. Due to unique Japanese cultural ideals and expectations of women's behavior that are in opposition to ADHD symptoms, we hypothesized that women with ADHD experience more difficulties and present more dysfunctions than men . We tested the following hypotheses: first, women with ADHD have more comorbidities than men with ADHD; second, women with ADHD experience more social hardships than men, such as having less full-time employment and being more likely to be divorced.” 27
- “Statistical Analysis
- ( text omitted ) Between-gender comparisons were made using the chi-squared test for categorical variables and Students t-test for continuous variables…( text omitted ). A logistic regression analysis was performed for employment status, marital status, and comorbidity to evaluate the independent effects of gender on these dependent variables.” 27
EXAMPLES OF HYPOTHESIS AS WRITTEN IN PUBLISHED ARTICLES IN RELATION TO OTHER PARTS
- EXAMPLE 1. Background, hypotheses, and aims are provided
- “Pregnant women need skilled care during pregnancy and childbirth, but that skilled care is often delayed in some countries …( text omitted ). The focused antenatal care (FANC) model of WHO recommends that nurses provide information or counseling to all pregnant women …( text omitted ). Job aids are visual support materials that provide the right kind of information using graphics and words in a simple and yet effective manner. When nurses are not highly trained or have many work details to attend to, these job aids can serve as a content reminder for the nurses and can be used for educating their patients (Jennings, Yebadokpo, Affo, & Agbogbe, 2010) ( text omitted ). Importantly, additional evidence is needed to confirm how job aids can further improve the quality of ANC counseling by health workers in maternal care …( text omitted )” 28
- “ This has led us to hypothesize that the quality of ANC counseling would be better if supported by job aids. Consequently, a better quality of ANC counseling is expected to produce higher levels of awareness concerning the danger signs of pregnancy and a more favorable impression of the caring behavior of nurses .” 28
- “This study aimed to examine the differences in the responses of pregnant women to a job aid-supported intervention during ANC visit in terms of 1) their understanding of the danger signs of pregnancy and 2) their impression of the caring behaviors of nurses to pregnant women in rural Tanzania.” 28
- EXAMPLE 2. Background, hypotheses, and aims are provided
- “We conducted a two-arm randomized controlled trial (RCT) to evaluate and compare changes in salivary cortisol and oxytocin levels of first-time pregnant women between experimental and control groups. The women in the experimental group touched and held an infant for 30 min (experimental intervention protocol), whereas those in the control group watched a DVD movie of an infant (control intervention protocol). The primary outcome was salivary cortisol level and the secondary outcome was salivary oxytocin level.” 29
- “ We hypothesize that at 30 min after touching and holding an infant, the salivary cortisol level will significantly decrease and the salivary oxytocin level will increase in the experimental group compared with the control group .” 29
- EXAMPLE 3. Background, aim, and hypothesis are provided
- “In countries where the maternal mortality ratio remains high, antenatal education to increase Birth Preparedness and Complication Readiness (BPCR) is considered one of the top priorities [1]. BPCR includes birth plans during the antenatal period, such as the birthplace, birth attendant, transportation, health facility for complications, expenses, and birth materials, as well as family coordination to achieve such birth plans. In Tanzania, although increasing, only about half of all pregnant women attend an antenatal clinic more than four times [4]. Moreover, the information provided during antenatal care (ANC) is insufficient. In the resource-poor settings, antenatal group education is a potential approach because of the limited time for individual counseling at antenatal clinics.” 30
- “This study aimed to evaluate an antenatal group education program among pregnant women and their families with respect to birth-preparedness and maternal and infant outcomes in rural villages of Tanzania.” 30
- “ The study hypothesis was if Tanzanian pregnant women and their families received a family-oriented antenatal group education, they would (1) have a higher level of BPCR, (2) attend antenatal clinic four or more times, (3) give birth in a health facility, (4) have less complications of women at birth, and (5) have less complications and deaths of infants than those who did not receive the education .” 30
Research questions and hypotheses are crucial components to any type of research, whether quantitative or qualitative. These questions should be developed at the very beginning of the study. Excellent research questions lead to superior hypotheses, which, like a compass, set the direction of research, and can often determine the successful conduct of the study. Many research studies have floundered because the development of research questions and subsequent hypotheses was not given the thought and meticulous attention needed. The development of research questions and hypotheses is an iterative process based on extensive knowledge of the literature and insightful grasp of the knowledge gap. Focused, concise, and specific research questions provide a strong foundation for constructing hypotheses which serve as formal predictions about the research outcomes. Research questions and hypotheses are crucial elements of research that should not be overlooked. They should be carefully thought of and constructed when planning research. This avoids unethical studies and poor outcomes by defining well-founded objectives that determine the design, course, and outcome of the study.
Disclosure: The authors have no potential conflicts of interest to disclose.
Author Contributions:
- Conceptualization: Barroga E, Matanguihan GJ.
- Methodology: Barroga E, Matanguihan GJ.
- Writing - original draft: Barroga E, Matanguihan GJ.
- Writing - review & editing: Barroga E, Matanguihan GJ.
Research Voyage
Research Tips and Infromation
How to Write Results Section of Your Research Paper

Introduction
How to summarize the data preprocessing steps in the results section, how to summarize the research findings in the results section, common phrasal verbs used in results section, what are common mistakes observed in the results section, how long should a results section be of a research paper, should the results of a research paper be given in the introduction or in another section.
- What is the difference between the "discussion" and the "results" section of a research paper?
Does the summary be part of the result section in the research article?
Why do some scientific papers not include a ‘methods and results’ section, how do you introduce a results section, why do researchers need to avoid making speculations in the results section of a research paper.
The result section is the third major part of the research paper and it’s probably the most important part because it contains actual outcomes about your experiment. The other sections contain a plan, hope and interpretations but the result section is the actual truth of your study.
In the result section, one should aim to narrate his/her finding without trying to interpret or evaluate them. Basically, the result section explains any issues you faced during your data collection, the main results of the experiment and any other interesting trends in the data.
With the results, we want to convey our data in the most accessible way, so we usually use visual elements like graphs and tables to make it easier to understand. The facts, figures, and findings are to be presented in a logical manner leading to the hypothesis and following the sequence of the method section. Mention must be made for the negative results as it would substantiate the discussion section later on. Interpretation of the meaning of the results section is done in the discussion section .
How Results Section is Structured?
When structuring the results section, it is important that your information is presented in a logical order.
Now, when it comes to the organization of the result section, as a generic rule
- Always start with textual content, not a Table or Figure
- Make sure you show the Tables and Figures after they are mentioned in the text
- Explain any missing data or problems you had while collecting the data.
The results section gives you the opportunity to:
- Summarize the Data Preprocessing Steps
2. Report on the Findings
3. Summarize the Research Findings
At the beginning of the result section, you can discuss how you have collected, transformed and analyzed your data. This step is usually known as data preprocessing.
The data collection step may involve collecting data from various hardware, software or internet sources.
If your research requires data cleaning, then explain the steps and procedures used for data cleaning. Here, the researchers can describe how they transformed data to facilitate analysis (e.g. converting data from one format to another format). If there was missing data, explain how you have substituted missing values and with what techniques you have substituted your data.
You can mention what software or statistical procedures you have used to analyze and interpret the data. Demonstrate with the help of charts or tables the cleansed data ready to be used for getting results. In a few research papers, you may find these steps appearing at the end of the method section.
How to Present your Research Findings in Research Section?
Second, present your findings in a structured way (such as thematically or chronologically), bringing the readers’ attention to any important, interesting, or significant findings.
Be sure to include a combination of text and visuals. Data illustrations should not be used to substitute or replace text, but to enhance the narrative of your findings.
Resultant data are to be presented either through text, figures, graphs or tables or in a combination of all of the best suited for leading to the hypothesis. Care should be taken to prevent any duplication of the text, figures, graphs, and tables. If any result is presented in figures or graphs, it need not be explained through text. Similarly, any data presented through the graph should not be repeated in the table.
Each table and graph should be clearly labelled and titled. Each different finding should be made in a separate sub-section under the proper sub-heading following the sequence adopted in Method Section.
If you are not comfortable with data analysis then you can take professional services for research data analysis .
Figures
Identify and list the figures which are relevant to your results. For example, if you are working on the problem statement of ” Identifying the pathological issues with pomegranate fruits”, then you can add the figures of pomegranate fruits with good quality and bad quality along with their stage of infection. If you are working on pomegranate cultivar-related issues, put the figures of pomegranate fruits belonging to different cultivars.
The key takeaway here is not to add any figures which may not directly contribute to results. These diagrams may include generic block diagrams, and images conveying generic information like farm fields, plantations etc.
While putting the figures, as much as possible use grayscale images as many users take the photocopies in black and white mode. In certain scenarios you are
In the case of figures, the captions should come below, called Fig. 1, Fig. 2 and so on.
You can visit my article on The Power of Images in Research Papers: How They Enhance the Quality of Your Paper? . This article will help you how images or figures enhances the possibility of selection of your paper to top quality journals and conferences.
Tables are good for showing the exact values or showing much different information in one place. Graphs are good for showing overall trends and are much easier to understand quickly. It also depends on your data.
Tables are labelled at the top as Table 1, Table 2 and so on. Every table must have a caption. It’s good if one can put independent variable conditions on the left side vertically, and the things you have measured horizontally so one can easily compare the measurements across the categories. But you need to decide for each table you make, what is easiest to understand, and what fits on the paper.
Visit article on Best Practices for Designing and Formatting Tables in Research Papers for further details on proper representation of tables at proper places.
You can use various types of graphs in your results like a line graph, bar graph, scatter plot, a line graph with colours, a box with whiskers plot and a histogram.
In general, continuous variables like temperature, growth, age, and time can be better displayed in a line graph on a scatter plot or maybe on histograms.
If you have comparative data that you would like to represent through a chart then a bar chart would be the best option. This type of chart is one of the more familiar options as it is easy to interpret.
These charts are useful for displaying data that is classified into nominal or ordinal categories. In any case, you need to decide which is the best option for each particular example you have, but never put a graph and a table with the same data in your paper.
In the case of graphs, the captions should come below, called Fig. 1, Fig. 2 and so on.
A limited number of professional tools provide you the chance to add some life to your graphs, charts, and figures and present your data in a way that will astound your audience as much as your astounding results.
My article on Maximizing the Impact of Your Research Paper with Graphs and Charts will help you in drawing eye catching and informative graphs and charts for your research paper.
The results section should include a closing paragraph that clearly summarizes the key findings of the study. This paves the way for the discussion section of the research paper, wherein the results are interpreted and put in conversation with existing literature.
Any unusual correlation observed between variables should be noted in the result section. But any speculation about the reason for such an unusual correlation should be avoided. Such speculations are the domains of the discussion section.
Comparisons between samples or controls are to be clearly defined by specifically mentioning the common quality and the degree of difference between the comparable samples or controls. Results should always be presented in the past tense.
Common academic phrases that can be used in the results section of a paper or research article. I have included a table with examples to illustrate how these phrases might be used:
| Phrase | Example |
|---|---|
| This phrase is used to describe the basic statistical properties of the data, such as mean, median, and standard deviation. | “The mean accuracy of the machine learning model was 0.85, with a standard deviation of 0.05.” |
| This phrase is used to describe statistical tests used to infer relationships or differences between groups. | “A one-way ANOVA showed a significant difference in performance between the three groups, F(2, 57) = 4.67, p < 0.05.” |
| This phrase is used to describe any graphs, charts, or other visual representations of the data. | “Figure 1 shows a scatter plot of the relationship between the number of hidden layers in a neural network and its accuracy on the test dataset.” |
| This phrase is used to compare the performance of different machine learning models. | “The random forest classifier outperformed the logistic regression model, achieving an AUC of 0.95 compared to 0.83.” |
| This phrase is used to test specific hypotheses about the data or the system being evaluated. | “The null hypothesis that there is no difference in accuracy between the two machine learning models was rejected, t(98) = -3.56, p < 0.01.” |
| : This phrase is used to describe any non-numerical analysis of the data, such as text analysis or content analysis. | “The open-ended survey responses were analyzed using a grounded theory approach to identify key themes and patterns in the data.” |
| This phrase is used to analyze errors or mistakes in the system or the data. | “The confusion matrix shows that the system had high false negative rates for some classes, indicating a potential bias in the data or the model.” |

Let’s look at some of the common mistakes which can be observed in the result section.
- One should not include raw data which are not directly related to your objectives. Readers will not be able to interpret your intentions and may unnecessarily collect unwanted data while replicating your experiments.
- Do not just tell the readers to look at the Table and Figure and figure it out by themselves, e.g “The results are shown in the following Tables and Graphs”.
- Do not give too much explanation about Figures and Tables.
“An Optimized Fuzzy Based Short Term Object Motion Prediction for Real-Life Robot Navigation Environment” ( Paper Link )
Object motions with different motion patterns are generated by a simulator in different directions to generate the initial rule base. The rules generated are clustered based on the direction of the motion pattern into the directional space clusters. Table 1 shows the number of rules that remained in each directional space after removing inconsistencies and redundancies.
| D1 | D2 | D3 | D4 | D5 | D6 | D7 | D8 |
| 143 | 178 | 146 | 152 | 141 | 172 | 144 | 183 |
Our predictor algorithm is tested for a real-life benchmark dataset (EC Funded CAVIAR project/IST 2001 37540) to check for relative error. The data set consists of different human motion patterns observed at INRIA Lab at Grenoble, France and Shop Centre. These motion patterns consist of frames captured at 25 frames/second. A typical scenario of the INRIA Lab and the Shop Centre is shown in the Figure below.

Fig.1: A typical scenario of the INRIA Lab and the Shop Centre
For each test case, the average response time is calculated to find its suitability for a real-life environment. The prediction algorithm is tested by processing the frame data of moving human patterns stored in the database at intervals of 50 frames (02 Seconds).
The navigation environment is presented in the form of a Prediction graph where the x-axis represents the Range parameter and the y-axis represents the Angle parameter. The predicted Angle and Range values are compared with actual values obtained from the real-life environment.

The performance of the predictor is tested when more than one object is sensed by the sensor. The tests are carried out assuming at most 6-8 objects can be visible and can affect the decisions to be made regarding robot traversal.
The results section is an essential component of any research paper, as it provides readers with a detailed understanding of the study’s findings. In this blog post, we discussed three important steps for writing a results section: summarizing the data preprocessing steps, reporting on the findings, and summarizing the research findings.
Firstly, summarizing the data preprocessing steps is crucial in the results section, as it provides readers with an understanding of how the raw data was processed and transformed. This step includes data cleaning, data transformation, and data reduction techniques. By summarizing the data preprocessing steps, readers can understand how the data was prepared for analysis, which is critical for interpreting the study’s findings accurately.
Secondly, reporting on the findings is an important step in the results section. It involves presenting the study’s results in a clear and concise manner, using tables, graphs, and statistical analyses where necessary. This step should be focused on answering the research question or hypothesis and should present the findings in a way that is easily understood by the reader. Reporting on the findings can also include providing detailed interpretations of the results, as well as any potential limitations of the study.
Finally, summarizing the research findings is crucial in the results section, as it provides readers with a concise summary of the study’s main results and conclusions. This step should be written in a clear and straightforward manner, highlighting the most important findings and explaining their significance. Additionally, it should relate the study’s findings to the research question or hypothesis and provide a conclusion that is well-supported by the results.
Overall, the results section of a research paper is a critical component that requires careful attention to detail. By following the guidelines discussed in this blog post, researchers can present their findings in a clear and concise manner, helping readers to understand the research process and the resulting conclusions.
Frequently Asked Questions
An IMRaD paper format suggests around 35% of the text should be dedicated to the results and discussion section. For a research paper of length 10 pages, the results and discussion section should occupy 3-4 pages.
The results of a research paper should be given in a separate section. However, the highlights of the results can be discussed in the introduction section.
What is the difference between the “discussion” and the “results” section of a research paper?
The results section only depicts the results obtained by implementing the methodology used. The results will be in the form of figures, tables, charts or graphs. The discussion section elaborates the analysis of the results obtained in the results section.
The summary can be part of the results section of a research paper. However, the results obtained can be summarized in the form of a table in results section of a research paper.
Survey papers and papers which are focussed on theoretical proofs do not involve separate methods and results sections.
The results section is introduced by the data collection steps and the setting up of equipment in different scenarios for obtaining the results.
Making speculations in the results section may lead to wrong interpretations by the researcher who is planning to replicate the methodology used for obtaining the results. This may further lead to wrong comparative analysis.
Upcoming Events
- Visit the Upcoming International Conferences at Exotic Travel Destinations with Travel Plan
- Visit for Research Internships Worldwide

Leave a Reply Cancel reply
You must be logged in to post a comment.
Recent Posts
- Top Mistakes to Avoid When Writing a Research Paper
- Average Stipend for Research/Academic Internships
- These Institutes Offer Remote Research/Academic Internships
- How to Include Your Journal in the UGC-CARE List? A Guide for Publishers
- Understanding UGC CARE Journals: A Comprehensive Guide
- All Blog Posts
- Research Career
- Research Conference
- Research Internship
- Research Journal
- Research Tools
- Uncategorized
- Research Conferences
- Research Journals
- Research Grants
- Internships
- Research Internships
- Email Templates
- Conferences
- Blog Partners
- Privacy Policy
Copyright © 2024 Research Voyage
Design by ThemesDNA.com

How to Write the Discussion Section of a Research Paper
The discussion section of a research paper analyzes and interprets the findings, provides context, compares them with previous studies, identifies limitations, and suggests future research directions.
Updated on September 15, 2023

Structure your discussion section right, and you’ll be cited more often while doing a greater service to the scientific community. So, what actually goes into the discussion section? And how do you write it?
The discussion section of your research paper is where you let the reader know how your study is positioned in the literature, what to take away from your paper, and how your work helps them. It can also include your conclusions and suggestions for future studies.
First, we’ll define all the parts of your discussion paper, and then look into how to write a strong, effective discussion section for your paper or manuscript.
Discussion section: what is it, what it does
The discussion section comes later in your paper, following the introduction, methods, and results. The discussion sets up your study’s conclusions. Its main goals are to present, interpret, and provide a context for your results.
What is it?
The discussion section provides an analysis and interpretation of the findings, compares them with previous studies, identifies limitations, and suggests future directions for research.
This section combines information from the preceding parts of your paper into a coherent story. By this point, the reader already knows why you did your study (introduction), how you did it (methods), and what happened (results). In the discussion, you’ll help the reader connect the ideas from these sections.
Why is it necessary?
The discussion provides context and interpretations for the results. It also answers the questions posed in the introduction. While the results section describes your findings, the discussion explains what they say. This is also where you can describe the impact or implications of your research.
Adds context for your results
Most research studies aim to answer a question, replicate a finding, or address limitations in the literature. These goals are first described in the introduction. However, in the discussion section, the author can refer back to them to explain how the study's objective was achieved.
Shows what your results actually mean and real-world implications
The discussion can also describe the effect of your findings on research or practice. How are your results significant for readers, other researchers, or policymakers?
What to include in your discussion (in the correct order)
A complete and effective discussion section should at least touch on the points described below.
Summary of key findings
The discussion should begin with a brief factual summary of the results. Concisely overview the main results you obtained.
Begin with key findings with supporting evidence
Your results section described a list of findings, but what message do they send when you look at them all together?
Your findings were detailed in the results section, so there’s no need to repeat them here, but do provide at least a few highlights. This will help refresh the reader’s memory and help them focus on the big picture.
Read the first paragraph of the discussion section in this article (PDF) for an example of how to start this part of your paper. Notice how the authors break down their results and follow each description sentence with an explanation of why each finding is relevant.
State clearly and concisely
Following a clear and direct writing style is especially important in the discussion section. After all, this is where you will make some of the most impactful points in your paper. While the results section often contains technical vocabulary, such as statistical terms, the discussion section lets you describe your findings more clearly.
Interpretation of results
Once you’ve given your reader an overview of your results, you need to interpret those results. In other words, what do your results mean? Discuss the findings’ implications and significance in relation to your research question or hypothesis.
Analyze and interpret your findings
Look into your findings and explore what’s behind them or what may have caused them. If your introduction cited theories or studies that could explain your findings, use these sources as a basis to discuss your results.
For example, look at the second paragraph in the discussion section of this article on waggling honey bees. Here, the authors explore their results based on information from the literature.
Unexpected or contradictory results
Sometimes, your findings are not what you expect. Here’s where you describe this and try to find a reason for it. Could it be because of the method you used? Does it have something to do with the variables analyzed? Comparing your methods with those of other similar studies can help with this task.
Context and comparison with previous work
Refer to related studies to place your research in a larger context and the literature. Compare and contrast your findings with existing literature, highlighting similarities, differences, and/or contradictions.
How your work compares or contrasts with previous work
Studies with similar findings to yours can be cited to show the strength of your findings. Information from these studies can also be used to help explain your results. Differences between your findings and others in the literature can also be discussed here.
How to divide this section into subsections
If you have more than one objective in your study or many key findings, you can dedicate a separate section to each of these. Here’s an example of this approach. You can see that the discussion section is divided into topics and even has a separate heading for each of them.
Limitations
Many journals require you to include the limitations of your study in the discussion. Even if they don’t, there are good reasons to mention these in your paper.
Why limitations don’t have a negative connotation
A study’s limitations are points to be improved upon in future research. While some of these may be flaws in your method, many may be due to factors you couldn’t predict.
Examples include time constraints or small sample sizes. Pointing this out will help future researchers avoid or address these issues. This part of the discussion can also include any attempts you have made to reduce the impact of these limitations, as in this study .
How limitations add to a researcher's credibility
Pointing out the limitations of your study demonstrates transparency. It also shows that you know your methods well and can conduct a critical assessment of them.
Implications and significance
The final paragraph of the discussion section should contain the take-home messages for your study. It can also cite the “strong points” of your study, to contrast with the limitations section.
Restate your hypothesis
Remind the reader what your hypothesis was before you conducted the study.
How was it proven or disproven?
Identify your main findings and describe how they relate to your hypothesis.
How your results contribute to the literature
Were you able to answer your research question? Or address a gap in the literature?
Future implications of your research
Describe the impact that your results may have on the topic of study. Your results may show, for instance, that there are still limitations in the literature for future studies to address. There may be a need for studies that extend your findings in a specific way. You also may need additional research to corroborate your findings.
Sample discussion section
This fictitious example covers all the aspects discussed above. Your actual discussion section will probably be much longer, but you can read this to get an idea of everything your discussion should cover.
Our results showed that the presence of cats in a household is associated with higher levels of perceived happiness by its human occupants. These findings support our hypothesis and demonstrate the association between pet ownership and well-being.
The present findings align with those of Bao and Schreer (2016) and Hardie et al. (2023), who observed greater life satisfaction in pet owners relative to non-owners. Although the present study did not directly evaluate life satisfaction, this factor may explain the association between happiness and cat ownership observed in our sample.
Our findings must be interpreted in light of some limitations, such as the focus on cat ownership only rather than pets as a whole. This may limit the generalizability of our results.
Nevertheless, this study had several strengths. These include its strict exclusion criteria and use of a standardized assessment instrument to investigate the relationships between pets and owners. These attributes bolster the accuracy of our results and reduce the influence of confounding factors, increasing the strength of our conclusions. Future studies may examine the factors that mediate the association between pet ownership and happiness to better comprehend this phenomenon.
This brief discussion begins with a quick summary of the results and hypothesis. The next paragraph cites previous research and compares its findings to those of this study. Information from previous studies is also used to help interpret the findings. After discussing the results of the study, some limitations are pointed out. The paper also explains why these limitations may influence the interpretation of results. Then, final conclusions are drawn based on the study, and directions for future research are suggested.
How to make your discussion flow naturally
If you find writing in scientific English challenging, the discussion and conclusions are often the hardest parts of the paper to write. That’s because you’re not just listing up studies, methods, and outcomes. You’re actually expressing your thoughts and interpretations in words.
- How formal should it be?
- What words should you use, or not use?
- How do you meet strict word limits, or make it longer and more informative?
Always give it your best, but sometimes a helping hand can, well, help. Getting a professional edit can help clarify your work’s importance while improving the English used to explain it. When readers know the value of your work, they’ll cite it. We’ll assign your study to an expert editor knowledgeable in your area of research. Their work will clarify your discussion, helping it to tell your story. Find out more about AJE Editing.

Adam Goulston, PsyD, MS, MBA, MISD, ELS
Science Marketing Consultant
See our "Privacy Policy"
Ensure your structure and ideas are consistent and clearly communicated
Pair your Premium Editing with our add-on service Presubmission Review for an overall assessment of your manuscript.
Have a language expert improve your writing
Run a free plagiarism check in 10 minutes, generate accurate citations for free.
- Knowledge Base
Methodology
- Data Collection | Definition, Methods & Examples
Data Collection | Definition, Methods & Examples
Published on June 5, 2020 by Pritha Bhandari . Revised on June 21, 2023.
Data collection is a systematic process of gathering observations or measurements. Whether you are performing research for business, governmental or academic purposes, data collection allows you to gain first-hand knowledge and original insights into your research problem .
While methods and aims may differ between fields, the overall process of data collection remains largely the same. Before you begin collecting data, you need to consider:
- The aim of the research
- The type of data that you will collect
- The methods and procedures you will use to collect, store, and process the data
To collect high-quality data that is relevant to your purposes, follow these four steps.
Table of contents
Step 1: define the aim of your research, step 2: choose your data collection method, step 3: plan your data collection procedures, step 4: collect the data, other interesting articles, frequently asked questions about data collection.
Before you start the process of data collection, you need to identify exactly what you want to achieve. You can start by writing a problem statement : what is the practical or scientific issue that you want to address and why does it matter?
Next, formulate one or more research questions that precisely define what you want to find out. Depending on your research questions, you might need to collect quantitative or qualitative data :
- Quantitative data is expressed in numbers and graphs and is analyzed through statistical methods .
- Qualitative data is expressed in words and analyzed through interpretations and categorizations.
If your aim is to test a hypothesis , measure something precisely, or gain large-scale statistical insights, collect quantitative data. If your aim is to explore ideas, understand experiences, or gain detailed insights into a specific context, collect qualitative data. If you have several aims, you can use a mixed methods approach that collects both types of data.
- Your first aim is to assess whether there are significant differences in perceptions of managers across different departments and office locations.
- Your second aim is to gather meaningful feedback from employees to explore new ideas for how managers can improve.
Receive feedback on language, structure, and formatting
Professional editors proofread and edit your paper by focusing on:
- Academic style
- Vague sentences
- Style consistency
See an example

Based on the data you want to collect, decide which method is best suited for your research.
- Experimental research is primarily a quantitative method.
- Interviews , focus groups , and ethnographies are qualitative methods.
- Surveys , observations, archival research and secondary data collection can be quantitative or qualitative methods.
Carefully consider what method you will use to gather data that helps you directly answer your research questions.
| Method | When to use | How to collect data |
|---|---|---|
| Experiment | To test a causal relationship. | Manipulate variables and measure their effects on others. |
| Survey | To understand the general characteristics or opinions of a group of people. | Distribute a list of questions to a sample online, in person or over-the-phone. |
| Interview/focus group | To gain an in-depth understanding of perceptions or opinions on a topic. | Verbally ask participants open-ended questions in individual interviews or focus group discussions. |
| Observation | To understand something in its natural setting. | Measure or survey a sample without trying to affect them. |
| Ethnography | To study the culture of a community or organization first-hand. | Join and participate in a community and record your observations and reflections. |
| Archival research | To understand current or historical events, conditions or practices. | Access manuscripts, documents or records from libraries, depositories or the internet. |
| Secondary data collection | To analyze data from populations that you can’t access first-hand. | Find existing datasets that have already been collected, from sources such as government agencies or research organizations. |
When you know which method(s) you are using, you need to plan exactly how you will implement them. What procedures will you follow to make accurate observations or measurements of the variables you are interested in?
For instance, if you’re conducting surveys or interviews, decide what form the questions will take; if you’re conducting an experiment, make decisions about your experimental design (e.g., determine inclusion and exclusion criteria ).
Operationalization
Sometimes your variables can be measured directly: for example, you can collect data on the average age of employees simply by asking for dates of birth. However, often you’ll be interested in collecting data on more abstract concepts or variables that can’t be directly observed.
Operationalization means turning abstract conceptual ideas into measurable observations. When planning how you will collect data, you need to translate the conceptual definition of what you want to study into the operational definition of what you will actually measure.
- You ask managers to rate their own leadership skills on 5-point scales assessing the ability to delegate, decisiveness and dependability.
- You ask their direct employees to provide anonymous feedback on the managers regarding the same topics.
You may need to develop a sampling plan to obtain data systematically. This involves defining a population , the group you want to draw conclusions about, and a sample, the group you will actually collect data from.
Your sampling method will determine how you recruit participants or obtain measurements for your study. To decide on a sampling method you will need to consider factors like the required sample size, accessibility of the sample, and timeframe of the data collection.
Standardizing procedures
If multiple researchers are involved, write a detailed manual to standardize data collection procedures in your study.
This means laying out specific step-by-step instructions so that everyone in your research team collects data in a consistent way – for example, by conducting experiments under the same conditions and using objective criteria to record and categorize observations. This helps you avoid common research biases like omitted variable bias or information bias .
This helps ensure the reliability of your data, and you can also use it to replicate the study in the future.
Creating a data management plan
Before beginning data collection, you should also decide how you will organize and store your data.
- If you are collecting data from people, you will likely need to anonymize and safeguard the data to prevent leaks of sensitive information (e.g. names or identity numbers).
- If you are collecting data via interviews or pencil-and-paper formats, you will need to perform transcriptions or data entry in systematic ways to minimize distortion.
- You can prevent loss of data by having an organization system that is routinely backed up.
Finally, you can implement your chosen methods to measure or observe the variables you are interested in.
The closed-ended questions ask participants to rate their manager’s leadership skills on scales from 1–5. The data produced is numerical and can be statistically analyzed for averages and patterns.
To ensure that high quality data is recorded in a systematic way, here are some best practices:
- Record all relevant information as and when you obtain data. For example, note down whether or how lab equipment is recalibrated during an experimental study.
- Double-check manual data entry for errors.
- If you collect quantitative data, you can assess the reliability and validity to get an indication of your data quality.
Prevent plagiarism. Run a free check.
If you want to know more about statistics , methodology , or research bias , make sure to check out some of our other articles with explanations and examples.
- Student’s t -distribution
- Normal distribution
- Null and Alternative Hypotheses
- Chi square tests
- Confidence interval
- Cluster sampling
- Stratified sampling
- Data cleansing
- Reproducibility vs Replicability
- Peer review
- Likert scale
Research bias
- Implicit bias
- Framing effect
- Cognitive bias
- Placebo effect
- Hawthorne effect
- Hindsight bias
- Affect heuristic
Data collection is the systematic process by which observations or measurements are gathered in research. It is used in many different contexts by academics, governments, businesses, and other organizations.
When conducting research, collecting original data has significant advantages:
- You can tailor data collection to your specific research aims (e.g. understanding the needs of your consumers or user testing your website)
- You can control and standardize the process for high reliability and validity (e.g. choosing appropriate measurements and sampling methods )
However, there are also some drawbacks: data collection can be time-consuming, labor-intensive and expensive. In some cases, it’s more efficient to use secondary data that has already been collected by someone else, but the data might be less reliable.
Quantitative research deals with numbers and statistics, while qualitative research deals with words and meanings.
Quantitative methods allow you to systematically measure variables and test hypotheses . Qualitative methods allow you to explore concepts and experiences in more detail.
Reliability and validity are both about how well a method measures something:
- Reliability refers to the consistency of a measure (whether the results can be reproduced under the same conditions).
- Validity refers to the accuracy of a measure (whether the results really do represent what they are supposed to measure).
If you are doing experimental research, you also have to consider the internal and external validity of your experiment.
Operationalization means turning abstract conceptual ideas into measurable observations.
For example, the concept of social anxiety isn’t directly observable, but it can be operationally defined in terms of self-rating scores, behavioral avoidance of crowded places, or physical anxiety symptoms in social situations.
Before collecting data , it’s important to consider how you will operationalize the variables that you want to measure.
In mixed methods research , you use both qualitative and quantitative data collection and analysis methods to answer your research question .
Cite this Scribbr article
If you want to cite this source, you can copy and paste the citation or click the “Cite this Scribbr article” button to automatically add the citation to our free Citation Generator.
Bhandari, P. (2023, June 21). Data Collection | Definition, Methods & Examples. Scribbr. Retrieved June 20, 2024, from https://www.scribbr.com/methodology/data-collection/
Is this article helpful?

Pritha Bhandari
Other students also liked, qualitative vs. quantitative research | differences, examples & methods, sampling methods | types, techniques & examples, "i thought ai proofreading was useless but..".
I've been using Scribbr for years now and I know it's a service that won't disappoint. It does a good job spotting mistakes”
Educational resources and simple solutions for your research journey

How to Write the Methods Section of a Research Paper
Writing a research paper is both an art and a skill, and knowing how to write the methods section of a research paper is the first crucial step in mastering scientific writing. If, like the majority of early career researchers, you believe that the methods section is the simplest to write and needs little in the way of careful consideration or thought, this article will help you understand it is not 1 .
We have all probably asked our supervisors, coworkers, or search engines “ how to write a methods section of a research paper ” at some point in our scientific careers, so you are not alone if that’s how you ended up here. Even for seasoned researchers, selecting what to include in the methods section from a wealth of experimental information can occasionally be a source of distress and perplexity.
Additionally, journal specifications, in some cases, may make it more of a requirement rather than a choice to provide a selective yet descriptive account of the experimental procedure. Hence, knowing these nuances of how to write the methods section of a research paper is critical to its success. The methods section of the research paper is not supposed to be a detailed heavy, dull section that some researchers tend to write; rather, it should be the central component of the study that justifies the validity and reliability of the research.
Are you still unsure of how the methods section of a research paper forms the basis of every investigation? Consider the last article you read but ignore the methods section and concentrate on the other parts of the paper . Now think whether you could repeat the study and be sure of the credibility of the findings despite knowing the literature review and even having the data in front of you. You have the answer!

Having established the importance of the methods section , the next question is how to write the methods section of a research paper that unifies the overall study. The purpose of the methods section , which was earlier called as Materials and Methods , is to describe how the authors went about answering the “research question” at hand. Here, the objective is to tell a coherent story that gives a detailed account of how the study was conducted, the rationale behind specific experimental procedures, the experimental setup, objects (variables) involved, the research protocol employed, tools utilized to measure, calculations and measurements, and the analysis of the collected data 2 .
In this article, we will take a deep dive into this topic and provide a detailed overview of how to write the methods section of a research paper . For the sake of clarity, we have separated the subject into various sections with corresponding subheadings.
Table of Contents
What is the methods section of a research paper ?
The methods section is a fundamental section of any paper since it typically discusses the ‘ what ’, ‘ how ’, ‘ which ’, and ‘ why ’ of the study, which is necessary to arrive at the final conclusions. In a research article, the introduction, which serves to set the foundation for comprehending the background and results is usually followed by the methods section, which precedes the result and discussion sections. The methods section must explicitly state what was done, how it was done, which equipment, tools and techniques were utilized, how were the measurements/calculations taken, and why specific research protocols, software, and analytical methods were employed.
Why is the methods section important?
The primary goal of the methods section is to provide pertinent details about the experimental approach so that the reader may put the results in perspective and, if necessary, replicate the findings 3 . This section offers readers the chance to evaluate the reliability and validity of any study. In short, it also serves as the study’s blueprint, assisting researchers who might be unsure about any other portion in establishing the study’s context and validity. The methods plays a rather crucial role in determining the fate of the article; an incomplete and unreliable methods section can frequently result in early rejections and may lead to numerous rounds of modifications during the publication process. This means that the reviewers also often use methods section to assess the reliability and validity of the research protocol and the data analysis employed to address the research topic. In other words, the purpose of the methods section is to demonstrate the research acumen and subject-matter expertise of the author(s) in their field.
Structure of methods section of a research paper
Similar to the research paper, the methods section also follows a defined structure; this may be dictated by the guidelines of a specific journal or can be presented in a chronological or thematic manner based on the study type. When writing the methods section , authors should keep in mind that they are telling a story about how the research was conducted. They should only report relevant information to avoid confusing the reader and include details that would aid in connecting various aspects of the entire research activity together. It is generally advisable to present experiments in the order in which they were conducted. This facilitates the logical flow of the research and allows readers to follow the progression of the study design.

It is also essential to clearly state the rationale behind each experiment and how the findings of earlier experiments informed the design or interpretation of later experiments. This allows the readers to understand the overall purpose of the study design and the significance of each experiment within that context. However, depending on the particular research question and method, it may make sense to present information in a different order; therefore, authors must select the best structure and strategy for their individual studies.
In cases where there is a lot of information, divide the sections into subheadings to cover the pertinent details. If the journal guidelines pose restrictions on the word limit , additional important information can be supplied in the supplementary files. A simple rule of thumb for sectioning the method section is to begin by explaining the methodological approach ( what was done ), describing the data collection methods ( how it was done ), providing the analysis method ( how the data was analyzed ), and explaining the rationale for choosing the methodological strategy. This is described in detail in the upcoming sections.
How to write the methods section of a research paper
Contrary to widespread assumption, the methods section of a research paper should be prepared once the study is complete to prevent missing any key parameter. Hence, please make sure that all relevant experiments are done before you start writing a methods section . The next step for authors is to look up any applicable academic style manuals or journal-specific standards to ensure that the methods section is formatted correctly. The methods section of a research paper typically constitutes materials and methods; while writing this section, authors usually arrange the information under each category.
The materials category describes the samples, materials, treatments, and instruments, while experimental design, sample preparation, data collection, and data analysis are a part of the method category. According to the nature of the study, authors should include additional subsections within the methods section, such as ethical considerations like the declaration of Helsinki (for studies involving human subjects), demographic information of the participants, and any other crucial information that can affect the output of the study. Simply put, the methods section has two major components: content and format. Here is an easy checklist for you to consider if you are struggling with how to write the methods section of a research paper .
- Explain the research design, subjects, and sample details
- Include information on inclusion and exclusion criteria
- Mention ethical or any other permission required for the study
- Include information about materials, experimental setup, tools, and software
- Add details of data collection and analysis methods
- Incorporate how research biases were avoided or confounding variables were controlled
- Evaluate and justify the experimental procedure selected to address the research question
- Provide precise and clear details of each experiment
- Flowcharts, infographics, or tables can be used to present complex information
- Use past tense to show that the experiments have been done
- Follow academic style guides (such as APA or MLA ) to structure the content
- Citations should be included as per standard protocols in the field
Now that you know how to write the methods section of a research paper , let’s address another challenge researchers face while writing the methods section —what to include in the methods section . How much information is too much is not always obvious when it comes to trying to include data in the methods section of a paper. In the next section, we examine this issue and explore potential solutions.

What to include in the methods section of a research paper
The technical nature of the methods section occasionally makes it harder to present the information clearly and concisely while staying within the study context. Many young researchers tend to veer off subject significantly, and they frequently commit the sin of becoming bogged down in itty bitty details, making the text harder to read and impairing its overall flow. However, the best way to write the methods section is to start with crucial components of the experiments. If you have trouble deciding which elements are essential, think about leaving out those that would make it more challenging to comprehend the context or replicate the results. The top-down approach helps to ensure all relevant information is incorporated and vital information is not lost in technicalities. Next, remember to add details that are significant to assess the validity and reliability of the study. Here is a simple checklist for you to follow ( bonus tip: you can also make a checklist for your own study to avoid missing any critical information while writing the methods section ).
- Structuring the methods section : Authors should diligently follow journal guidelines and adhere to the specific author instructions provided when writing the methods section . Journals typically have specific guidelines for formatting the methods section ; for example, Frontiers in Plant Sciences advises arranging the materials and methods section by subheading and citing relevant literature. There are several standardized checklists available for different study types in the biomedical field, including CONSORT (Consolidated Standards of Reporting Trials) for randomized clinical trials, PRISMA (Preferred Reporting Items for Systematic reviews and Meta-Analysis) for systematic reviews and meta-analysis, and STROBE (STrengthening the Reporting of OBservational studies in Epidemiology) for cohort, case-control, cross-sectional studies. Before starting the methods section , check the checklist available in your field that can function as a guide.
- Organizing different sections to tell a story : Once you are sure of the format required for structuring the methods section , the next is to present the sections in a logical manner; as mentioned earlier, the sections can be organized according to the chronology or themes. In the chronological arrangement, you should discuss the methods in accordance with how the experiments were carried out. An example of the method section of a research paper of an animal study should first ideally include information about the species, weight, sex, strain, and age. Next, the number of animals, their initial conditions, and their living and housing conditions should also be mentioned. Second, how the groups are assigned and the intervention (drug treatment, stress, or other) given to each group, and finally, the details of tools and techniques used to measure, collect, and analyze the data. Experiments involving animal or human subjects should additionally state an ethics approval statement. It is best to arrange the section using the thematic approach when discussing distinct experiments not following a sequential order.
- Define and explain the objects and procedure: Experimental procedure should clearly be stated in the methods section . Samples, necessary preparations (samples, treatment, and drug), and methods for manipulation need to be included. All variables (control, dependent, independent, and confounding) must be clearly defined, particularly if the confounding variables can affect the outcome of the study.
- Match the order of the methods section with the order of results: Though not mandatory, organizing the manuscript in a logical and coherent manner can improve the readability and clarity of the paper. This can be done by following a consistent structure throughout the manuscript; readers can easily navigate through the different sections and understand the methods and results in relation to each other. Using experiment names as headings for both the methods and results sections can also make it simpler for readers to locate specific information and corroborate it if needed.
- Relevant information must always be included: The methods section should have information on all experiments conducted and their details clearly mentioned. Ask the journal whether there is a way to offer more information in the supplemental files or external repositories if your target journal has strict word limitations. For example, Nature communications encourages authors to deposit their step-by-step protocols in an open-resource depository, Protocol Exchange which allows the protocols to be linked with the manuscript upon publication. Providing access to detailed protocols also helps to increase the transparency and reproducibility of the research.
- It’s all in the details: The methods section should meticulously list all the materials, tools, instruments, and software used for different experiments. Specify the testing equipment on which data was obtained, together with its manufacturer’s information, location, city, and state or any other stimuli used to manipulate the variables. Provide specifics on the research process you employed; if it was a standard protocol, cite previous studies that also used the protocol. Include any protocol modifications that were made, as well as any other factors that were taken into account when planning the study or gathering data. Any new or modified techniques should be explained by the authors. Typically, readers evaluate the reliability and validity of the procedures using the cited literature, and a widely accepted checklist helps to support the credibility of the methodology. Note: Authors should include a statement on sample size estimation (if applicable), which is often missed. It enables the reader to determine how many subjects will be required to detect the expected change in the outcome variables within a given confidence interval.
- Write for the audience: While explaining the details in the methods section , authors should be mindful of their target audience, as some of the rationale or assumptions on which specific procedures are based might not always be obvious to the audience, particularly for a general audience. Therefore, when in doubt, the objective of a procedure should be specified either in relation to the research question or to the entire protocol.
- Data interpretation and analysis : Information on data processing, statistical testing, levels of significance, and analysis tools and software should be added. Mention if the recommendations and expertise of an experienced statistician were followed. Also, evaluate and justify the preferred statistical method used in the study and its significance.
What NOT to include in the methods section of a research paper
To address “ how to write the methods section of a research paper ”, authors should not only pay careful attention to what to include but also what not to include in the methods section of a research paper . Here is a list of do not’s when writing the methods section :
- Do not elaborate on specifics of standard methods/procedures: You should refrain from adding unnecessary details of experiments and practices that are well established and cited previously. Instead, simply cite relevant literature or mention if the manufacturer’s protocol was followed.
- Do not add unnecessary details : Do not include minute details of the experimental procedure and materials/instruments used that are not significant for the outcome of the experiment. For example, there is no need to mention the brand name of the water bath used for incubation.
- Do not discuss the results: The methods section is not to discuss the results or refer to the tables and figures; save it for the results and discussion section. Also, focus on the methods selected to conduct the study and avoid diverting to other methods or commenting on their pros or cons.
- Do not make the section bulky : For extensive methods and protocols, provide the essential details and share the rest of the information in the supplemental files. The writing should be clear yet concise to maintain the flow of the section.
We hope that by this point, you understand how crucial it is to write a thoughtful and precise methods section and the ins and outs of how to write the methods section of a research paper . To restate, the entire purpose of the methods section is to enable others to reproduce the results or verify the research. We sincerely hope that this post has cleared up any confusion and given you a fresh perspective on the methods section .
As a parting gift, we’re leaving you with a handy checklist that will help you understand how to write the methods section of a research paper . Feel free to download this checklist and use or share this with those who you think may benefit from it.
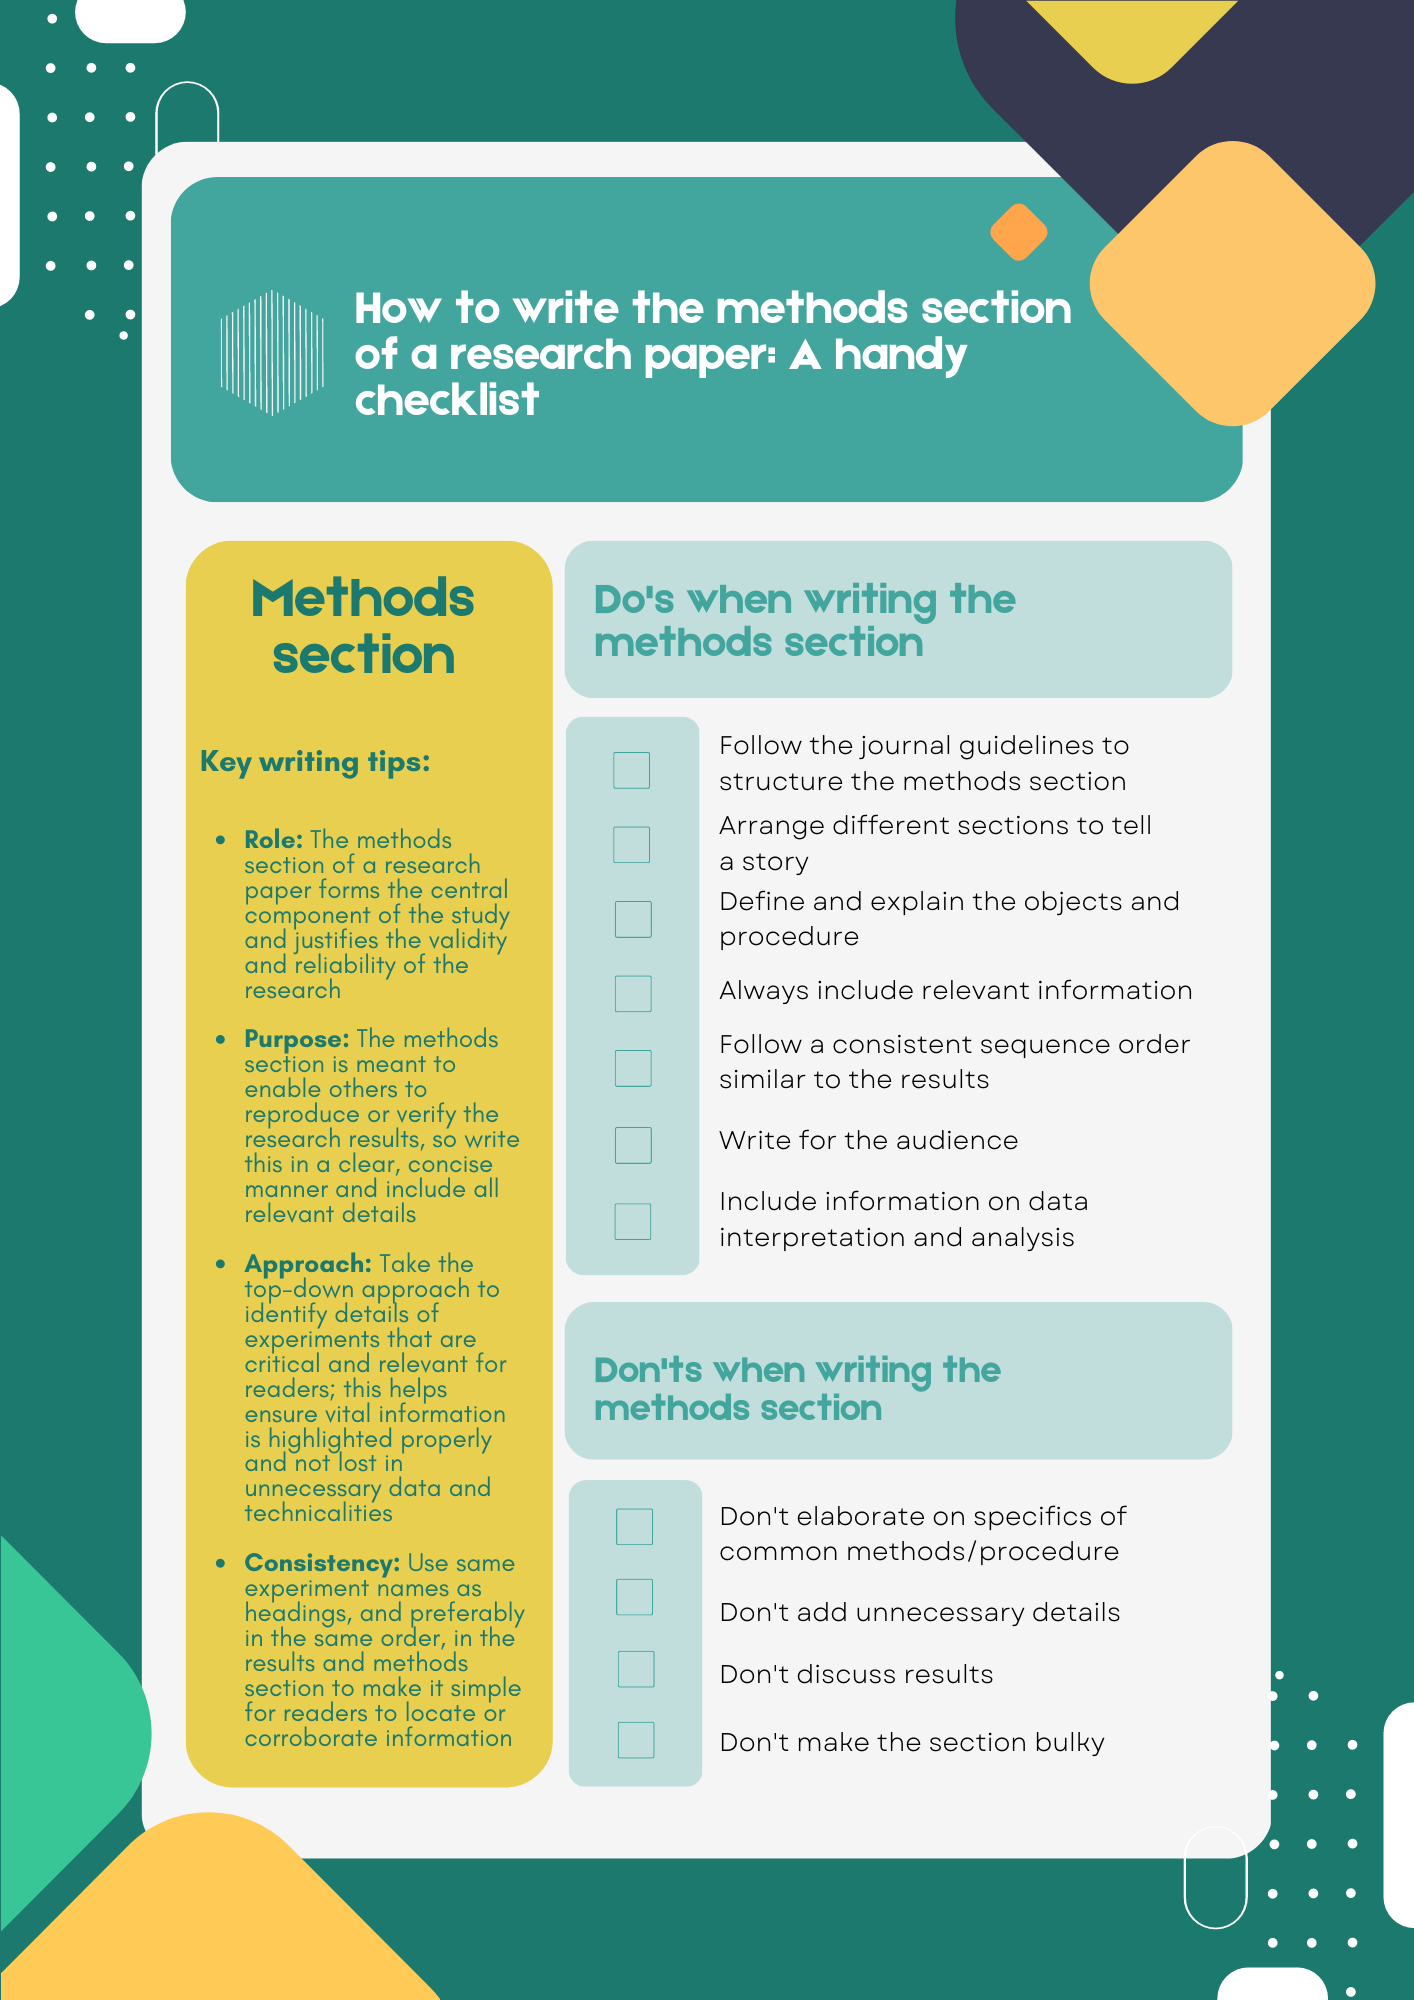
References
- Bhattacharya, D. How to write the Methods section of a research paper. Editage Insights, 2018. https://www.editage.com/insights/how-to-write-the-methods-section-of-a-research-paper (2018).
- Kallet, R. H. How to Write the Methods Section of a Research Paper. Respiratory Care 49, 1229–1232 (2004). https://pubmed.ncbi.nlm.nih.gov/15447808/
- Grindstaff, T. L. & Saliba, S. A. AVOIDING MANUSCRIPT MISTAKES. Int J Sports Phys Ther 7, 518–524 (2012). https://www.ncbi.nlm.nih.gov/pmc/articles/PMC3474299/
Researcher.Life is a subscription-based platform that unifies the best AI tools and services designed to speed up, simplify, and streamline every step of a researcher’s journey. The Researcher.Life All Access Pack is a one-of-a-kind subscription that unlocks full access to an AI writing assistant, literature recommender, journal finder, scientific illustration tool, and exclusive discounts on professional publication services from Editage.
Based on 21+ years of experience in academia, Researcher.Life All Access empowers researchers to put their best research forward and move closer to success. Explore our top AI Tools pack, AI Tools + Publication Services pack, or Build Your Own Plan. Find everything a researcher needs to succeed, all in one place – Get All Access now starting at just $17 a month !
Related Posts

What is Research? Definition, Types, Methods, and Examples

Turabian Format: A Beginner’s Guide
Advanced essay writing guides for everyone
- Papers From Scratch
- Data Analysis Section
- Essay About Maturity
- MLA Formatting
- Informative Essay Writing
- 22 Great Examples
- Computer Science Papers
- Persuasive Essay Topics
- Argumentative Essay Topics
Helpful Tips on Composing a Research Paper Data Analysis Section
If you are given a research paper assignment, you should create a list of tasks to be done and try to stick to your working schedule. It is recommended that you complete your research and then start writing your work. One of the important steps is to prepare your data analysis section. However, that step is vital as it aims to explain how the data will be described in the results section. Use the following helpful tips to complete that section without a hitch.
17% OFF on your first order Type the code 17TUDENT
How to Compose a Data Analysis Section for Your Research Paper
Usually, a data analysis section is provided right after the methods and approaches used. There, you should explain how you organized your data, what statistical tests were applied, and how you evaluated the obtained results. Follow these simple tips to compose a strong piece of writing:
- Avoid analyzing your results in the data analysis section.
- Indicate whether your research is quantitative or qualitative.
- Provide your main research questions and the analysis methods that were applied to answer them.
- Report what software you used to gather and analyze your data.
- List the data sources, including electronic archives and online reports of different institutions.
- Explain how the data were summarized and what measures of variability you have used.
- Remember to mention the data transformations if any, including data normalizing.
- Make sure that you included the full name of statistical tests used.
- Describe graphical techniques used to analyze the raw data and the results.
Where to Find the Necessary Assistance If You Get Stuck
Research paper writing is hard, so if you get stuck, do not wait for enlightenment and start searching for some assistance. It is a good idea to consult a statistics expert if you have a large amount of data and have no idea on how to summarize it. Your academic advisor may suggest you where to find a statistician to ask your questions.
Another great help option is getting a sample of a data analysis section. At the school’s library, you can find sample research papers written by your fellow students, get a few works, and study how the students analyzed data. Pay special attention to the word choices and the structure of the writing.
If you decide to follow a section template, you should be careful and keep your professor’s instructions in mind. For example, you may be asked to place all the page-long data tables in the appendices or build graphs instead of providing tables.
2024 | tartanpr.com
Unfortunately we don't fully support your browser. If you have the option to, please upgrade to a newer version or use Mozilla Firefox , Microsoft Edge , Google Chrome , or Safari 14 or newer. If you are unable to, and need support, please send us your feedback .
We'd appreciate your feedback. Tell us what you think! opens in new tab/window
CRediT author statement
CRediT (Contributor Roles Taxonomy) was introduced with the intention of recognizing individual author contributions, reducing authorship disputes and facilitating collaboration. The idea came about following a 2012 collaborative workshop led by Harvard University and the Wellcome Trust, with input from researchers, the International Committee of Medical Journal Editors (ICMJE) and publishers, including Elsevier, represented by Cell Press.
CRediT offers authors the opportunity to share an accurate and detailed description of their diverse contributions to the published work.
The corresponding author is responsible for ensuring that the descriptions are accurate and agreed by all authors
The role(s) of all authors should be listed, using the relevant above categories
Authors may have contributed in multiple roles
CRediT in no way changes the journal’s criteria to qualify for authorship
CRediT statements should be provided during the submission process and will appear above the acknowledgment section of the published paper as shown further below.
Term | Definition |
|---|---|
Conceptualization | Ideas; formulation or evolution of overarching research goals and aims |
Methodology | Development or design of methodology; creation of models |
Software | Programming, software development; designing computer programs; implementation of the computer code and supporting algorithms; testing of existing code components |
Validation | Verification, whether as a part of the activity or separate, of the overall replication/ reproducibility of results/experiments and other research outputs |
Formal analysis | Application of statistical, mathematical, computational, or other formal techniques to analyze or synthesize study data |
Investigation | Conducting a research and investigation process, specifically performing the experiments, or data/evidence collection |
Resources | Provision of study materials, reagents, materials, patients, laboratory samples, animals, instrumentation, computing resources, or other analysis tools |
Data Curation | Management activities to annotate (produce metadata), scrub data and maintain research data (including software code, where it is necessary for interpreting the data itself) for initial use and later reuse |
Writing - Original Draft | Preparation, creation and/or presentation of the published work, specifically writing the initial draft (including substantive translation) |
Writing - Review & Editing | Preparation, creation and/or presentation of the published work by those from the original research group, specifically critical review, commentary or revision – including pre-or postpublication stages |
Visualization | Preparation, creation and/or presentation of the published work, specifically visualization/ data presentation |
Supervision | Oversight and leadership responsibility for the research activity planning and execution, including mentorship external to the core team |
Project administration | Management and coordination responsibility for the research activity planning and execution |
Funding acquisition | Acquisition of the financial support for the project leading to this publication |
*Reproduced from Brand et al. (2015), Learned Publishing 28(2), with permission of the authors.
Sample CRediT author statement
Zhang San: Conceptualization, Methodology, Software Priya Singh. : Data curation, Writing- Original draft preparation. Wang Wu : Visualization, Investigation. Jan Jansen : Supervision. : Ajay Kumar : Software, Validation.: Sun Qi: Writing- Reviewing and Editing,
Read more about CRediT here opens in new tab/window or check out this article from Authors' Updat e: CRediT where credit's due .
Introducing Apple’s On-Device and Server Foundation Models
At the 2024 Worldwide Developers Conference , we introduced Apple Intelligence, a personal intelligence system integrated deeply into iOS 18, iPadOS 18, and macOS Sequoia.
Apple Intelligence is comprised of multiple highly-capable generative models that are specialized for our users’ everyday tasks, and can adapt on the fly for their current activity. The foundation models built into Apple Intelligence have been fine-tuned for user experiences such as writing and refining text, prioritizing and summarizing notifications, creating playful images for conversations with family and friends, and taking in-app actions to simplify interactions across apps.
In the following overview, we will detail how two of these models — a ~3 billion parameter on-device language model, and a larger server-based language model available with Private Cloud Compute and running on Apple silicon servers — have been built and adapted to perform specialized tasks efficiently, accurately, and responsibly. These two foundation models are part of a larger family of generative models created by Apple to support users and developers; this includes a coding model to build intelligence into Xcode, as well as a diffusion model to help users express themselves visually, for example, in the Messages app. We look forward to sharing more information soon on this broader set of models.
Our Focus on Responsible AI Development
Apple Intelligence is designed with our core values at every step and built on a foundation of groundbreaking privacy innovations.
Additionally, we have created a set of Responsible AI principles to guide how we develop AI tools, as well as the models that underpin them:
- Empower users with intelligent tools : We identify areas where AI can be used responsibly to create tools for addressing specific user needs. We respect how our users choose to use these tools to accomplish their goals.
- Represent our users : We build deeply personal products with the goal of representing users around the globe authentically. We work continuously to avoid perpetuating stereotypes and systemic biases across our AI tools and models.
- Design with care : We take precautions at every stage of our process, including design, model training, feature development, and quality evaluation to identify how our AI tools may be misused or lead to potential harm. We will continuously and proactively improve our AI tools with the help of user feedback.
- Protect privacy : We protect our users' privacy with powerful on-device processing and groundbreaking infrastructure like Private Cloud Compute. We do not use our users' private personal data or user interactions when training our foundation models.
These principles are reflected throughout the architecture that enables Apple Intelligence, connects features and tools with specialized models, and scans inputs and outputs to provide each feature with the information needed to function responsibly.
In the remainder of this overview, we provide details on decisions such as: how we develop models that are highly capable, fast, and power-efficient; how we approach training these models; how our adapters are fine-tuned for specific user needs; and how we evaluate model performance for both helpfulness and unintended harm.

Pre-Training
Our foundation models are trained on Apple's AXLearn framework , an open-source project we released in 2023. It builds on top of JAX and XLA, and allows us to train the models with high efficiency and scalability on various training hardware and cloud platforms, including TPUs and both cloud and on-premise GPUs. We used a combination of data parallelism, tensor parallelism, sequence parallelism, and Fully Sharded Data Parallel (FSDP) to scale training along multiple dimensions such as data, model, and sequence length.
We train our foundation models on licensed data, including data selected to enhance specific features, as well as publicly available data collected by our web-crawler, AppleBot. Web publishers have the option to opt out of the use of their web content for Apple Intelligence training with a data usage control.
We never use our users’ private personal data or user interactions when training our foundation models, and we apply filters to remove personally identifiable information like social security and credit card numbers that are publicly available on the Internet. We also filter profanity and other low-quality content to prevent its inclusion in the training corpus. In addition to filtering, we perform data extraction, deduplication, and the application of a model-based classifier to identify high quality documents.
Post-Training
We find that data quality is essential to model success, so we utilize a hybrid data strategy in our training pipeline, incorporating both human-annotated and synthetic data, and conduct thorough data curation and filtering procedures. We have developed two novel algorithms in post-training: (1) a rejection sampling fine-tuning algorithm with teacher committee, and (2) a reinforcement learning from human feedback (RLHF) algorithm with mirror descent policy optimization and a leave-one-out advantage estimator. We find that these two algorithms lead to significant improvement in the model’s instruction-following quality.
Optimization
In addition to ensuring our generative models are highly capable, we have used a range of innovative techniques to optimize them on-device and on our private cloud for speed and efficiency. We have applied an extensive set of optimizations for both first token and extended token inference performance.
Both the on-device and server models use grouped-query-attention. We use shared input and output vocab embedding tables to reduce memory requirements and inference cost. These shared embedding tensors are mapped without duplications. The on-device model uses a vocab size of 49K, while the server model uses a vocab size of 100K, which includes additional language and technical tokens.
For on-device inference, we use low-bit palletization, a critical optimization technique that achieves the necessary memory, power, and performance requirements. To maintain model quality, we developed a new framework using LoRA adapters that incorporates a mixed 2-bit and 4-bit configuration strategy — averaging 3.5 bits-per-weight — to achieve the same accuracy as the uncompressed models.
Additionally, we use an interactive model latency and power analysis tool, Talaria , to better guide the bit rate selection for each operation. We also utilize activation quantization and embedding quantization, and have developed an approach to enable efficient Key-Value (KV) cache update on our neural engines.
With this set of optimizations, on iPhone 15 Pro we are able to reach time-to-first-token latency of about 0.6 millisecond per prompt token, and a generation rate of 30 tokens per second. Notably, this performance is attained before employing token speculation techniques, from which we see further enhancement on the token generation rate.
Model Adaptation
Our foundation models are fine-tuned for users’ everyday activities, and can dynamically specialize themselves on-the-fly for the task at hand. We utilize adapters, small neural network modules that can be plugged into various layers of the pre-trained model, to fine-tune our models for specific tasks. For our models we adapt the attention matrices, the attention projection matrix, and the fully connected layers in the point-wise feedforward networks for a suitable set of the decoding layers of the transformer architecture.
By fine-tuning only the adapter layers, the original parameters of the base pre-trained model remain unchanged, preserving the general knowledge of the model while tailoring the adapter layers to support specific tasks.
We represent the values of the adapter parameters using 16 bits, and for the ~3 billion parameter on-device model, the parameters for a rank 16 adapter typically require 10s of megabytes. The adapter models can be dynamically loaded, temporarily cached in memory, and swapped — giving our foundation model the ability to specialize itself on the fly for the task at hand while efficiently managing memory and guaranteeing the operating system's responsiveness.
To facilitate the training of the adapters, we created an efficient infrastructure that allows us to rapidly retrain, test, and deploy adapters when either the base model or the training data gets updated. The adapter parameters are initialized using the accuracy-recovery adapter introduced in the Optimization section.
Performance and Evaluation
Our focus is on delivering generative models that can enable users to communicate, work, express themselves, and get things done across their Apple products. When benchmarking our models, we focus on human evaluation as we find that these results are highly correlated to user experience in our products. We conducted performance evaluations on both feature-specific adapters and the foundation models.
To illustrate our approach, we look at how we evaluated our adapter for summarization. As product requirements for summaries of emails and notifications differ in subtle but important ways, we fine-tune accuracy-recovery low-rank (LoRA) adapters on top of the palletized model to meet these specific requirements. Our training data is based on synthetic summaries generated from bigger server models, filtered by a rejection sampling strategy that keeps only the high quality summaries.
To evaluate the product-specific summarization, we use a set of 750 responses carefully sampled for each use case. These evaluation datasets emphasize a diverse set of inputs that our product features are likely to face in production, and include a stratified mixture of single and stacked documents of varying content types and lengths. As product features, it was important to evaluate performance against datasets that are representative of real use cases. We find that our models with adapters generate better summaries than a comparable model.
As part of responsible development, we identified and evaluated specific risks inherent to summarization. For example, summaries occasionally remove important nuance or other details in ways that are undesirable. However, we found that the summarization adapter did not amplify sensitive content in over 99% of targeted adversarial examples. We continue to adversarially probe to identify unknown harms and expand our evaluations to help guide further improvements.
In addition to evaluating feature specific performance powered by foundation models and adapters, we evaluate both the on-device and server-based models’ general capabilities. We utilize a comprehensive evaluation set of real-world prompts to test the general model capabilities. These prompts are diverse across different difficulty levels and cover major categories such as brainstorming, classification, closed question answering, coding, extraction, mathematical reasoning, open question answering, rewriting, safety, summarization, and writing.
We compare our models with both open-source models (Phi-3, Gemma, Mistral, DBRX) and commercial models of comparable size (GPT-3.5-Turbo, GPT-4-Turbo) 1 . We find that our models are preferred by human graders over most comparable competitor models. On this benchmark, our on-device model, with ~3B parameters, outperforms larger models including Phi-3-mini, Mistral-7B, and Gemma-7B. Our server model compares favorably to DBRX-Instruct, Mixtral-8x22B, and GPT-3.5-Turbo while being highly efficient.
We use a set of diverse adversarial prompts to test the model performance on harmful content, sensitive topics, and factuality. We measure the violation rates of each model as evaluated by human graders on this evaluation set, with a lower number being desirable. Both the on-device and server models are robust when faced with adversarial prompts, achieving violation rates lower than open-source and commercial models.
Our models are preferred by human graders as safe and helpful over competitor models for these prompts. However, considering the broad capabilities of large language models, we understand the limitation of our safety benchmark. We are actively conducting both manual and automatic red-teaming with internal and external teams to continue evaluating our models' safety.
To further evaluate our models, we use the Instruction-Following Eval (IFEval) benchmark to compare their instruction-following capabilities with models of comparable size. The results suggest that both our on-device and server model follow detailed instructions better than the open-source and commercial models of comparable size.
We evaluate our models’ writing ability on our internal summarization and composition benchmarks, consisting of a variety of writing instructions. These results do not refer to our feature-specific adapter for summarization (seen in Figure 3 ), nor do we have an adapter focused on composition.
The Apple foundation models and adapters introduced at WWDC24 underlie Apple Intelligence, the new personal intelligence system that is integrated deeply into iPhone, iPad, and Mac, and enables powerful capabilities across language, images, actions, and personal context. Our models have been created with the purpose of helping users do everyday activities across their Apple products, and developed responsibly at every stage and guided by Apple’s core values. We look forward to sharing more information soon on our broader family of generative models, including language, diffusion, and coding models.
[1] We compared against the following model versions: gpt-3.5-turbo-0125, gpt-4-0125-preview, Phi-3-mini-4k-instruct, Mistral-7B-Instruct-v0.2, Mixtral-8x22B-Instruct-v0.1, Gemma-1.1-2B, and Gemma-1.1-7B. The open-source and Apple models are evaluated in bfloat16 precision.
Related readings and updates.
Advancing speech accessibility with personal voice.
A voice replicator is a powerful tool for people at risk of losing their ability to speak, including those with a recent diagnosis of amyotrophic lateral sclerosis (ALS) or other conditions that can progressively impact speaking ability. First introduced in May 2023 and made available on iOS 17 in September 2023, Personal Voice is a tool that creates a synthesized voice for such users to speak in FaceTime, phone calls, assistive communication apps, and in-person conversations.
Apple Natural Language Understanding Workshop 2023
Earlier this year, Apple hosted the Natural Language Understanding workshop. This two-day hybrid event brought together Apple and members of the academic research community for talks and discussions on the state of the art in natural language understanding.
In this post, we share highlights from workshop discussions and recordings of select workshop talks.

Discover opportunities in Machine Learning.
Our research in machine learning breaks new ground every day.
Work with us
Help | Advanced Search
Computer Science > Computation and Language
Title: gpt-4 technical report.
Abstract: We report the development of GPT-4, a large-scale, multimodal model which can accept image and text inputs and produce text outputs. While less capable than humans in many real-world scenarios, GPT-4 exhibits human-level performance on various professional and academic benchmarks, including passing a simulated bar exam with a score around the top 10% of test takers. GPT-4 is a Transformer-based model pre-trained to predict the next token in a document. The post-training alignment process results in improved performance on measures of factuality and adherence to desired behavior. A core component of this project was developing infrastructure and optimization methods that behave predictably across a wide range of scales. This allowed us to accurately predict some aspects of GPT-4's performance based on models trained with no more than 1/1,000th the compute of GPT-4.
| Comments: | 100 pages; updated authors list; fixed author names and added citation |
| Subjects: | Computation and Language (cs.CL); Artificial Intelligence (cs.AI) |
| Cite as: | [cs.CL] |
| (or [cs.CL] for this version) | |
| Focus to learn more arXiv-issued DOI via DataCite |
Submission history
Access paper:.
- HTML (experimental)
- Other Formats
References & Citations
- Google Scholar
- Semantic Scholar
9 blog links
Bibtex formatted citation.
Bibliographic and Citation Tools
Code, data and media associated with this article, recommenders and search tools.
- Institution
arXivLabs: experimental projects with community collaborators
arXivLabs is a framework that allows collaborators to develop and share new arXiv features directly on our website.
Both individuals and organizations that work with arXivLabs have embraced and accepted our values of openness, community, excellence, and user data privacy. arXiv is committed to these values and only works with partners that adhere to them.
Have an idea for a project that will add value for arXiv's community? Learn more about arXivLabs .
Thank you for visiting nature.com. You are using a browser version with limited support for CSS. To obtain the best experience, we recommend you use a more up to date browser (or turn off compatibility mode in Internet Explorer). In the meantime, to ensure continued support, we are displaying the site without styles and JavaScript.
- View all journals
- Explore content
- About the journal
- Publish with us
- Sign up for alerts
- Published: 11 June 2024
The Space Omics and Medical Atlas (SOMA) and international astronaut biobank
- Eliah G. Overbey ORCID: orcid.org/0000-0002-2866-8294 1 , 2 , 3 , 4 ,
- JangKeun Kim ORCID: orcid.org/0000-0002-8733-9925 1 , 2 ,
- Braden T. Tierney ORCID: orcid.org/0000-0002-7533-8802 1 , 2 ,
- Jiwoon Park ORCID: orcid.org/0000-0003-0045-1429 1 , 2 ,
- Nadia Houerbi 1 , 2 ,
- Alexander G. Lucaci 1 , 2 ,
- Sebastian Garcia Medina 1 , 2 ,
- Namita Damle 1 ,
- Deena Najjar ORCID: orcid.org/0009-0009-7950-2866 5 ,
- Kirill Grigorev 1 , 2 ,
- Evan E. Afshin 1 , 2 ,
- Krista A. Ryon 1 ,
- Karolina Sienkiewicz 2 , 6 ,
- Laura Patras 7 , 8 ,
- Remi Klotz ORCID: orcid.org/0000-0003-2100-0635 9 ,
- Veronica Ortiz 9 ,
- Matthew MacKay 6 ,
- Annalise Schweickart ORCID: orcid.org/0000-0001-9691-3741 2 , 6 ,
- Christopher R. Chin ORCID: orcid.org/0000-0002-2140-3197 1 ,
- Maria A. Sierra 6 ,
- Matias F. Valenzuela 10 ,
- Ezequiel Dantas ORCID: orcid.org/0000-0003-4934-4632 11 , 12 ,
- Theodore M. Nelson ORCID: orcid.org/0000-0002-8600-0444 13 ,
- Egle Cekanaviciute ORCID: orcid.org/0000-0003-3306-1806 14 ,
- Gabriel Deards 6 ,
- Jonathan Foox 1 , 2 ,
- S. Anand Narayanan 15 ,
- Caleb M. Schmidt 16 , 17 , 18 ,
- Michael A. Schmidt 16 , 17 ,
- Julian C. Schmidt 16 , 17 ,
- Sean Mullane 19 ,
- Seth Stravers Tigchelaar 19 ,
- Steven Levitte 19 , 20 ,
- Craig Westover 1 ,
- Chandrima Bhattacharya 6 ,
- Serena Lucotti 7 ,
- Jeremy Wain Hirschberg 1 ,
- Jacqueline Proszynski 1 ,
- Marissa Burke ORCID: orcid.org/0000-0001-5647-3358 1 ,
- Ashley Kleinman 1 ,
- Daniel J. Butler 1 ,
- Conor Loy 21 ,
- Omary Mzava 21 ,
- Joan Lenz 21 ,
- Doru Paul 22 ,
- Christopher Mozsary 1 ,
- Lauren M. Sanders 14 ,
- Lynn E. Taylor 23 ,
- Chintan O. Patel 24 ,
- Sharib A. Khan 24 ,
- Mir Suhail 24 ,
- Syed G. Byhaqui 24 ,
- Burhan Aslam 24 ,
- Aaron S. Gajadhar 25 ,
- Lucy Williamson 25 ,
- Purvi Tandel 25 ,
- Qiu Yang 25 ,
- Jessica Chu 25 ,
- Ryan W. Benz 25 ,
- Asim Siddiqui 25 ,
- Daniel Hornburg ORCID: orcid.org/0000-0002-6618-7774 25 ,
- Kelly Blease 26 ,
- Juan Moreno 26 ,
- Andrew Boddicker ORCID: orcid.org/0000-0001-7957-8283 26 ,
- Junhua Zhao ORCID: orcid.org/0009-0006-7672-1084 26 ,
- Bryan Lajoie 26 ,
- Ryan T. Scott ORCID: orcid.org/0000-0003-0654-5661 27 ,
- Rachel R. Gilbert 27 ,
- San-huei Lai Polo 27 ,
- Andrew Altomare 26 ,
- Semyon Kruglyak 26 ,
- Shawn Levy 26 ,
- Ishara Ariyapala 28 ,
- Joanne Beer ORCID: orcid.org/0000-0001-8583-8467 28 ,
- Bingqing Zhang 28 ,
- Briana M. Hudson 29 ,
- Aric Rininger 29 ,
- Sarah E. Church ORCID: orcid.org/0000-0002-7194-4282 29 ,
- Afshin Beheshti ORCID: orcid.org/0000-0003-4643-531X 30 , 31 ,
- George M. Church ORCID: orcid.org/0000-0001-6232-9969 32 ,
- Scott M. Smith ORCID: orcid.org/0000-0001-9313-7900 33 ,
- Brian E. Crucian 33 ,
- Sara R. Zwart ORCID: orcid.org/0000-0001-8694-0180 34 ,
- Irina Matei ORCID: orcid.org/0000-0002-5712-8430 7 , 12 ,
- David C. Lyden ORCID: orcid.org/0000-0003-0193-4131 7 , 12 ,
- Francine Garrett-Bakelman 35 , 36 ,
- Jan Krumsiek ORCID: orcid.org/0000-0003-4734-3791 1 , 2 , 6 ,
- Qiuying Chen 37 ,
- Dawson Miller 37 ,
- Joe Shuga 38 ,
- Stephen Williams 38 ,
- Corey Nemec ORCID: orcid.org/0000-0002-6566-1753 38 ,
- Guy Trudel ORCID: orcid.org/0000-0001-5254-4294 39 , 40 , 41 ,
- Martin Pelchat 42 ,
- Odette Laneuville ORCID: orcid.org/0000-0003-3124-3892 43 ,
- Iwijn De Vlaminck ORCID: orcid.org/0000-0001-6085-7311 21 ,
- Steven Gross 37 ,
- Kelly L. Bolton 44 ,
- Susan M. Bailey ORCID: orcid.org/0000-0001-5595-9364 23 , 45 ,
- Richard Granstein 46 ,
- David Furman ORCID: orcid.org/0000-0002-3654-9519 10 , 47 , 48 , 49 ,
- Ari M. Melnick ORCID: orcid.org/0000-0002-8074-2287 12 , 22 ,
- Sylvain V. Costes ORCID: orcid.org/0000-0002-8542-2389 14 ,
- Bader Shirah ORCID: orcid.org/0000-0001-6493-2155 50 ,
- Anil S. Menon ORCID: orcid.org/0000-0002-6886-3553 34 ,
- Jaime Mateus 19 ,
- Cem Meydan ORCID: orcid.org/0000-0002-0663-6216 1 , 2 , 22 &
- Christopher E. Mason ORCID: orcid.org/0000-0002-1850-1642 1 , 2 , 3 , 51 , 52
Nature ( 2024 ) Cite this article
9043 Accesses
3 Citations
245 Altmetric
Metrics details
We are providing an unedited version of this manuscript to give early access to its findings. Before final publication, the manuscript will undergo further editing. Please note there may be errors present which affect the content, and all legal disclaimers apply.
- Medical research
- Molecular biology
Spaceflight induces molecular, cellular, and physiological shifts in astronauts and poses myriad biomedical challenges to the human body, which are becoming increasingly relevant as more humans venture into space 1-6 . Yet, current frameworks for aerospace medicine are nascent and lag far behind advancements in precision medicine on Earth, underscoring the need for rapid development of space medicine databases, tools, and protocols. Here, we present the Space Omics and Medical Atlas (SOMA), an integrated data and sample repository for clinical, cellular, and multi-omic research profiles from a diverse range of missions, including the NASA Twins Study 7 , JAXA CFE study 8,9 , SpaceX Inspiration4 crew 10-12 , plus Axiom and Polaris. The SOMA resource represents a >10-fold increase in publicly available human space omics data, with matched samples available from the Cornell Aerospace Medicine Biobank. The Atlas includes extensive molecular and physiological profiles encompassing genomics, epigenomics, transcriptomics, proteomics, metabolomics, and microbiome data sets, which reveal some consistent features across missions, including cytokine shifts, telomere elongation, and gene expression changes, as well as mission-specific molecular responses and links to orthologous, tissue-specific murine data sets. Leveraging the datasets, tools, and resources in SOMA can help accelerate precision aerospace medicine, bringing needed health monitoring, risk mitigation, and countermeasures data for upcoming lunar, Mars, and exploration-class missions.
You have full access to this article via your institution.
A Second Space Age Spanning Omics, Platforms, and Medicine Across Orbits

Single-cell multi-ome and immune profiles of the Inspiration4 crew reveal conserved, cell-type, and sex-specific responses to spaceflight

Collection of biospecimens from the inspiration4 mission establishes the standards for the space omics and medical atlas (SOMA)
Author information, authors and affiliations.
Department of Physiology and Biophysics, Weill Cornell Medicine, New York, NY, USA
Eliah G. Overbey, JangKeun Kim, Braden T. Tierney, Jiwoon Park, Nadia Houerbi, Alexander G. Lucaci, Sebastian Garcia Medina, Namita Damle, Kirill Grigorev, Evan E. Afshin, Krista A. Ryon, Christopher R. Chin, Jonathan Foox, Craig Westover, Jeremy Wain Hirschberg, Jacqueline Proszynski, Marissa Burke, Ashley Kleinman, Daniel J. Butler, Christopher Mozsary, Jan Krumsiek, Cem Meydan & Christopher E. Mason
The HRH Prince Alwaleed Bin Talal Bin Abdulaziz Alsaud Institute for Computational Biomedicine, Weill Cornell Medicine, New York, NY, USA
Eliah G. Overbey, JangKeun Kim, Braden T. Tierney, Jiwoon Park, Nadia Houerbi, Alexander G. Lucaci, Sebastian Garcia Medina, Kirill Grigorev, Evan E. Afshin, Karolina Sienkiewicz, Annalise Schweickart, Jonathan Foox, Jan Krumsiek, Cem Meydan & Christopher E. Mason
BioAstra, Inc, New York, NY, USA
Eliah G. Overbey & Christopher E. Mason
Center for STEM, University of Austin, Austin, TX, USA
Eliah G. Overbey
Albert Einstein College of Medicine, Bronx, NY, USA
Deena Najjar
Tri-Institutional Biology and Medicine program, Weill Cornell Medicine, New York, NY, USA
Karolina Sienkiewicz, Matthew MacKay, Annalise Schweickart, Maria A. Sierra, Gabriel Deards, Chandrima Bhattacharya & Jan Krumsiek
Children’s Cancer and Blood Foundation Laboratories, Departments of Pediatrics and Cell and Developmental Biology, Drukier Institute for Children’s Health, Weill Cornell Medicine, New York, NY, USA
Laura Patras, Serena Lucotti, Irina Matei & David C. Lyden
Department of Molecular Biology and Biotechnology, Center of Systems Biology, Biodiversity and Bioresources, Faculty of Biology and Geology, Babes-Bolyai University, Cluj-Napoca, Romania
Laura Patras
Department of Stem Cell Biology and Regenerative Medicine, Keck School of Medicine, University of Southern California, Los Angeles, CA, USA
Remi Klotz, Veronica Ortiz & Min Yu
Buck Institute for Research on Aging, Novato, CA, USA
Matias F. Valenzuela & David Furman
Division of Endocrinology, Department of Medicine, Weill Cornell Medicine, New York, NY, USA
Ezequiel Dantas
Meyer Cancer Center, Weill Cornell Medicine, New York, NY, USA
Ezequiel Dantas, Irina Matei, David C. Lyden & Ari M. Melnick
Department of Microbiology & Immunology, Vagelos College of Physicians & Surgeons, Columbia University Irving Medical Center, New York, NY, USA
Theodore M. Nelson
Space Biosciences Division, NASA Ames Research Center, Moffett Field, CA, USA
Egle Cekanaviciute, Lauren M. Sanders & Sylvain V. Costes
Department of Health, Nutrition, and Food Sciences, Florida State University, Tallahassee, FL, USA
S. Anand Narayanan
Sovaris Aerospace, Boulder, Colorado, USA
Caleb M. Schmidt, Michael A. Schmidt & Julian C. Schmidt
Advanced Pattern Analysis and Human Performance Group, Boulder, Colorado, USA
Department of Systems Engineering, Colorado State University, Fort Collins, Colorado, USA
Caleb M. Schmidt
Space Exploration Technologies Corporation (SpaceX), Hawthorne, CA, USA
Sean Mullane, Seth Stravers Tigchelaar, Steven Levitte & Jaime Mateus
Division of Pediatric Gastroenterology, Stanford University, Palo Alto, CA, USA
Steven Levitte
Nancy E. and Peter C. Meinig School of Biomedical Engineering, Cornell University, Ithaca, New York, USA
Conor Loy, Omary Mzava, Joan Lenz & Iwijn De Vlaminck
Division of Hematology/Oncology, Department of Medicine, Weill Cornell Medicine, New York, NY, USA
Doru Paul, Ari M. Melnick & Cem Meydan
Department of Environmental and Radiological Health Sciences, Colorado State University, Fort Collins, CO, USA
Lynn E. Taylor & Susan M. Bailey
TrialX Inc., New York, NY, USA
Chintan O. Patel, Sharib A. Khan, Mir Suhail, Syed G. Byhaqui & Burhan Aslam
Seer, Inc., Redwood City, CA, USA
Aaron S. Gajadhar, Lucy Williamson, Purvi Tandel, Qiu Yang, Jessica Chu, Ryan W. Benz, Asim Siddiqui & Daniel Hornburg
Element Biosciences, San Diego, CA, USA
Kelly Blease, Juan Moreno, Andrew Boddicker, Junhua Zhao, Bryan Lajoie, Andrew Altomare, Semyon Kruglyak & Shawn Levy
KBR; Space Biosciences Division, NASA Ames Research Center, Moffett Field, CA, USA
Ryan T. Scott, Rachel R. Gilbert & San-huei Lai Polo
Alamar Biosciences, Inc, 47071 Bayside Parkway, Fremont, CA, USA
Ishara Ariyapala, Joanne Beer & Bingqing Zhang
NanoString Technologies, Seattle, WA, USA
Briana M. Hudson, Aric Rininger & Sarah E. Church
Blue Marble Space Institute of Science; Space Biosciences Division, NASA Ames Research Center, Moffett Field, CA, USA
- Afshin Beheshti
Stanley Center for Psychiatric Research, Broad Institute of MIT and Harvard, Cambridge, MA, USA
Harvard Medical School and the Wyss Institute, Boston, MA, USA
George M. Church
National Aeronautics and Space Administration, Johnson Space Center, Human Health and Performance Directorate, Biomedical Research and Environmental Sciences Division, Houston, TX, USA
Scott M. Smith & Brian E. Crucian
University of Texas Medical Branch, Galveston, TX, USA
Sara R. Zwart & Anil S. Menon
Department of Biochemistry and Molecular Genetics, University of Virginia, Charlottesville, VA, USA
Francine Garrett-Bakelman
Department of Medicine, Division of Hematology & Oncology, University of Virginia, Charlottesville, VA, USA
Department of Pharmacology, Weill Cornell Medicine, New York, NY, USA
Qiuying Chen, Dawson Miller & Steven Gross
10x Genomics, Pleasanton, CA, USA
Joe Shuga, Stephen Williams & Corey Nemec
Bone and Joint Research Laboratory, Ottawa Hospital Research Institute, 501 Smyth Road, Ottawa, Ontario, Canada
Department of Medicine, Division of Physiatry, The Ottawa Hospital, Room 2505G, 505 Smyth Road, Ottawa, Ontario, Canada
Department of Cellular and Molecular Medicine, Faculty of Medicine, University of Ottawa, 451 Smyth Road, Room 1321, Ottawa, Ontario, Canada
Department of Biochemistry, Microbiology, and Immunology, Roger Guindon Hall, Room 4111A, University of Ottawa, Ottawa, Canada
Martin Pelchat
Department of Biology, Gendron Hall Room 3-372, University of Ottawa, Ottawa, Canada
Odette Laneuville
Division of Oncology, Department of Medicine, Washington University School of Medicine, St Louis, MO, USA
Kelly L. Bolton
Cell and Molecular Biology Program, Colorado State University, Fort Collins, CO, USA
Susan M. Bailey
Department of Dermatology, Weill Cornell Medicine, New York, NY, USA
Richard Granstein
Cosmica Biosciences Inc., San Francisco, CA, USA
David Furman
Stanford 1000 Immunomes Project, Stanford School of Medicine, Stanford University, Stanford, CA, USA
Institute for Research in Translational Medicine, Universidad Austral, CONICET, Pilar, Buenos Aires, Argentina
Department of Neuroscience, King Faisal Specialist Hospital & Research Centre, Jeddah, Saudi Arabia
Bader Shirah
The Feil Family Brain and Mind Research Institute, Weill Cornell Medicine, NY, USA
Christopher E. Mason
WorldQuant Initiative for Quantitative Prediction, Weill Cornell Medicine, New York, NY, USA
You can also search for this author in PubMed Google Scholar
Corresponding authors
Correspondence to Eliah G. Overbey , Cem Meydan or Christopher E. Mason .
Supplementary information
Supplementary information.
This file contains Supplementary Figures 1-3, Supplementary Tables 4 and 9, Supplementary Note 1 and additional references.
Reporting Summary
Supplementary table 1.
Sample Information. Comprehensive list of samples collected from each crew member, at each timepoint, for each assay. Tab 1 is an overview of which samples are present at each timepoint. Tab 2 is an itemized list of each sample, including the number of sequenced DNA/RNA molecules for sequencing assays.
Supplementary Table 2
OSDR Studies. Comprehensive list of prior studies in OSDR for previous assays on human, metagenomic, and metatranscriptomic samples.
Supplementary Table 3
Sequencing and Mass Spectrometry Stats Tables. Sequencing and mass spectrometry statistics for multiome, TCR, BCR, cfRNA, dRNA, and proteomics assays.
Supplementary Table 5
cfRNA Calculations. Tissue of origin analysis from cfRNA sequencing. Tab 1 contains fractions of cell type specific RNA enrichment. Tab 2 contains comparisons between timepoints.
Supplementary Table 6
Recovery Profile Pathways. Overrepresented KEGG pathways during recovery from spaceflight in PBMCs. Tabs are split for CD4+ T cells, CD8+ T cells, CD14+ monocyte and CD16+ monocytes.
Supplementary Table 7
Metagenome and Metatranscriptome CVs. Species-level CV calculations across crew members for metagenomic and metatranscriptomic samples from oral, nasal, and skin swab samples.
Supplementary Table 8
Human Omics CVs. Gene/analyte-level CV calculations across crew members for NULISAseq, EVP proteomic, plasma proteomic, metabolomic, dRNA-seq and short read RNA-seq assays. GSEA pathway enrichment is calculated for pre-flight, post-flight (R+1), and recovery time intervals.
Peer Review File
Rights and permissions.
Reprints and permissions
About this article
Cite this article.
Overbey, E.G., Kim, J., Tierney, B.T. et al. The Space Omics and Medical Atlas (SOMA) and international astronaut biobank. Nature (2024). https://doi.org/10.1038/s41586-024-07639-y
Download citation
Received : 30 December 2022
Accepted : 31 May 2024
Published : 11 June 2024
DOI : https://doi.org/10.1038/s41586-024-07639-y
Share this article
Anyone you share the following link with will be able to read this content:
Sorry, a shareable link is not currently available for this article.
Provided by the Springer Nature SharedIt content-sharing initiative
This article is cited by
How a few days in space can disrupt a person’s biology.
- Heidi Ledford
Nature (2024)
Aging and putative frailty biomarkers are altered by spaceflight
- Andrea Camera
- Marshall Tabetah
Scientific Reports (2024)
Transcriptomics analysis reveals molecular alterations underpinning spaceflight dermatology
- Jonas Elsborg
Communications Medicine (2024)
By submitting a comment you agree to abide by our Terms and Community Guidelines . If you find something abusive or that does not comply with our terms or guidelines please flag it as inappropriate.
Quick links
- Explore articles by subject
- Guide to authors
- Editorial policies
Sign up for the Nature Briefing newsletter — what matters in science, free to your inbox daily.

An official website of the United States government
Here's how you know
Official websites use .gov A .gov website belongs to an official government organization in the United States.
Secure .gov websites use HTTPS A lock ( ) or https:// means you've safely connected to the .gov website. Share sensitive information only on official, secure websites.
CMS Newsroom
Search cms.gov.
- Physician Fee Schedule
- Local Coverage Determination
- Medically Unlikely Edits
Medicare HETS2024-2 System Release Will Be Installed 6/29/2024 - Updated Timing
- HETS2024-2 HETS 270/271 Release Summary
- HETS2024-2 HETS 270/271 Companion Guide v10-36
IMAGES
VIDEO
COMMENTS
Reporting Research Results in APA Style | Tips & Examples. Published on December 21, 2020 by Pritha Bhandari.Revised on January 17, 2024. The results section of a quantitative research paper is where you summarize your data and report the findings of any relevant statistical analyses.. The APA manual provides rigorous guidelines for what to report in quantitative research papers in the fields ...
Here are a few best practices: Your results should always be written in the past tense. While the length of this section depends on how much data you collected and analyzed, it should be written as concisely as possible. Only include results that are directly relevant to answering your research questions.
Following this overall summary, the relevant data in the tables is broken down into greater detail in text form in the Results section. "Results on the bio-accumulation of cadmium were found to be the highest (17.5 mg kgG1) in the bulb, when the concentration of cadmium in the solution was 1×10G2 M and lowest (0.11 mg kgG1) in the leaves when the concentration was 1×10G3 M."
Research results refer to the findings and conclusions derived from a systematic investigation or study conducted to answer a specific question or hypothesis. These results are typically presented in a written report or paper and can include various forms of data such as numerical data, qualitative data, statistics, charts, graphs, and visual aids.
Be concise. Use non-textual elements appropriately, such as figures and tables, to present findings more effectively. In deciding what data to describe in your results section, you must clearly distinguish information that would normally be included in a research paper from any raw data or other content that could be included as an appendix.
The Results (also sometimes called Findings) section in an empirical research paper describes what the researcher(s) found when they analyzed their data. Its primary purpose is to use the data collected to answer the research question(s) posed in the introduction, even if the findings challenge the hypothesis.
The results section of a research paper tells the reader what you found, while the discussion section tells the reader what your findings mean. The results section should present the facts in an academic and unbiased manner, avoiding any attempt at analyzing or interpreting the data. Think of the results section as setting the stage for the ...
The initial or raw data should not be mentioned in the results section of a research paper. The results section of a research paper is usually the most impactful section because it draws the greatest attention. Regardless of the subject of your research paper, a well-written results section is capable of generating interest in your research.
A key element of writing a research paper is to clearly and objectively report the study's findings in the Results section. The Results section is where the authors inform the readers about the findings from the statistical analysis of the data collected to operationalize the study hypothesis, optimally adding novel information to the ...
This is the core of the paper. Don't start the results sections with methods you left out of the Materials and Methods section. You need to give an overall description of the experiments and present the data you found. Goals: Factual statements supported by evidence. Short and sweet without excess words
While writing the 'Results' section, significant data which should be recalled by the readers must be indicated in the main text. ... graphics, and flow diagram in the 'Results' section of a research paper written by the authors of this review article, and published in the World Journal of Urology in the year 2010 (World J Urol 2010;28: ...
The findings section of a research paper presents the results and outcomes of the study or investigation. It is a crucial part of the research paper where researchers interpret and analyze the data collected and draw conclusions based on their findings. This section aims to answer the research questions or hypotheses formulated earlier in the ...
The results section of the research paper is where you report the findings of your study based upon the information gathered as a result of the methodology [or methodologies] you applied. The results section should simply state the findings, without bias or interpretation, and arranged in a logical sequence. The results section should always be ...
Sometimes your Data and Model section will contain plots or tables, and sometimes it won't. If you feel that a plot helps the reader understand the problem or data set itself—as opposed to your results—then go ahead and include it. A great example here is Tables 1 and 2 in the main paper on the PREDIMED study. These tables help the reader ...
The methods section of a research paper describes the research design, the sample selection, the data collection and analysis procedures, and the statistical methods used to analyze the data. ... Research papers are often used as teaching tools in universities and colleges to educate students about research methods, data analysis, and academic ...
A research question is what a study aims to answer after data analysis and interpretation. The answer is written in length in the discussion section of the paper. Thus, the research question gives a preview of the different parts and variables of the study meant to address the problem posed in the research question.1 An excellent research ...
Results section of research paper contains outcomes about experiments. In the results section, you should narrate research findings without interpretation. ... but never put a graph and a table with the same data in your paper. In the case of graphs, the captions should come below, called Fig. 1, Fig. 2 and so on. ...
An annotated Method section and other empirical research paper resources are available here. What is the purpose of the Method section in an empirical research paper? The Method section (also sometimes called Methods, Materials and Methods, or Research Design and Methods) describes the data collection and analysis procedures for a research project.
Data Analysis Summary The methods section of a research paper provides the information by which a study's validity is judged. Therefore, it requires a clear and precise description of how an experiment was done, and the rationale for why specific experimental procedures were chosen. The methods section should describe what was
The discussion section provides an analysis and interpretation of the findings, compares them with previous studies, identifies limitations, and suggests future directions for research. This section combines information from the preceding parts of your paper into a coherent story. By this point, the reader already knows why you did your study ...
Data Collection | Definition, Methods & Examples. Published on June 5, 2020 by Pritha Bhandari.Revised on June 21, 2023. Data collection is a systematic process of gathering observations or measurements. Whether you are performing research for business, governmental or academic purposes, data collection allows you to gain first-hand knowledge and original insights into your research problem.
The methods section of a research paper typically constitutes materials and methods; while writing this section, authors usually arrange the information under each category. The materials category describes the samples, materials, treatments, and instruments, while experimental design, sample preparation, data collection, and data analysis are ...
Follow these simple tips to compose a strong piece of writing: Avoid analyzing your results in the data analysis section. Indicate whether your research is quantitative or qualitative. Provide your main research questions and the analysis methods that were applied to answer them. Report what software you used to gather and analyze your data.
This analysis examines how people of color fare compared to White people across 64 measures of health, health care, and social determinants of health using the most recent data available from ...
CRediT statements should be provided during the submission process and will appear above the acknowledgment section of the published paper as shown further below. Term. Definition. Conceptualization. Ideas; formulation or evolution of overarching research goals and aims ... scrub data and maintain research data (including software code, where ...
The rest of the paper is organized as follows; section 2 outlines the systematic review process. Section 3 presents the systematic protocol followed for the accumulation of the most relevant articles, assessment and systematic. Section 4 presents a summary of the results and findings of the review and discusses these accordingly.
Figure 1: Modeling overview for the Apple foundation models. Pre-Training. Our foundation models are trained on Apple's AXLearn framework, an open-source project we released in 2023.It builds on top of JAX and XLA, and allows us to train the models with high efficiency and scalability on various training hardware and cloud platforms, including TPUs and both cloud and on-premise GPUs.
We report the development of GPT-4, a large-scale, multimodal model which can accept image and text inputs and produce text outputs. While less capable than humans in many real-world scenarios, GPT-4 exhibits human-level performance on various professional and academic benchmarks, including passing a simulated bar exam with a score around the top 10% of test takers. GPT-4 is a Transformer ...
Here, we present the Space Omics and Medical Atlas (SOMA), an integrated data and sample repository for clinical, cellular, and multi-omic research profiles from a diverse range of missions ...
Medicare HETS 270/271 Submitters: CMS announces a change to the scheduled installation of the HETS2024-2 release. The HETS2024-2 release is now scheduled to be installed beginning at 1:00 PM ET on Saturday, June 29, 2024. The HETS 270/271 system will remain available during the installation. CMS estimates that the installation will be completed and verified by 5:00 PM ET on Saturday, June 29 ...