- Privacy Policy
Home » Data Collection – Methods Types and Examples

Data Collection – Methods Types and Examples
Table of Contents

Data Collection
Definition:
Data collection is the process of gathering and collecting information from various sources to analyze and make informed decisions based on the data collected. This can involve various methods, such as surveys, interviews, experiments, and observation.
In order for data collection to be effective, it is important to have a clear understanding of what data is needed and what the purpose of the data collection is. This can involve identifying the population or sample being studied, determining the variables to be measured, and selecting appropriate methods for collecting and recording data.
Types of Data Collection
Types of Data Collection are as follows:
Primary Data Collection
Primary data collection is the process of gathering original and firsthand information directly from the source or target population. This type of data collection involves collecting data that has not been previously gathered, recorded, or published. Primary data can be collected through various methods such as surveys, interviews, observations, experiments, and focus groups. The data collected is usually specific to the research question or objective and can provide valuable insights that cannot be obtained from secondary data sources. Primary data collection is often used in market research, social research, and scientific research.
Secondary Data Collection
Secondary data collection is the process of gathering information from existing sources that have already been collected and analyzed by someone else, rather than conducting new research to collect primary data. Secondary data can be collected from various sources, such as published reports, books, journals, newspapers, websites, government publications, and other documents.
Qualitative Data Collection
Qualitative data collection is used to gather non-numerical data such as opinions, experiences, perceptions, and feelings, through techniques such as interviews, focus groups, observations, and document analysis. It seeks to understand the deeper meaning and context of a phenomenon or situation and is often used in social sciences, psychology, and humanities. Qualitative data collection methods allow for a more in-depth and holistic exploration of research questions and can provide rich and nuanced insights into human behavior and experiences.
Quantitative Data Collection
Quantitative data collection is a used to gather numerical data that can be analyzed using statistical methods. This data is typically collected through surveys, experiments, and other structured data collection methods. Quantitative data collection seeks to quantify and measure variables, such as behaviors, attitudes, and opinions, in a systematic and objective way. This data is often used to test hypotheses, identify patterns, and establish correlations between variables. Quantitative data collection methods allow for precise measurement and generalization of findings to a larger population. It is commonly used in fields such as economics, psychology, and natural sciences.
Data Collection Methods
Data Collection Methods are as follows:
Surveys involve asking questions to a sample of individuals or organizations to collect data. Surveys can be conducted in person, over the phone, or online.
Interviews involve a one-on-one conversation between the interviewer and the respondent. Interviews can be structured or unstructured and can be conducted in person or over the phone.
Focus Groups
Focus groups are group discussions that are moderated by a facilitator. Focus groups are used to collect qualitative data on a specific topic.
Observation
Observation involves watching and recording the behavior of people, objects, or events in their natural setting. Observation can be done overtly or covertly, depending on the research question.
Experiments
Experiments involve manipulating one or more variables and observing the effect on another variable. Experiments are commonly used in scientific research.
Case Studies
Case studies involve in-depth analysis of a single individual, organization, or event. Case studies are used to gain detailed information about a specific phenomenon.
Secondary Data Analysis
Secondary data analysis involves using existing data that was collected for another purpose. Secondary data can come from various sources, such as government agencies, academic institutions, or private companies.
How to Collect Data
The following are some steps to consider when collecting data:
- Define the objective : Before you start collecting data, you need to define the objective of the study. This will help you determine what data you need to collect and how to collect it.
- Identify the data sources : Identify the sources of data that will help you achieve your objective. These sources can be primary sources, such as surveys, interviews, and observations, or secondary sources, such as books, articles, and databases.
- Determine the data collection method : Once you have identified the data sources, you need to determine the data collection method. This could be through online surveys, phone interviews, or face-to-face meetings.
- Develop a data collection plan : Develop a plan that outlines the steps you will take to collect the data. This plan should include the timeline, the tools and equipment needed, and the personnel involved.
- Test the data collection process: Before you start collecting data, test the data collection process to ensure that it is effective and efficient.
- Collect the data: Collect the data according to the plan you developed in step 4. Make sure you record the data accurately and consistently.
- Analyze the data: Once you have collected the data, analyze it to draw conclusions and make recommendations.
- Report the findings: Report the findings of your data analysis to the relevant stakeholders. This could be in the form of a report, a presentation, or a publication.
- Monitor and evaluate the data collection process: After the data collection process is complete, monitor and evaluate the process to identify areas for improvement in future data collection efforts.
- Ensure data quality: Ensure that the collected data is of high quality and free from errors. This can be achieved by validating the data for accuracy, completeness, and consistency.
- Maintain data security: Ensure that the collected data is secure and protected from unauthorized access or disclosure. This can be achieved by implementing data security protocols and using secure storage and transmission methods.
- Follow ethical considerations: Follow ethical considerations when collecting data, such as obtaining informed consent from participants, protecting their privacy and confidentiality, and ensuring that the research does not cause harm to participants.
- Use appropriate data analysis methods : Use appropriate data analysis methods based on the type of data collected and the research objectives. This could include statistical analysis, qualitative analysis, or a combination of both.
- Record and store data properly: Record and store the collected data properly, in a structured and organized format. This will make it easier to retrieve and use the data in future research or analysis.
- Collaborate with other stakeholders : Collaborate with other stakeholders, such as colleagues, experts, or community members, to ensure that the data collected is relevant and useful for the intended purpose.
Applications of Data Collection
Data collection methods are widely used in different fields, including social sciences, healthcare, business, education, and more. Here are some examples of how data collection methods are used in different fields:
- Social sciences : Social scientists often use surveys, questionnaires, and interviews to collect data from individuals or groups. They may also use observation to collect data on social behaviors and interactions. This data is often used to study topics such as human behavior, attitudes, and beliefs.
- Healthcare : Data collection methods are used in healthcare to monitor patient health and track treatment outcomes. Electronic health records and medical charts are commonly used to collect data on patients’ medical history, diagnoses, and treatments. Researchers may also use clinical trials and surveys to collect data on the effectiveness of different treatments.
- Business : Businesses use data collection methods to gather information on consumer behavior, market trends, and competitor activity. They may collect data through customer surveys, sales reports, and market research studies. This data is used to inform business decisions, develop marketing strategies, and improve products and services.
- Education : In education, data collection methods are used to assess student performance and measure the effectiveness of teaching methods. Standardized tests, quizzes, and exams are commonly used to collect data on student learning outcomes. Teachers may also use classroom observation and student feedback to gather data on teaching effectiveness.
- Agriculture : Farmers use data collection methods to monitor crop growth and health. Sensors and remote sensing technology can be used to collect data on soil moisture, temperature, and nutrient levels. This data is used to optimize crop yields and minimize waste.
- Environmental sciences : Environmental scientists use data collection methods to monitor air and water quality, track climate patterns, and measure the impact of human activity on the environment. They may use sensors, satellite imagery, and laboratory analysis to collect data on environmental factors.
- Transportation : Transportation companies use data collection methods to track vehicle performance, optimize routes, and improve safety. GPS systems, on-board sensors, and other tracking technologies are used to collect data on vehicle speed, fuel consumption, and driver behavior.
Examples of Data Collection
Examples of Data Collection are as follows:
- Traffic Monitoring: Cities collect real-time data on traffic patterns and congestion through sensors on roads and cameras at intersections. This information can be used to optimize traffic flow and improve safety.
- Social Media Monitoring : Companies can collect real-time data on social media platforms such as Twitter and Facebook to monitor their brand reputation, track customer sentiment, and respond to customer inquiries and complaints in real-time.
- Weather Monitoring: Weather agencies collect real-time data on temperature, humidity, air pressure, and precipitation through weather stations and satellites. This information is used to provide accurate weather forecasts and warnings.
- Stock Market Monitoring : Financial institutions collect real-time data on stock prices, trading volumes, and other market indicators to make informed investment decisions and respond to market fluctuations in real-time.
- Health Monitoring : Medical devices such as wearable fitness trackers and smartwatches can collect real-time data on a person’s heart rate, blood pressure, and other vital signs. This information can be used to monitor health conditions and detect early warning signs of health issues.
Purpose of Data Collection
The purpose of data collection can vary depending on the context and goals of the study, but generally, it serves to:
- Provide information: Data collection provides information about a particular phenomenon or behavior that can be used to better understand it.
- Measure progress : Data collection can be used to measure the effectiveness of interventions or programs designed to address a particular issue or problem.
- Support decision-making : Data collection provides decision-makers with evidence-based information that can be used to inform policies, strategies, and actions.
- Identify trends : Data collection can help identify trends and patterns over time that may indicate changes in behaviors or outcomes.
- Monitor and evaluate : Data collection can be used to monitor and evaluate the implementation and impact of policies, programs, and initiatives.
When to use Data Collection
Data collection is used when there is a need to gather information or data on a specific topic or phenomenon. It is typically used in research, evaluation, and monitoring and is important for making informed decisions and improving outcomes.
Data collection is particularly useful in the following scenarios:
- Research : When conducting research, data collection is used to gather information on variables of interest to answer research questions and test hypotheses.
- Evaluation : Data collection is used in program evaluation to assess the effectiveness of programs or interventions, and to identify areas for improvement.
- Monitoring : Data collection is used in monitoring to track progress towards achieving goals or targets, and to identify any areas that require attention.
- Decision-making: Data collection is used to provide decision-makers with information that can be used to inform policies, strategies, and actions.
- Quality improvement : Data collection is used in quality improvement efforts to identify areas where improvements can be made and to measure progress towards achieving goals.
Characteristics of Data Collection
Data collection can be characterized by several important characteristics that help to ensure the quality and accuracy of the data gathered. These characteristics include:
- Validity : Validity refers to the accuracy and relevance of the data collected in relation to the research question or objective.
- Reliability : Reliability refers to the consistency and stability of the data collection process, ensuring that the results obtained are consistent over time and across different contexts.
- Objectivity : Objectivity refers to the impartiality of the data collection process, ensuring that the data collected is not influenced by the biases or personal opinions of the data collector.
- Precision : Precision refers to the degree of accuracy and detail in the data collected, ensuring that the data is specific and accurate enough to answer the research question or objective.
- Timeliness : Timeliness refers to the efficiency and speed with which the data is collected, ensuring that the data is collected in a timely manner to meet the needs of the research or evaluation.
- Ethical considerations : Ethical considerations refer to the ethical principles that must be followed when collecting data, such as ensuring confidentiality and obtaining informed consent from participants.
Advantages of Data Collection
There are several advantages of data collection that make it an important process in research, evaluation, and monitoring. These advantages include:
- Better decision-making : Data collection provides decision-makers with evidence-based information that can be used to inform policies, strategies, and actions, leading to better decision-making.
- Improved understanding: Data collection helps to improve our understanding of a particular phenomenon or behavior by providing empirical evidence that can be analyzed and interpreted.
- Evaluation of interventions: Data collection is essential in evaluating the effectiveness of interventions or programs designed to address a particular issue or problem.
- Identifying trends and patterns: Data collection can help identify trends and patterns over time that may indicate changes in behaviors or outcomes.
- Increased accountability: Data collection increases accountability by providing evidence that can be used to monitor and evaluate the implementation and impact of policies, programs, and initiatives.
- Validation of theories: Data collection can be used to test hypotheses and validate theories, leading to a better understanding of the phenomenon being studied.
- Improved quality: Data collection is used in quality improvement efforts to identify areas where improvements can be made and to measure progress towards achieving goals.
Limitations of Data Collection
While data collection has several advantages, it also has some limitations that must be considered. These limitations include:
- Bias : Data collection can be influenced by the biases and personal opinions of the data collector, which can lead to inaccurate or misleading results.
- Sampling bias : Data collection may not be representative of the entire population, resulting in sampling bias and inaccurate results.
- Cost : Data collection can be expensive and time-consuming, particularly for large-scale studies.
- Limited scope: Data collection is limited to the variables being measured, which may not capture the entire picture or context of the phenomenon being studied.
- Ethical considerations : Data collection must follow ethical principles to protect the rights and confidentiality of the participants, which can limit the type of data that can be collected.
- Data quality issues: Data collection may result in data quality issues such as missing or incomplete data, measurement errors, and inconsistencies.
- Limited generalizability : Data collection may not be generalizable to other contexts or populations, limiting the generalizability of the findings.
About the author

Muhammad Hassan
Researcher, Academic Writer, Web developer
You may also like

Future Research – Thesis Guide

Research Methods – Types, Examples and Guide

Data Interpretation – Process, Methods and...

Institutional Review Board – Application Sample...

Informed Consent in Research – Types, Templates...

Ethical Considerations – Types, Examples and...
Data collection in research: Your complete guide
Last updated
31 January 2023
Reviewed by
Cathy Heath
In the late 16th century, Francis Bacon coined the phrase "knowledge is power," which implies that knowledge is a powerful force, like physical strength. In the 21st century, knowledge in the form of data is unquestionably powerful.
But data isn't something you just have - you need to collect it. This means utilizing a data collection process and turning the collected data into knowledge that you can leverage into a successful strategy for your business or organization.
Believe it or not, there's more to data collection than just conducting a Google search. In this complete guide, we shine a spotlight on data collection, outlining what it is, types of data collection methods, common challenges in data collection, data collection techniques, and the steps involved in data collection.
Analyze all your data in one place
Uncover hidden nuggets in all types of qualitative data when you analyze it in Dovetail
- What is data collection?
There are two specific data collection techniques: primary and secondary data collection. Primary data collection is the process of gathering data directly from sources. It's often considered the most reliable data collection method, as researchers can collect information directly from respondents.
Secondary data collection is data that has already been collected by someone else and is readily available. This data is usually less expensive and quicker to obtain than primary data.
- What are the different methods of data collection?
There are several data collection methods, which can be either manual or automated. Manual data collection involves collecting data manually, typically with pen and paper, while computerized data collection involves using software to collect data from online sources, such as social media, website data, transaction data, etc.
Here are the five most popular methods of data collection:
Surveys are a very popular method of data collection that organizations can use to gather information from many people. Researchers can conduct multi-mode surveys that reach respondents in different ways, including in person, by mail, over the phone, or online.
As a method of data collection, surveys have several advantages. For instance, they are relatively quick and easy to administer, you can be flexible in what you ask, and they can be tailored to collect data on various topics or from certain demographics.
However, surveys also have several disadvantages. For instance, they can be expensive to administer, and the results may not represent the population as a whole. Additionally, survey data can be challenging to interpret. It may also be subject to bias if the questions are not well-designed or if the sample of people surveyed is not representative of the population of interest.
Interviews are a common method of collecting data in social science research. You can conduct interviews in person, over the phone, or even via email or online chat.
Interviews are a great way to collect qualitative and quantitative data . Qualitative interviews are likely your best option if you need to collect detailed information about your subjects' experiences or opinions. If you need to collect more generalized data about your subjects' demographics or attitudes, then quantitative interviews may be a better option.
Interviews are relatively quick and very flexible, allowing you to ask follow-up questions and explore topics in more depth. The downside is that interviews can be time-consuming and expensive due to the amount of information to be analyzed. They are also prone to bias, as both the interviewer and the respondent may have certain expectations or preconceptions that may influence the data.
Direct observation
Observation is a direct way of collecting data. It can be structured (with a specific protocol to follow) or unstructured (simply observing without a particular plan).
Organizations and businesses use observation as a data collection method to gather information about their target market, customers, or competition. Businesses can learn about consumer behavior, preferences, and trends by observing people using their products or service.
There are two types of observation: participatory and non-participatory. In participatory observation, the researcher is actively involved in the observed activities. This type of observation is used in ethnographic research , where the researcher wants to understand a group's culture and social norms. Non-participatory observation is when researchers observe from a distance and do not interact with the people or environment they are studying.
There are several advantages to using observation as a data collection method. It can provide insights that may not be apparent through other methods, such as surveys or interviews. Researchers can also observe behavior in a natural setting, which can provide a more accurate picture of what people do and how and why they behave in a certain context.
There are some disadvantages to using observation as a method of data collection. It can be time-consuming, intrusive, and expensive to observe people for extended periods. Observations can also be tainted if the researcher is not careful to avoid personal biases or preconceptions.
Automated data collection
Business applications and websites are increasingly collecting data electronically to improve the user experience or for marketing purposes.
There are a few different ways that organizations can collect data automatically. One way is through cookies, which are small pieces of data stored on a user's computer. They track a user's browsing history and activity on a site, measuring levels of engagement with a business’s products or services, for example.
Another way organizations can collect data automatically is through web beacons. Web beacons are small images embedded on a web page to track a user's activity.
Finally, organizations can also collect data through mobile apps, which can track user location, device information, and app usage. This data can be used to improve the user experience and for marketing purposes.
Automated data collection is a valuable tool for businesses, helping improve the user experience or target marketing efforts. Businesses should aim to be transparent about how they collect and use this data.
Sourcing data through information service providers
Organizations need to be able to collect data from a variety of sources, including social media, weblogs, and sensors. The process to do this and then use the data for action needs to be efficient, targeted, and meaningful.
In the era of big data, organizations are increasingly turning to information service providers (ISPs) and other external data sources to help them collect data to make crucial decisions.
Information service providers help organizations collect data by offering personalized services that suit the specific needs of the organizations. These services can include data collection, analysis, management, and reporting. By partnering with an ISP, organizations can gain access to the newest technology and tools to help them to gather and manage data more effectively.
There are also several tools and techniques that organizations can use to collect data from external sources, such as web scraping, which collects data from websites, and data mining, which involves using algorithms to extract data from large data sets.
Organizations can also use APIs (application programming interface) to collect data from external sources. APIs allow organizations to access data stored in another system and share and integrate it into their own systems.
Finally, organizations can also use manual methods to collect data from external sources. This can involve contacting companies or individuals directly to request data, by using the right tools and methods to get the insights they need.
- What are common challenges in data collection?
There are many challenges that researchers face when collecting data. Here are five common examples:
Big data environments
Data collection can be a challenge in big data environments for several reasons. It can be located in different places, such as archives, libraries, or online. The sheer volume of data can also make it difficult to identify the most relevant data sets.
Second, the complexity of data sets can make it challenging to extract the desired information. Third, the distributed nature of big data environments can make it difficult to collect data promptly and efficiently.
Therefore it is important to have a well-designed data collection strategy to consider the specific needs of the organization and what data sets are the most relevant. Alongside this, consideration should be made regarding the tools and resources available to support data collection and protect it from unintended use.
Data bias is a common challenge in data collection. It occurs when data is collected from a sample that is not representative of the population of interest.
There are different types of data bias, but some common ones include selection bias, self-selection bias, and response bias. Selection bias can occur when the collected data does not represent the population being studied. For example, if a study only includes data from people who volunteer to participate, that data may not represent the general population.
Self-selection bias can also occur when people self-select into a study, such as by taking part only if they think they will benefit from it. Response bias happens when people respond in a way that is not honest or accurate, such as by only answering questions that make them look good.
These types of data bias present a challenge because they can lead to inaccurate results and conclusions about behaviors, perceptions, and trends. Data bias can be avoided by identifying potential sources or themes of bias and setting guidelines for eliminating them.
Lack of quality assurance processes
One of the biggest challenges in data collection is the lack of quality assurance processes. This can lead to several problems, including incorrect data, missing data, and inconsistencies between data sets.
Quality assurance is important because there are many data sources, and each source may have different levels of quality or corruption. There are also different ways of collecting data, and data quality may vary depending on the method used.
There are several ways to improve quality assurance in data collection. These include developing clear and consistent goals and guidelines for data collection, implementing quality control measures, using standardized procedures, and employing data validation techniques. By taking these steps, you can ensure that your data is of adequate quality to inform decision-making.
Limited access to data
Another challenge in data collection is limited access to data. This can be due to several reasons, including privacy concerns, the sensitive nature of the data, security concerns, or simply the fact that data is not readily available.
Legal and compliance regulations
Most countries have regulations governing how data can be collected, used, and stored. In some cases, data collected in one country may not be used in another. This means gaining a global perspective can be a challenge.
For example, if a company is required to comply with the EU General Data Protection Regulation (GDPR), it may not be able to collect data from individuals in the EU without their explicit consent. This can make it difficult to collect data from a target audience.
Legal and compliance regulations can be complex, and it's important to ensure that all data collected is done so in a way that complies with the relevant regulations.
- What are the key steps in the data collection process?
There are five steps involved in the data collection process. They are:
1. Decide what data you want to gather
Have a clear understanding of the questions you are asking, and then consider where the answers might lie and how you might obtain them. This saves time and resources by avoiding the collection of irrelevant data, and helps maintain the quality of your datasets.
2. Establish a deadline for data collection
Establishing a deadline for data collection helps you avoid collecting too much data, which can be costly and time-consuming to analyze. It also allows you to plan for data analysis and prompt interpretation. Finally, it helps you meet your research goals and objectives and allows you to move forward.
3. Select a data collection approach
The data collection approach you choose will depend on different factors, including the type of data you need, available resources, and the project timeline. For instance, if you need qualitative data, you might choose a focus group or interview methodology. If you need quantitative data , then a survey or observational study may be the most appropriate form of collection.
4. Gather information
When collecting data for your business, identify your business goals first. Once you know what you want to achieve, you can start collecting data to reach those goals. The most important thing is to ensure that the data you collect is reliable and valid. Otherwise, any decisions you make using the data could result in a negative outcome for your business.
5. Examine the information and apply your findings
As a researcher, it's important to examine the data you're collecting and analyzing before you apply your findings. This is because data can be misleading, leading to inaccurate conclusions. Ask yourself whether it is what you are expecting? Is it similar to other datasets you have looked at?
There are many scientific ways to examine data, but some common methods include:
looking at the distribution of data points
examining the relationships between variables
looking for outliers
By taking the time to examine your data and noticing any patterns, strange or otherwise, you can avoid making mistakes that could invalidate your research.
- How qualitative analysis software streamlines the data collection process
Knowledge derived from data does indeed carry power. However, if you don't convert the knowledge into action, it will remain a resource of unexploited energy and wasted potential.
Luckily, data collection tools enable organizations to streamline their data collection and analysis processes and leverage the derived knowledge to grow their businesses. For instance, qualitative analysis software can be highly advantageous in data collection by streamlining the process, making it more efficient and less time-consuming.
Secondly, qualitative analysis software provides a structure for data collection and analysis, ensuring that data is of high quality. It can also help to uncover patterns and relationships that would otherwise be difficult to discern. Moreover, you can use it to replace more expensive data collection methods, such as focus groups or surveys.
Overall, qualitative analysis software can be valuable for any researcher looking to collect and analyze data. By increasing efficiency, improving data quality, and providing greater insights, qualitative software can help to make the research process much more efficient and effective.

Learn more about qualitative research data analysis software
Should you be using a customer insights hub.
Do you want to discover previous research faster?
Do you share your research findings with others?
Do you analyze research data?
Start for free today, add your research, and get to key insights faster
Editor’s picks
Last updated: 13 April 2023
Last updated: 8 February 2023
Last updated: 27 January 2024
Last updated: 17 January 2024
Last updated: 20 January 2024
Last updated: 30 January 2024
Last updated: 7 March 2023
Last updated: 18 May 2023
Last updated: 31 January 2024
Last updated: 23 January 2024
Last updated: 13 May 2024
Latest articles
Related topics, .css-je19u9{-webkit-align-items:flex-end;-webkit-box-align:flex-end;-ms-flex-align:flex-end;align-items:flex-end;display:-webkit-box;display:-webkit-flex;display:-ms-flexbox;display:flex;-webkit-flex-direction:row;-ms-flex-direction:row;flex-direction:row;-webkit-box-flex-wrap:wrap;-webkit-flex-wrap:wrap;-ms-flex-wrap:wrap;flex-wrap:wrap;-webkit-box-pack:center;-ms-flex-pack:center;-webkit-justify-content:center;justify-content:center;row-gap:0;text-align:center;max-width:671px;}@media (max-width: 1079px){.css-je19u9{max-width:400px;}.css-je19u9>span{white-space:pre;}}@media (max-width: 799px){.css-je19u9{max-width:400px;}.css-je19u9>span{white-space:pre;}} decide what to .css-1kiodld{max-height:56px;display:-webkit-box;display:-webkit-flex;display:-ms-flexbox;display:flex;-webkit-align-items:center;-webkit-box-align:center;-ms-flex-align:center;align-items:center;}@media (max-width: 1079px){.css-1kiodld{display:none;}} build next, decide what to build next.

Users report unexpectedly high data usage, especially during streaming sessions.

Users find it hard to navigate from the home page to relevant playlists in the app.

It would be great to have a sleep timer feature, especially for bedtime listening.

I need better filters to find the songs or artists I’m looking for.
Log in or sign up
Get started for free

A Guide to Data Collection: Methods, Process, and Tools

Whether your field is development economics, international development, the nonprofit sector, or myriad other industries, effective data collection is essential. It informs decision-making and increases your organization’s impact. However, the process of data collection can be complex and challenging. If you’re in the beginning stages of creating a data collection process, this guide is for you. It outlines tested methods, efficient procedures, and effective tools to help you improve your data collection activities and outcomes. At SurveyCTO, we’ve used our years of experience and expertise to build a robust, secure, and scalable mobile data collection platform. It’s trusted by respected institutions like The World Bank, J-PAL, Oxfam, and the Gates Foundation, and it’s changed the way many organizations collect and use data. With this guide, we want to share what we know and help you get ready to take the first step in your data collection journey.
Main takeaways from this guide
- Before starting the data collection process, define your goals and identify data sources, which can be primary (first-hand research) or secondary (existing resources).
- Your data collection method should align with your goals, resources, and the nature of the data needed. Surveys, interviews, observations, focus groups, and forms are common data collection methods.
- Sampling involves selecting a representative group from a larger population. Choosing the right sampling method to gather representative and relevant data is crucial.
- Crafting effective data collection instruments like surveys and questionnaires is key. Instruments should undergo rigorous testing for reliability and accuracy.
- Data collection is an ongoing, iterative process that demands real-time monitoring and adjustments to ensure high-quality, reliable results.
- After data collection, data should be cleaned to eliminate errors and organized for efficient analysis. The data collection journey further extends into data analysis, where patterns and useful information that can inform decision-making are discovered.
- Common challenges in data collection include data quality and consistency issues, data security concerns, and limitations with offline surveys . Employing robust data validation processes, implementing strong security protocols, and using offline-enabled data collection tools can help overcome these challenges.
- Data collection, entry, and management tools and data analysis, visualization, reporting, and workflow tools can streamline the data collection process, improve data quality, and facilitate data analysis.
What is data collection?

The traditional definition of data collection might lead us to think of gathering information through surveys, observations, or interviews. However, the modern-age definition of data collection extends beyond conducting surveys and observations. It encompasses the systematic gathering and recording of any kind of information through digital or manual methods. Data collection can be as routine as a doctor logging a patient’s information into an electronic medical record system during each clinic visit, or as specific as keeping a record of mosquito nets delivered to a rural household.
Getting started with data collection

Before starting your data collection process, you must clearly understand what you aim to achieve and how you’ll get there. Below are some actionable steps to help you get started.
1. Define your goals
Defining your goals is a crucial first step. Engage relevant stakeholders and team members in an iterative and collaborative process to establish clear goals. It’s important that projects start with the identification of key questions and desired outcomes to ensure you focus your efforts on gathering the right information.
Start by understanding the purpose of your project– what problem are you trying to solve, or what change do you want to bring about? Think about your project’s potential outcomes and obstacles and try to anticipate what kind of data would be useful in these scenarios. Consider who will be using the data you collect and what data would be the most valuable to them. Think about the long-term effects of your project and how you will measure these over time. Lastly, leverage any historical data from previous projects to help you refine key questions that may have been overlooked previously.
Once questions and outcomes are established, your data collection goals may still vary based on the context of your work. To demonstrate, let’s use the example of an international organization working on a healthcare project in a remote area.
- If you’re a researcher , your goal will revolve around collecting primary data to answer specific questions. This could involve designing a survey or conducting interviews to collect first-hand data on patient improvement, disease or illness prevalence, and behavior changes (such as an increase in patients seeking healthcare).
- If you’re part of the monitoring and evaluation ( M&E) team , your goal will revolve around measuring the success of your healthcare project. This could involve collecting primary data through surveys or observations and developing a dashboard to display real-time metrics like the number of patients treated, percentage of reduction in incidences of disease,, and average patient wait times. Your focus would be using this data to implement any needed program changes and ensure your project meets its objectives.
- If you’re part of a field team , your goal will center around the efficient and accurate execution of project plans. You might be responsible for using data collection tools to capture pertinent information in different settings, such as in interviews takendirectly from the sample community or over the phone. The data you collect and manage will directly influence the operational efficiency of the project and assist in achieving the project’s overarching objectives.
2. Identify your data sources
The crucial next step in your research process is determining your data source. Essentially, there are two main data types to choose from: primary and secondary.
- Primary data is the information you collect directly from first-hand engagements. It’s gathered specifically for your research and tailored to your research question. Primary data collection methods can range from surveys and interviews to focus groups and observations. Because you design the data collection process, primary data can offer precise, context-specific information directly related to your research objectives. For example, suppose you are investigating the impact of a new education policy. In that case, primary data might be collected through surveys distributed to teachers or interviews with school administrators dealing directly with the policy’s implementation.
- Secondary data, on the other hand, is derived from resources that already exist. This can include information gathered for other research projects, administrative records, historical documents, statistical databases, and more. While not originally collected for your specific study, secondary data can offer valuable insights and background information that complement your primary data. For instance, continuing with the education policy example, secondary data might involve academic articles about similar policies, government reports on education or previous survey data about teachers’ opinions on educational reforms.
While both types of data have their strengths, this guide will predominantly focus on primary data and the methods to collect it. Primary data is often emphasized in research because it provides fresh, first-hand insights that directly address your research questions. Primary data also allows for more control over the data collection process, ensuring data is relevant, accurate, and up-to-date.
However, secondary data can offer critical context, allow for longitudinal analysis, save time and resources, and provide a comparative framework for interpreting your primary data. It can be a crucial backdrop against which your primary data can be understood and analyzed. While we focus on primary data collection methods in this guide, we encourage you not to overlook the value of incorporating secondary data into your research design where appropriate.
3. Choose your data collection method
When choosing your data collection method, there are many options at your disposal. Data collection is not limited to methods like surveys and interviews. In fact, many of the processes in our daily lives serve the goal of collecting data, from intake forms to automated endpoints, such as payment terminals and mass transit card readers. Let us dive into some common types of data collection methods:
Surveys and Questionnaires
Surveys and questionnaires are tools for gathering information about a group of individuals, typically by asking them predefined questions. They can be used to collect quantitative and qualitative data and be administered in various ways, including online, over the phone, in person (offline), or by mail.
- Advantages : They allow researchers to reach many participants quickly and cost-effectively, making them ideal for large-scale studies. The structured format of questions makes analysis easier.
- Disadvantages : They may not capture complex or nuanced information as participants are limited to predefined response choices. Also, there can be issues with response bias, where participants might provide socially desirable answers rather than honest ones.
Interviews involve a one-on-one conversation between the researcher and the participant. The interviewer asks open-ended questions to gain detailed information about the participant’s thoughts, feelings, experiences, and behaviors.
- Advantages : They allow for an in-depth understanding of the topic at hand. The researcher can adapt the questioning in real time based on the participant’s responses, allowing for more flexibility.
- Disadvantages : They can be time-consuming and resource-intensive, as they require trained interviewers and a significant amount of time for both conducting and analyzing responses. They may also introduce interviewer bias if not conducted carefully, due to how an interviewer presents questions and perceives the respondent, and how the respondent perceives the interviewer.
Observations
Observations involve directly observing and recording behavior or other phenomena as they occur in their natural settings.
- Advantages : Observations can provide valuable contextual information, as researchers can study behavior in the environment where it naturally occurs, reducing the risk of artificiality associated with laboratory settings or self-reported measures.
- Disadvantages : Observational studies may suffer from observer bias, where the observer’s expectations or biases could influence their interpretation of the data. Also, some behaviors might be altered if subjects are aware they are being observed.
Focus Groups
Focus groups are guided discussions among selected individuals to gain information about their views and experiences.
- Advantages : Focus groups allow for interaction among participants, which can generate a diverse range of opinions and ideas. They are good for exploring new topics where there is little pre-existing knowledge.
- Disadvantages : Dominant voices in the group can sway the discussion, potentially silencing less assertive participants. They also require skilled facilitators to moderate the discussion effectively.
Forms are standardized documents with blank fields for collecting data in a systematic manner. They are often used in fields like Customer Relationship Management (CRM) or Electronic Medical Records (EMR) data entry. Surveys may also be referred to as forms.
- Advantages : Forms are versatile, easy to use, and efficient for data collection. They can streamline workflows by standardizing the data entry process.
- Disadvantages : They may not provide in-depth insights as the responses are typically structured and limited. There is also potential for errors in data entry, especially when done manually.
Selecting the right data collection method should be an intentional process, taking into consideration the unique requirements of your project. The method selected should align with your goals, available resources, and the nature of the data you need to collect.
If you aim to collect quantitative data, surveys, questionnaires, and forms can be excellent tools, particularly for large-scale studies. These methods are suited to providing structured responses that can be analyzed statistically, delivering solid numerical data.
However, if you’re looking to uncover a deeper understanding of a subject, qualitative data might be more suitable. In such cases, interviews, observations, and focus groups can provide richer, more nuanced insights. These methods allow you to explore experiences, opinions, and behaviors deeply. Some surveys can also include open-ended questions that provide qualitative data.
The cost of data collection is also an important consideration. If you have budget constraints, in-depth, in-person conversations with every member of your target population may not be practical. In such cases, distributing questionnaires or forms can be a cost-saving approach.
Additional considerations include language barriers and connectivity issues. If your respondents speak different languages, consider translation services or multilingual data collection tools . If your target population resides in areas with limited connectivity and your method will be to collect data using mobile devices, ensure your tool provides offline data collection , which will allow you to carry out your data collection plan without internet connectivity.
4. Determine your sampling method
Now that you’ve established your data collection goals and how you’ll collect your data, the next step is deciding whom to collect your data from. Sampling involves carefully selecting a representative group from a larger population. Choosing the right sampling method is crucial for gathering representative and relevant data that aligns with your data collection goal.
Consider the following guidelines to choose the appropriate sampling method for your research goal and data collection method:
- Understand Your Target Population: Start by conducting thorough research of your target population. Understand who they are, their characteristics, and subgroups within the population.
- Anticipate and Minimize Biases: Anticipate and address potential biases within the target population to help minimize their impact on the data. For example, will your sampling method accurately reflect all ages, gender, cultures, etc., of your target population? Are there barriers to participation for any subgroups? Your sampling method should allow you to capture the most accurate representation of your target population.
- Maintain Cost-Effective Practices: Consider the cost implications of your chosen sampling methods. Some sampling methods will require more resources, time, and effort. Your chosen sampling method should balance the cost factors with the ability to collect your data effectively and accurately.
- Consider Your Project’s Objectives: Tailor the sampling method to meet your specific objectives and constraints, such as M&E teams requiring real-time impact data and researchers needing representative samples for statistical analysis.
By adhering to these guidelines, you can make informed choices when selecting a sampling method, maximizing the quality and relevance of your data collection efforts.
5. Identify and train collectors
Not every data collection use case requires data collectors, but training individuals responsible for data collection becomes crucial in scenarios involving field presence.
The SurveyCTO platform supports both self-response survey modes and surveys that require a human field worker to do in-person interviews. Whether you’re hiring and training data collectors, utilizing an existing team, or training existing field staff, we offer comprehensive guidance and the right tools to ensure effective data collection practices.
Here are some common training approaches for data collectors:
- In-Class Training: Comprehensive sessions covering protocols, survey instruments, and best practices empower data collectors with skills and knowledge.
- Tests and Assessments: Assessments evaluate collectors’ understanding and competence, highlighting areas where additional support is needed.
- Mock Interviews: Simulated interviews refine collectors’ techniques and communication skills.
- Pre-Recorded Training Sessions: Accessible reinforcement and self-paced learning to refresh and stay updated.
Training data collectors is vital for successful data collection techniques. Your training should focus on proper instrument usage and effective interaction with respondents, including communication skills, cultural literacy, and ethical considerations.
Remember, training is an ongoing process. Knowledge gaps and issues may arise in the field, necessitating further training.
Moving Ahead: Iterative Steps in Data Collection

Once you’ve established the preliminary elements of your data collection process, you’re ready to start your data collection journey. In this section, we’ll delve into the specifics of designing and testing your instruments, collecting data, and organizing data while embracing the iterative nature of the data collection process, which requires diligent monitoring and making adjustments when needed.
6. Design and test your instruments
Designing effective data collection instruments like surveys and questionnaires is key. It’s crucial to prioritize respondent consent and privacy to ensure the integrity of your research. Thoughtful design and careful testing of survey questions are essential for optimizing research insights. Other critical considerations are:
- Clear and Unbiased Question Wording: Craft unambiguous, neutral questions free from bias to gather accurate and meaningful data. For example, instead of asking, “Shouldn’t we invest more into renewable energy that will combat the effects of climate change?” ask your question in a neutral way that allows the respondent to voice their thoughts. For example: “What are your thoughts on investing more in renewable energy?”
- Logical Ordering and Appropriate Response Format: Arrange questions logically and choose response formats (such as multiple-choice, Likert scale, or open-ended) that suit the nature of the data you aim to collect.
- Coverage of Relevant Topics: Ensure that your instrument covers all topics pertinent to your data collection goals while respecting cultural and social sensitivities. Make sure your instrument avoids assumptions, stereotypes, and languages or topics that could be considered offensive or taboo in certain contexts. The goal is to avoid marginalizing or offending respondents based on their social or cultural background.
- Collect Only Necessary Data: Design survey instruments that focus solely on gathering the data required for your research objectives, avoiding unnecessary information.
- Language(s) of the Respondent Population: Tailor your instruments to accommodate the languages your target respondents speak, offering translated versions if needed. Similarly, take into account accessibility for respondents who can’t read by offering alternative formats like images in place of text.
- Desired Length of Time for Completion: Respect respondents’ time by designing instruments that can be completed within a reasonable timeframe, balancing thoroughness with engagement. Having a general timeframe for the amount of time needed to complete a response will also help you weed out bad responses. For example, a response that was rushed and completed outside of your response timeframe could indicate a response that needs to be excluded.
- Collecting and Documenting Respondents’ Consent and Privacy: Ensure a robust consent process, transparent data usage communication, and privacy protection throughout data collection.
Perform Cognitive Interviewing
Cognitive interviewing is a method used to refine survey instruments and improve the accuracy of survey responses by evaluating how respondents understand, process, and respond to the instrument’s questions. In practice, cognitive interviewing involves an interview with the respondent, asking them to verbalize their thoughts as they interact with the instrument. By actively probing and observing their responses, you can identify and address ambiguities, ensuring accurate data collection.
Thoughtful question wording, well-organized response options, and logical sequencing enhance comprehension, minimize biases, and ensure accurate data collection. Iterative testing and refinement based on respondent feedback improve the validity, reliability, and actionability of insights obtained.
Put Your Instrument to the Test
Through rigorous testing, you can uncover flaws, ensure reliability, maximize accuracy, and validate your instrument’s performance. This can be achieved by:
- Conducting pilot testing to enhance the reliability and effectiveness of data collection. Administer the instrument, identify difficulties, gather feedback, and assess performance in real-world conditions.
- Making revisions based on pilot testing to enhance clarity, accuracy, usability, and participant satisfaction. Refine questions, instructions, and format for effective data collection.
- Continuously iterating and refining your instrument based on feedback and real-world testing. This ensures reliable, accurate, and audience-aligned methods of data collection. Additionally, this ensures your instrument adapts to changes, incorporates insights, and maintains ongoing effectiveness.
7. Collect your data
Now that you have your well-designed survey, interview questions, observation plan, or form, it’s time to implement it and gather the needed data. Data collection is not a one-and-done deal; it’s an ongoing process that demands attention to detail. Imagine spending weeks collecting data, only to discover later that a significant portion is unusable due to incomplete responses, improper collection methods, or falsified responses. To avoid such setbacks, adopt an iterative approach.
Leverage data collection tools with real-time monitoring to proactively identify outliers and issues. Take immediate action by fine-tuning your instruments, optimizing the data collection process, addressing concerns like additional training, or reevaluating personnel responsible for inaccurate data (for example, a field worker who sits in a coffee shop entering fake responses rather than doing the work of knocking on doors).
SurveyCTO’s Data Explorer was specifically designed to fulfill this requirement, empowering you to monitor incoming data, gain valuable insights, and know where changes may be needed. Embracing this iterative approach ensures ongoing improvement in data collection, resulting in more reliable and precise results.
8. Clean and organize your data
After data collection, the next step is to clean and organize the data to ensure its integrity and usability.
- Data Cleaning: This stage involves sifting through your data to identify and rectify any errors, inconsistencies, or missing values. It’s essential to maintain the accuracy of your data and ensure that it’s reliable for further analysis. Data cleaning can uncover duplicates, outliers, and gaps that could skew your results if left unchecked. With real-time data monitoring , this continuous cleaning process keeps your data precise and current throughout the data collection period. Similarly, review and corrections workflows allow you to monitor the quality of your incoming data.
- Organizing Your Data: Post-cleaning, it’s time to organize your data for efficient analysis and interpretation. Labeling your data using appropriate codes or categorizations can simplify navigation and streamline the extraction of insights. When you use a survey or form, labeling your data is often not necessary because you can design the instrument to collect in the right categories or return the right codes. An organized dataset is easier to manage, analyze, and interpret, ensuring that your collection efforts are not wasted but lead to valuable, actionable insights.
Remember, each stage of the data collection process, from design to cleaning, is iterative and interconnected. By diligently cleaning and organizing your data, you are setting the stage for robust, meaningful analysis that can inform your data-driven decisions and actions.
What happens after data collection?

The data collection journey takes us next into data analysis, where you’ll uncover patterns, empowering informed decision-making for researchers, evaluation teams, and field personnel.
Process and Analyze Your Data
Explore data through statistical and qualitative techniques to discover patterns, correlations, and insights during this pivotal stage. It’s about extracting the essence of your data and translating numbers into knowledge. Whether applying descriptive statistics, conducting regression analysis, or using thematic coding for qualitative data, this process drives decision-making and charts the path toward actionable outcomes.
Interpret and Report Your Results
Interpreting and reporting your data brings meaning and context to the numbers. Translating raw data into digestible insights for informed decision-making and effective stakeholder communication is critical.
The approach to interpretation and reporting varies depending on the perspective and role:
- Researchers often lean heavily on statistical methods to identify trends, extract meaningful conclusions, and share their findings in academic circles, contributing to their knowledge pool.
- M&E teams typically produce comprehensive reports, shedding light on the effectiveness and impact of programs. These reports guide internal and sometimes external stakeholders, supporting informed decisions and driving program improvements.
Field teams provide a first-hand perspective. Since they are often the first to see the results of the practical implementation of data, field teams are instrumental in providing immediate feedback loops on project initiatives. Field teams do the work that provides context to help research and M&E teams understand external factors like the local environment, cultural nuances, and logistical challenges that impact data results.
Safely store and handle data
Throughout the data collection process, and after it has been collected, it is vital to follow best practices for storing and handling data to ensure the integrity of your research. While the specifics of how to best store and handle data will depend on your project, here are some important guidelines to keep in mind:
- Use cloud storage to hold your data if possible, since this is safer than storing data on hard drives and keeps it more accessible,
- Periodically back up and purge old data from your system, since it’s safer to not retain data longer than necessary,
- If you use mobile devices to collect and store data, use options for private, internal apps-specific storage if and when possible,
- Restrict access to stored data to only those who need to work with that data.
Further considerations for data safety are discussed below in the section on data security .
Remember to uphold ethical standards in interpreting and reporting your data, regardless of your role. Clear communication, respectful handling of sensitive information, and adhering to confidentiality and privacy rights are all essential to fostering trust, promoting transparency, and bolstering your work’s credibility.
Common Data Collection Challenges

Data collection is vital to data-driven initiatives, but it comes with challenges. Addressing common challenges such as poor data quality, privacy concerns, inadequate sample sizes, and bias is essential to ensure the collected data is reliable, trustworthy, and secure.
In this section, we’ll explore three major challenges: data quality and consistency issues, data security concerns, and limitations with offline data collection , along with strategies to overcome them.
Data Quality and Consistency
Data quality and consistency refer to data accuracy and reliability throughout the collection and analysis process.
Challenges such as incomplete or missing data, data entry errors, measurement errors, and data coding/categorization errors can impact the integrity and usefulness of the data.
To navigate these complexities and maintain high standards, consistency, and integrity in the dataset:
- Implement robust data validation processes,
- Ensure proper training for data entry personnel,
- Employ automated data validation techniques, and
- Conduct regular data quality audits.
Data security
Data security encompasses safeguarding data through ensuring data privacy and confidentiality, securing storage and backup, and controlling data sharing and access.
Challenges include the risk of potential breaches, unauthorized access, and the need to comply with data protection regulations.
To address these setbacks and maintain privacy, trust, and confidence during the data collection process:
- Use encryption and authentication methods,
- Implement robust security protocols,
- Update security measures regularly,
- Provide employee training on data security, and
- Adopt secure cloud storage solutions.
Offline Data Collection
Offline data collection refers to the process of gathering data using modes like mobile device-based computer-assisted personal interviewing (CAPI) when t here is an inconsistent or unreliable internet connection, and the data collection tool being used for CAPI has the functionality to work offline.
Challenges associated with offline data collection include synchronization issues, difficulty transferring data, and compatibility problems between devices, and data collection tools.
To overcome these challenges and enable efficient and reliable offline data collection processes, employ the following strategies:
- Leverage offline-enabled data collection apps or tools that enable you to survey respondents even when there’s no internet connection, and upload data to a central repository at a later time.
- Your data collection plan should include times for periodic data synchronization when connectivity is available,
- Use offline, device-based storage for seamless data transfer and compatibility, and
- Provide clear instructions to field personnel on handling offline data collection scenarios.
Utilizing Technology in Data Collection

Embracing technology throughout your data collection process can help you overcome many challenges described in the previous section. Data collection tools can streamline your data collection, improve the quality and security of your data, and facilitate the analysis of your data. Let’s look at two broad categories of tools that are essential for data collection:
Data Collection, Entry, & Management Tools
These tools help with data collection, input, and organization. They can range from digital survey platforms to comprehensive database systems, allowing you to gather, enter, and manage your data effectively. They can significantly simplify the data collection process, minimize human error, and offer practical ways to organize and manage large volumes of data. Some of these tools are:
- Microsoft Office
- Google Docs
- SurveyMonkey
- Google Forms
Data Analysis, Visualization, Reporting, & Workflow Tools
These tools assist in processing and interpreting the collected data. They provide a way to visualize data in a user-friendly format, making it easier to identify trends and patterns. These tools can also generate comprehensive reports to share your findings with stakeholders and help manage your workflow efficiently. By automating complex tasks, they can help ensure accuracy and save time. Tools for these purposes include:
- Google sheets
Data collection tools like SurveyCTO often have integrations to help users seamlessly transition from data collection to data analysis, visualization, reporting, and managing workflows.
Master Your Data Collection Process With SurveyCTO
As we bring this guide to a close, you now possess a wealth of knowledge to develop your data collection process. From understanding the significance of setting clear goals to the crucial process of selecting your data collection methods and addressing common challenges, you are equipped to handle the intricate details of this dynamic process.
Remember, you’re not venturing into this complex process alone. At SurveyCTO, we offer not just a tool but an entire support system committed to your success. Beyond troubleshooting support, our success team serves as research advisors and expert partners, ready to provide guidance at every stage of your data collection journey.
With SurveyCTO , you can design flexible surveys in Microsoft Excel or Google Sheets, collect data online and offline with above-industry-standard security, monitor your data in real time, and effortlessly export it for further analysis in any tool of your choice. You also get access to our Data Explorer, which allows you to visualize incoming data at both individual survey and aggregate levels instantly.
In the iterative data collection process, our users tell us that SurveyCTO stands out with its capacity to establish review and correction workflows. It enables you to monitor incoming data and configure automated quality checks to flag error-prone submissions.
Finally, data security is of paramount importance to us. We ensure best-in-class security measures like SOC 2 compliance, end-to-end encryption, single sign-on (SSO), GDPR-compliant setups, customizable user roles, and self-hosting options to keep your data safe.
As you embark on your data collection journey, you can count on SurveyCTO’s experience and expertise to be by your side every step of the way. Our team would be excited and honored to be a part of your research project, offering you the tools and processes to gain informative insights and make effective decisions. Partner with us today and revolutionize the way you collect data.
Better data, better decision making, better world.

INTEGRATIONS

Data Collection Methods
Data collection is a process of collecting information from all the relevant sources to find answers to the research problem, test the hypothesis (if you are following deductive approach ) and evaluate the outcomes. Data collection methods can be divided into two categories: secondary methods of data collection and primary methods of data collection.
Secondary Data Collection Methods
Secondary data is a type of data that has already been published in books, newspapers, magazines, journals, online portals etc. There is an abundance of data available in these sources about your research area in business studies, almost regardless of the nature of the research area. Therefore, application of appropriate set of criteria to select secondary data to be used in the study plays an important role in terms of increasing the levels of research validity and reliability.
These criteria include, but not limited to date of publication, credential of the author, reliability of the source, quality of discussions, depth of analyses, the extent of contribution of the text to the development of the research area etc. Secondary data collection is discussed in greater depth in Literature Review chapter.
Secondary data collection methods offer a range of advantages such as saving time, effort and expenses. However they have a major disadvantage. Specifically, secondary research does not make contribution to the expansion of the literature by producing fresh (new) data.
Primary Data Collection Methods
Primary data is the type of data that has not been around before. Primary data is unique findings of your research. Primary data collection and analysis typically requires more time and effort to conduct compared to the secondary data research. Primary data collection methods can be divided into two groups: quantitative and qualitative.
Quantitative data collection methods are based on mathematical calculations in various formats. Methods of quantitative data collection and analysis include questionnaires with closed-ended questions, methods of correlation and regression, mean, mode and median and others.
Quantitative methods are cheaper to apply and they can be applied within shorter duration of time compared to qualitative methods. Moreover, due to a high level of standardisation of quantitative methods, it is easy to make comparisons of findings.
Qualitative research methods , on the contrary, do not involve numbers or mathematical calculations. Qualitative research is closely associated with words, sounds, feeling, emotions, colours and other elements that are non-quantifiable.
Qualitative studies aim to ensure greater level of depth of understanding and qualitative data collection methods include interviews, questionnaires with open-ended questions, focus groups, observation, game or role-playing, case studies etc.
Your choice between quantitative or qualitative methods of data collection depends on the area of your research and the nature of research aims and objectives.
My e-book, The Ultimate Guide to Writing a Dissertation in Business Studies: a step by step assistance offers practical assistance to complete a dissertation with minimum or no stress. The e-book covers all stages of writing a dissertation starting from the selection to the research area to submitting the completed version of the work within the deadline.
John Dudovskiy

- Skip to main content
- Skip to primary sidebar
- Skip to footer
- QuestionPro

- Solutions Industries Gaming Automotive Sports and events Education Government Travel & Hospitality Financial Services Healthcare Cannabis Technology Use Case NPS+ Communities Audience Contactless surveys Mobile LivePolls Member Experience GDPR Positive People Science 360 Feedback Surveys
- Resources Blog eBooks Survey Templates Case Studies Training Help center
Home QuestionPro QuestionPro Products
Data Collection Methods: Types & Examples

Data is a collection of facts, figures, objects, symbols, and events gathered from different sources. Organizations collect data using various methods to make better decisions. Without data, it would be difficult for organizations to make appropriate decisions, so data is collected from different audiences at various times.
For example, an organization must collect data on product demand, customer preferences, and competitors before launching a new product. If data is not collected beforehand, the organization’s newly launched product may fail for many reasons, such as less demand and inability to meet customer needs.
Although data is a valuable asset for every organization, it does not serve any purpose until it is analyzed or processed to achieve the desired results.
What are Data Collection Methods?
Data collection methods are techniques and procedures for gathering information for research purposes. They can range from simple self-reported surveys to more complex quantitative or qualitative experiments.
Some common data collection methods include surveys , interviews, observations, focus groups, experiments, and secondary data analysis . The data collected through these methods can then be analyzed and used to support or refute research hypotheses and draw conclusions about the study’s subject matter.
Understanding Data Collection Methods
Data collection methods encompass a variety of techniques and tools for gathering quantitative and qualitative data. These methods are integral to the data collection process and ensure accurate and comprehensive data acquisition.
Quantitative data collection methods involve systematic approaches to collecting data, like numerical data, such as surveys, polls, and statistical analysis, aimed at quantifying phenomena and trends.
Conversely, qualitative data collection methods focus on capturing non-numerical information, such as interviews, focus groups, and observations, to delve deeper into understanding attitudes, behaviors, and motivations.
Combining quantitative and qualitative data collection techniques can enrich organizations’ datasets and gain comprehensive insights into complex phenomena.
Effective utilization of accurate data collection tools and techniques enhances the accuracy and reliability of collected data, facilitating informed decision-making and strategic planning.
LEARN ABOUT: Self-Selection Bias
Importance of Data Collection Methods
Data collection methods play a crucial role in the research process as they determine the quality and accuracy of the data collected. Here are some major importance of data collection methods.
- Quality and Accuracy: The choice of data collection technique directly impacts the quality and accuracy of the data obtained. Properly designed methods help ensure that the data collected is error-free and relevant to the research questions.
- Relevance, Validity, and Reliability: Effective data collection methods help ensure that the data collected is relevant to the research objectives, valid (measuring what it intends to measure), and reliable (consistent and reproducible).
- Bias Reduction and Representativeness: Carefully chosen data collection methods can help minimize biases inherent in the research process, such as sampling bias or response bias. They also aid in achieving a representative sample, enhancing the findings’ generalizability.
- Informed Decision Making: Accurate and reliable data collected through appropriate methods provide a solid foundation for making informed decisions based on research findings. This is crucial for both academic research and practical applications in various fields.
- Achievement of Research Objectives: Data collection methods should align with the research objectives to ensure that the collected data effectively addresses the research questions or hypotheses. Properly collected data facilitates the attainment of these objectives.
- Support for Validity and Reliability: Validity and reliability are essential to research validity. The choice of data collection methods can either enhance or detract from the validity and reliability of research findings. Therefore, selecting appropriate methods is critical for ensuring the credibility of the research.
The importance of data collection methods cannot be overstated, as they play a key role in the research study’s overall success and internal validity .
Types of Data Collection Methods
The choice of data collection method depends on the research question being addressed, the type of data needed, and the resources and time available. Data collection methods can be categorized into primary and secondary methods.
1. Primary Data Collection Methods
Primary data is collected from first-hand experience and is not used in the past. The data gathered by primary data collection methods are highly accurate and specific to the research’s motive.
Primary data collection methods can be divided into two categories: quantitative methods and qualitative methods .
Quantitative Methods:
Quantitative techniques for market research and demand forecasting usually use statistical tools. In these techniques, demand is forecasted based on historical data. These methods of primary data collection are generally used to make long-term forecasts. Statistical analysis methods are highly reliable as subjectivity is minimal.

- Time Series Analysis: A time series refers to a sequential order of values of a variable, known as a trend, at equal time intervals. Using patterns, an organization can predict the demand for its products and services over a projected time period.
- Smoothing Techniques: Smoothing techniques can be used in cases where the time series lacks significant trends. They eliminate random variation from the historical demand, helping identify patterns and demand levels to estimate future demand. The most common methods used in smoothing demand forecasting are the simple moving average and weighted moving average methods.
- Barometric Method: Also known as the leading indicators approach, researchers use this method to speculate future trends based on current developments. When past events are considered to predict future events, they act as leading indicators.
Qualitative Methods:
Qualitative data collection methods are especially useful when historical data is unavailable or when numbers or mathematical calculations are unnecessary.
Qualitative research is closely associated with words, sounds, feelings, emotions, colors, and non-quantifiable elements. These techniques are based on experience, judgment, intuition, conjecture, emotion, etc.
Quantitative methods do not provide the motive behind participants’ responses, often don’t reach underrepresented populations, and require long periods of time to collect the data. Hence, it is best to combine quantitative methods with qualitative methods.
1. Surveys: Surveys collect data from the target audience and gather insights into their preferences, opinions, choices, and feedback related to their products and services. Most survey software offers a wide range of question types.
You can also use a ready-made survey template to save time and effort. Online surveys can be customized to match the business’s brand by changing the theme, logo, etc. They can be distributed through several channels, such as email, website, offline app, QR code, social media, etc.
You can select the channel based on your audience’s type and source. Once the data is collected, survey software can generate various reports and run analytics algorithms to discover hidden insights.
A survey dashboard can give you statistics related to response rate, completion rate, demographics-based filters, export and sharing options, etc. Integrating survey builders with third-party apps can maximize the effort spent on online real-time data collection .
Practical business intelligence relies on the synergy between analytics and reporting , where analytics uncovers valuable insights, and reporting communicates these findings to stakeholders.
2. Polls: Polls comprise one single or multiple-choice question . They are useful when you need to get a quick pulse of the audience’s sentiments. Because they are short, it is easier to get responses from people.
Like surveys, online polls can be embedded into various platforms. Once the respondents answer the question, they can also be shown how they compare to others’ responses.
Interviews: In this method, the interviewer asks the respondents face-to-face or by telephone.
3. Interviews: In face-to-face interviews, the interviewer asks a series of questions to the interviewee in person and notes down responses. If it is not feasible to meet the person, the interviewer can go for a telephone interview.
This form of data collection is suitable for only a few respondents. It is too time-consuming and tedious to repeat the same process if there are many participants.

4. Delphi Technique: In the Delphi method, market experts are provided with the estimates and assumptions of other industry experts’ forecasts. Experts may reconsider and revise their estimates and assumptions based on this information. The consensus of all experts on demand forecasts constitutes the final demand forecast.
5. Focus Groups: Focus groups are one example of qualitative data in education . In a focus group, a small group of people, around 8-10 members, discuss the common areas of the research problem. Each individual provides his or her insights on the issue concerned.
A moderator regulates the discussion among the group members. At the end of the discussion, the group reaches a consensus.
6. Questionnaire: A questionnaire is a printed set of open-ended or closed-ended questions that respondents must answer based on their knowledge and experience with the issue. The questionnaire is part of the survey, whereas the questionnaire’s end goal may or may not be a survey.
2. Secondary Data Collection Methods
Secondary data is data that has been used in the past. The researcher can obtain data from the data sources , both internal and external, to the organizational data .
Internal sources of secondary data:
- Organization’s health and safety records
- Mission and vision statements
- Financial Statements
- Sales Report
- CRM Software
- Executive summaries
External sources of secondary data:
- Government reports
- Press releases
- Business journals
Secondary data collection methods can also involve quantitative and qualitative techniques. Secondary data is easily available, less time-consuming, and expensive than primary data. However, the authenticity of the data gathered cannot be verified using these methods.
Secondary data collection methods can also involve quantitative and qualitative observation techniques. Secondary data is easily available, less time-consuming, and more expensive than primary data.
However, the authenticity of the data gathered cannot be verified using these methods.
Regardless of the data collection method of your choice, there must be direct communication with decision-makers so that they understand and commit to acting according to the results.
For this reason, we must pay special attention to the analysis and presentation of the information obtained. Remember that these data must be useful and functional to us, so the data collection method has much to do with it.
LEARN ABOUT: Data Asset Management
How Can QuestionPro Help to Create Effective Data Collection?
QuestionPro is a comprehensive online survey software platform that can greatly assist in various data collection methods. Here’s how it can help:
- Survey Creation: QuestionPro offers a user-friendly interface for creating surveys with various question types, including multiple-choice, open-ended, Likert scale, and more. Researchers can customize surveys to fit their specific research needs and objectives.
- Diverse Distribution Channels: The platform provides multiple channels for distributing surveys, including email, web links, social media, and website embedding surveys. This enables researchers to reach a wide audience and collect data efficiently.
- Panel Management: QuestionPro offers panel management features, allowing researchers to create and manage panels of respondents for targeted data collection. This is particularly useful for longitudinal studies or when targeting specific demographics.
- Data Analysis Tools: The platform includes robust data analysis tools that enable researchers to analyze survey responses in real-time. Researchers can generate customizable reports, visualize data through charts and graphs, and identify trends and patterns within the data.
- Data Security and Compliance: QuestionPro prioritizes data security and compliance with regulations such as GDPR and HIPAA. The platform offers features such as SSL encryption, data masking, and secure data storage to ensure the confidentiality and integrity of collected data.
- Mobile Compatibility: With the increasing use of mobile devices, QuestionPro ensures that surveys are mobile-responsive, allowing respondents to participate in surveys conveniently from their smartphones or tablets.
- Integration Capabilities: QuestionPro integrates with various third-party tools and platforms, including CRMs, email marketing software, and analytics tools. This allows researchers to streamline their data collection processes and incorporate survey data into their existing workflows.
- Customization and Branding: Researchers can customize surveys with their branding elements, such as logos, colors, and themes, enhancing the professional appearance of surveys and increasing respondent engagement.
The conclusion you obtain from your investigation will set the course of the company’s decision-making, so present your report clearly and list the steps you followed to obtain those results.
Make sure that whoever will take the corresponding actions understands the importance of the information collected and that it gives them the solutions they expect.
QuestionPro offers a comprehensive suite of features and tools that can significantly streamline the data collection process, from survey creation to analysis, while ensuring data security and compliance. Remember that at QuestionPro, we can help you collect data easily and efficiently. Request a demo and learn about all the tools we have for you.
MORE LIKE THIS

Why Multilingual 360 Feedback Surveys Provide Better Insights
Jun 3, 2024

Raked Weighting: A Key Tool for Accurate Survey Results
May 31, 2024

Top 8 Data Trends to Understand the Future of Data
May 30, 2024

Top 12 Interactive Presentation Software to Engage Your User
May 29, 2024
Other categories
- Academic Research
- Artificial Intelligence
- Assessments
- Brand Awareness
- Case Studies
- Communities
- Consumer Insights
- Customer effort score
- Customer Engagement
- Customer Experience
- Customer Loyalty
- Customer Research
- Customer Satisfaction
- Employee Benefits
- Employee Engagement
- Employee Retention
- Friday Five
- General Data Protection Regulation
- Insights Hub
- Life@QuestionPro
- Market Research
- Mobile diaries
- Mobile Surveys
- New Features
- Online Communities
- Question Types
- Questionnaire
- QuestionPro Products
- Release Notes
- Research Tools and Apps
- Revenue at Risk
- Survey Templates
- Training Tips
- Uncategorized
- Video Learning Series
- What’s Coming Up
- Workforce Intelligence
Have a language expert improve your writing
Run a free plagiarism check in 10 minutes, automatically generate references for free.
- Knowledge Base
- Methodology
- Data Collection Methods | Step-by-Step Guide & Examples
Data Collection Methods | Step-by-Step Guide & Examples
Published on 4 May 2022 by Pritha Bhandari .
Data collection is a systematic process of gathering observations or measurements. Whether you are performing research for business, governmental, or academic purposes, data collection allows you to gain first-hand knowledge and original insights into your research problem .
While methods and aims may differ between fields, the overall process of data collection remains largely the same. Before you begin collecting data, you need to consider:
- The aim of the research
- The type of data that you will collect
- The methods and procedures you will use to collect, store, and process the data
To collect high-quality data that is relevant to your purposes, follow these four steps.
Table of contents
Step 1: define the aim of your research, step 2: choose your data collection method, step 3: plan your data collection procedures, step 4: collect the data, frequently asked questions about data collection.
Before you start the process of data collection, you need to identify exactly what you want to achieve. You can start by writing a problem statement : what is the practical or scientific issue that you want to address, and why does it matter?
Next, formulate one or more research questions that precisely define what you want to find out. Depending on your research questions, you might need to collect quantitative or qualitative data :
- Quantitative data is expressed in numbers and graphs and is analysed through statistical methods .
- Qualitative data is expressed in words and analysed through interpretations and categorisations.
If your aim is to test a hypothesis , measure something precisely, or gain large-scale statistical insights, collect quantitative data. If your aim is to explore ideas, understand experiences, or gain detailed insights into a specific context, collect qualitative data.
If you have several aims, you can use a mixed methods approach that collects both types of data.
- Your first aim is to assess whether there are significant differences in perceptions of managers across different departments and office locations.
- Your second aim is to gather meaningful feedback from employees to explore new ideas for how managers can improve.
Prevent plagiarism, run a free check.
Based on the data you want to collect, decide which method is best suited for your research.
- Experimental research is primarily a quantitative method.
- Interviews , focus groups , and ethnographies are qualitative methods.
- Surveys , observations, archival research, and secondary data collection can be quantitative or qualitative methods.
Carefully consider what method you will use to gather data that helps you directly answer your research questions.
When you know which method(s) you are using, you need to plan exactly how you will implement them. What procedures will you follow to make accurate observations or measurements of the variables you are interested in?
For instance, if you’re conducting surveys or interviews, decide what form the questions will take; if you’re conducting an experiment, make decisions about your experimental design .
Operationalisation
Sometimes your variables can be measured directly: for example, you can collect data on the average age of employees simply by asking for dates of birth. However, often you’ll be interested in collecting data on more abstract concepts or variables that can’t be directly observed.
Operationalisation means turning abstract conceptual ideas into measurable observations. When planning how you will collect data, you need to translate the conceptual definition of what you want to study into the operational definition of what you will actually measure.
- You ask managers to rate their own leadership skills on 5-point scales assessing the ability to delegate, decisiveness, and dependability.
- You ask their direct employees to provide anonymous feedback on the managers regarding the same topics.
You may need to develop a sampling plan to obtain data systematically. This involves defining a population , the group you want to draw conclusions about, and a sample, the group you will actually collect data from.
Your sampling method will determine how you recruit participants or obtain measurements for your study. To decide on a sampling method you will need to consider factors like the required sample size, accessibility of the sample, and time frame of the data collection.
Standardising procedures
If multiple researchers are involved, write a detailed manual to standardise data collection procedures in your study.
This means laying out specific step-by-step instructions so that everyone in your research team collects data in a consistent way – for example, by conducting experiments under the same conditions and using objective criteria to record and categorise observations.
This helps ensure the reliability of your data, and you can also use it to replicate the study in the future.
Creating a data management plan
Before beginning data collection, you should also decide how you will organise and store your data.
- If you are collecting data from people, you will likely need to anonymise and safeguard the data to prevent leaks of sensitive information (e.g. names or identity numbers).
- If you are collecting data via interviews or pencil-and-paper formats, you will need to perform transcriptions or data entry in systematic ways to minimise distortion.
- You can prevent loss of data by having an organisation system that is routinely backed up.
Finally, you can implement your chosen methods to measure or observe the variables you are interested in.
The closed-ended questions ask participants to rate their manager’s leadership skills on scales from 1 to 5. The data produced is numerical and can be statistically analysed for averages and patterns.
To ensure that high-quality data is recorded in a systematic way, here are some best practices:
- Record all relevant information as and when you obtain data. For example, note down whether or how lab equipment is recalibrated during an experimental study.
- Double-check manual data entry for errors.
- If you collect quantitative data, you can assess the reliability and validity to get an indication of your data quality.
Data collection is the systematic process by which observations or measurements are gathered in research. It is used in many different contexts by academics, governments, businesses, and other organisations.
When conducting research, collecting original data has significant advantages:
- You can tailor data collection to your specific research aims (e.g., understanding the needs of your consumers or user testing your website).
- You can control and standardise the process for high reliability and validity (e.g., choosing appropriate measurements and sampling methods ).
However, there are also some drawbacks: data collection can be time-consuming, labour-intensive, and expensive. In some cases, it’s more efficient to use secondary data that has already been collected by someone else, but the data might be less reliable.
Quantitative research deals with numbers and statistics, while qualitative research deals with words and meanings.
Quantitative methods allow you to test a hypothesis by systematically collecting and analysing data, while qualitative methods allow you to explore ideas and experiences in depth.
Reliability and validity are both about how well a method measures something:
- Reliability refers to the consistency of a measure (whether the results can be reproduced under the same conditions).
- Validity refers to the accuracy of a measure (whether the results really do represent what they are supposed to measure).
If you are doing experimental research , you also have to consider the internal and external validity of your experiment.
In mixed methods research , you use both qualitative and quantitative data collection and analysis methods to answer your research question .
Operationalisation means turning abstract conceptual ideas into measurable observations.
For example, the concept of social anxiety isn’t directly observable, but it can be operationally defined in terms of self-rating scores, behavioural avoidance of crowded places, or physical anxiety symptoms in social situations.
Before collecting data , it’s important to consider how you will operationalise the variables that you want to measure.
Cite this Scribbr article
If you want to cite this source, you can copy and paste the citation or click the ‘Cite this Scribbr article’ button to automatically add the citation to our free Reference Generator.
Bhandari, P. (2022, May 04). Data Collection Methods | Step-by-Step Guide & Examples. Scribbr. Retrieved 3 June 2024, from https://www.scribbr.co.uk/research-methods/data-collection-guide/
Is this article helpful?

Pritha Bhandari
Other students also liked, qualitative vs quantitative research | examples & methods, triangulation in research | guide, types, examples, what is a conceptual framework | tips & examples.
- 7 Data Collection Methods & Tools For Research

- Data Collection
The underlying need for Data collection is to capture quality evidence that seeks to answer all the questions that have been posed. Through data collection businesses or management can deduce quality information that is a prerequisite for making informed decisions.
To improve the quality of information, it is expedient that data is collected so that you can draw inferences and make informed decisions on what is considered factual.
At the end of this article, you would understand why picking the best data collection method is necessary for achieving your set objective.
Sign up on Formplus Builder to create your preferred online surveys or questionnaire for data collection. You don’t need to be tech-savvy! Start creating quality questionnaires with Formplus.
What is Data Collection?
Data collection is a methodical process of gathering and analyzing specific information to proffer solutions to relevant questions and evaluate the results. It focuses on finding out all there is to a particular subject matter. Data is collected to be further subjected to hypothesis testing which seeks to explain a phenomenon.
Hypothesis testing eliminates assumptions while making a proposition from the basis of reason.

For collectors of data, there is a range of outcomes for which the data is collected. But the key purpose for which data is collected is to put a researcher in a vantage position to make predictions about future probabilities and trends.
The core forms in which data can be collected are primary and secondary data. While the former is collected by a researcher through first-hand sources, the latter is collected by an individual other than the user.
Types of Data Collection
Before broaching the subject of the various types of data collection. It is pertinent to note that data collection in itself falls under two broad categories; Primary data collection and secondary data collection.
Primary Data Collection
Primary data collection by definition is the gathering of raw data collected at the source. It is a process of collecting the original data collected by a researcher for a specific research purpose. It could be further analyzed into two segments; qualitative research and quantitative data collection methods.
- Qualitative Research Method
The qualitative research methods of data collection do not involve the collection of data that involves numbers or a need to be deduced through a mathematical calculation, rather it is based on the non-quantifiable elements like the feeling or emotion of the researcher. An example of such a method is an open-ended questionnaire.

- Quantitative Method
Quantitative methods are presented in numbers and require a mathematical calculation to deduce. An example would be the use of a questionnaire with close-ended questions to arrive at figures to be calculated Mathematically. Also, methods of correlation and regression, mean, mode and median.

Read Also: 15 Reasons to Choose Quantitative over Qualitative Research
Secondary Data Collection
Secondary data collection, on the other hand, is referred to as the gathering of second-hand data collected by an individual who is not the original user. It is the process of collecting data that is already existing, be it already published books, journals, and/or online portals. In terms of ease, it is much less expensive and easier to collect.
Your choice between Primary data collection and secondary data collection depends on the nature, scope, and area of your research as well as its aims and objectives.
Importance of Data Collection
There are a bunch of underlying reasons for collecting data, especially for a researcher. Walking you through them, here are a few reasons;
- Integrity of the Research
A key reason for collecting data, be it through quantitative or qualitative methods is to ensure that the integrity of the research question is indeed maintained.
- Reduce the likelihood of errors
The correct use of appropriate data collection of methods reduces the likelihood of errors consistent with the results.
- Decision Making
To minimize the risk of errors in decision-making, it is important that accurate data is collected so that the researcher doesn’t make uninformed decisions.
- Save Cost and Time
Data collection saves the researcher time and funds that would otherwise be misspent without a deeper understanding of the topic or subject matter.
- To support a need for a new idea, change, and/or innovation
To prove the need for a change in the norm or the introduction of new information that will be widely accepted, it is important to collect data as evidence to support these claims.
What is a Data Collection Tool?
Data collection tools refer to the devices/instruments used to collect data, such as a paper questionnaire or computer-assisted interviewing system. Case Studies, Checklists, Interviews, Observation sometimes, and Surveys or Questionnaires are all tools used to collect data.
It is important to decide on the tools for data collection because research is carried out in different ways and for different purposes. The objective behind data collection is to capture quality evidence that allows analysis to lead to the formulation of convincing and credible answers to the posed questions.
The objective behind data collection is to capture quality evidence that allows analysis to lead to the formulation of convincing and credible answers to the questions that have been posed – Click to Tweet
The Formplus online data collection tool is perfect for gathering primary data, i.e. raw data collected from the source. You can easily get data with at least three data collection methods with our online and offline data-gathering tool. I.e Online Questionnaires , Focus Groups, and Reporting.
In our previous articles, we’ve explained why quantitative research methods are more effective than qualitative methods . However, with the Formplus data collection tool, you can gather all types of primary data for academic, opinion or product research.
Top Data Collection Methods and Tools for Academic, Opinion, or Product Research
The following are the top 7 data collection methods for Academic, Opinion-based, or product research. Also discussed in detail are the nature, pros, and cons of each one. At the end of this segment, you will be best informed about which method best suits your research.
An interview is a face-to-face conversation between two individuals with the sole purpose of collecting relevant information to satisfy a research purpose. Interviews are of different types namely; Structured, Semi-structured , and unstructured with each having a slight variation from the other.
Use this interview consent form template to let an interviewee give you consent to use data gotten from your interviews for investigative research purposes.
- Structured Interviews – Simply put, it is a verbally administered questionnaire. In terms of depth, it is surface level and is usually completed within a short period. For speed and efficiency, it is highly recommendable, but it lacks depth.
- Semi-structured Interviews – In this method, there subsist several key questions which cover the scope of the areas to be explored. It allows a little more leeway for the researcher to explore the subject matter.
- Unstructured Interviews – It is an in-depth interview that allows the researcher to collect a wide range of information with a purpose. An advantage of this method is the freedom it gives a researcher to combine structure with flexibility even though it is more time-consuming.
- In-depth information
- Freedom of flexibility
- Accurate data.
- Time-consuming
- Expensive to collect.
What are The Best Data Collection Tools for Interviews?
For collecting data through interviews, here are a few tools you can use to easily collect data.
- Audio Recorder
An audio recorder is used for recording sound on disc, tape, or film. Audio information can meet the needs of a wide range of people, as well as provide alternatives to print data collection tools.
- Digital Camera
An advantage of a digital camera is that it can be used for transmitting those images to a monitor screen when the need arises.
A camcorder is used for collecting data through interviews. It provides a combination of both an audio recorder and a video camera. The data provided is qualitative in nature and allows the respondents to answer questions asked exhaustively. If you need to collect sensitive information during an interview, a camcorder might not work for you as you would need to maintain your subject’s privacy.
Want to conduct an interview for qualitative data research or a special report? Use this online interview consent form template to allow the interviewee to give their consent before you use the interview data for research or report. With premium features like e-signature, upload fields, form security, etc., Formplus Builder is the perfect tool to create your preferred online consent forms without coding experience.
- QUESTIONNAIRES
This is the process of collecting data through an instrument consisting of a series of questions and prompts to receive a response from the individuals it is administered to. Questionnaires are designed to collect data from a group.
For clarity, it is important to note that a questionnaire isn’t a survey, rather it forms a part of it. A survey is a process of data gathering involving a variety of data collection methods, including a questionnaire.
On a questionnaire, there are three kinds of questions used. They are; fixed-alternative, scale, and open-ended. With each of the questions tailored to the nature and scope of the research.
- Can be administered in large numbers and is cost-effective.
- It can be used to compare and contrast previous research to measure change.
- Easy to visualize and analyze.
- Questionnaires offer actionable data.
- Respondent identity is protected.
- Questionnaires can cover all areas of a topic.
- Relatively inexpensive.
- Answers may be dishonest or the respondents lose interest midway.
- Questionnaires can’t produce qualitative data.
- Questions might be left unanswered.
- Respondents may have a hidden agenda.
- Not all questions can be analyzed easily.
What are the Best Data Collection Tools for Questionnaires?
- Formplus Online Questionnaire
Formplus lets you create powerful forms to help you collect the information you need. Formplus helps you create the online forms that you like. The Formplus online questionnaire form template to get actionable trends and measurable responses. Conduct research, optimize knowledge of your brand or just get to know an audience with this form template. The form template is fast, free and fully customizable.
- Paper Questionnaire
A paper questionnaire is a data collection tool consisting of a series of questions and/or prompts for the purpose of gathering information from respondents. Mostly designed for statistical analysis of the responses, they can also be used as a form of data collection.
By definition, data reporting is the process of gathering and submitting data to be further subjected to analysis. The key aspect of data reporting is reporting accurate data because inaccurate data reporting leads to uninformed decision-making.
- Informed decision-making.
- Easily accessible.
- Self-reported answers may be exaggerated.
- The results may be affected by bias.
- Respondents may be too shy to give out all the details.
- Inaccurate reports will lead to uninformed decisions.
What are the Best Data Collection Tools for Reporting?
Reporting tools enable you to extract and present data in charts, tables, and other visualizations so users can find useful information. You could source data for reporting from Non-Governmental Organizations (NGO) reports, newspapers, website articles, and hospital records.
- NGO Reports
Contained in NGO report is an in-depth and comprehensive report on the activities carried out by the NGO, covering areas such as business and human rights. The information contained in these reports is research-specific and forms an acceptable academic base for collecting data. NGOs often focus on development projects which are organized to promote particular causes.
Newspaper data are relatively easy to collect and are sometimes the only continuously available source of event data. Even though there is a problem of bias in newspaper data, it is still a valid tool in collecting data for Reporting.
- Website Articles
Gathering and using data contained in website articles is also another tool for data collection. Collecting data from web articles is a quicker and less expensive data collection Two major disadvantages of using this data reporting method are biases inherent in the data collection process and possible security/confidentiality concerns.
- Hospital Care records
Health care involves a diverse set of public and private data collection systems, including health surveys, administrative enrollment and billing records, and medical records, used by various entities, including hospitals, CHCs, physicians, and health plans. The data provided is clear, unbiased and accurate, but must be obtained under legal means as medical data is kept with the strictest regulations.
- EXISTING DATA
This is the introduction of new investigative questions in addition to/other than the ones originally used when the data was initially gathered. It involves adding measurement to a study or research. An example would be sourcing data from an archive.
- Accuracy is very high.
- Easily accessible information.
- Problems with evaluation.
- Difficulty in understanding.
What are the Best Data Collection Tools for Existing Data?
The concept of Existing data means that data is collected from existing sources to investigate research questions other than those for which the data were originally gathered. Tools to collect existing data include:
- Research Journals – Unlike newspapers and magazines, research journals are intended for an academic or technical audience, not general readers. A journal is a scholarly publication containing articles written by researchers, professors, and other experts.
- Surveys – A survey is a data collection tool for gathering information from a sample population, with the intention of generalizing the results to a larger population. Surveys have a variety of purposes and can be carried out in many ways depending on the objectives to be achieved.
- OBSERVATION
This is a data collection method by which information on a phenomenon is gathered through observation. The nature of the observation could be accomplished either as a complete observer, an observer as a participant, a participant as an observer, or as a complete participant. This method is a key base for formulating a hypothesis.
- Easy to administer.
- There subsists a greater accuracy with results.
- It is a universally accepted practice.
- It diffuses the situation of the unwillingness of respondents to administer a report.
- It is appropriate for certain situations.
- Some phenomena aren’t open to observation.
- It cannot be relied upon.
- Bias may arise.
- It is expensive to administer.
- Its validity cannot be predicted accurately.
What are the Best Data Collection Tools for Observation?
Observation involves the active acquisition of information from a primary source. Observation can also involve the perception and recording of data via the use of scientific instruments. The best tools for Observation are:
- Checklists – state-specific criteria, that allow users to gather information and make judgments about what they should know in relation to the outcomes. They offer systematic ways of collecting data about specific behaviors, knowledge, and skills.
- Direct observation – This is an observational study method of collecting evaluative information. The evaluator watches the subject in his or her usual environment without altering that environment.
FOCUS GROUPS
The opposite of quantitative research which involves numerical-based data, this data collection method focuses more on qualitative research. It falls under the primary category of data based on the feelings and opinions of the respondents. This research involves asking open-ended questions to a group of individuals usually ranging from 6-10 people, to provide feedback.
- Information obtained is usually very detailed.
- Cost-effective when compared to one-on-one interviews.
- It reflects speed and efficiency in the supply of results.
- Lacking depth in covering the nitty-gritty of a subject matter.
- Bias might still be evident.
- Requires interviewer training
- The researcher has very little control over the outcome.
- A few vocal voices can drown out the rest.
- Difficulty in assembling an all-inclusive group.
What are the Best Data Collection Tools for Focus Groups?
A focus group is a data collection method that is tightly facilitated and structured around a set of questions. The purpose of the meeting is to extract from the participants’ detailed responses to these questions. The best tools for tackling Focus groups are:
- Two-Way – One group watches another group answer the questions posed by the moderator. After listening to what the other group has to offer, the group that listens is able to facilitate more discussion and could potentially draw different conclusions .
- Dueling-Moderator – There are two moderators who play the devil’s advocate. The main positive of the dueling-moderator focus group is to facilitate new ideas by introducing new ways of thinking and varying viewpoints.
- COMBINATION RESEARCH
This method of data collection encompasses the use of innovative methods to enhance participation in both individuals and groups. Also under the primary category, it is a combination of Interviews and Focus Groups while collecting qualitative data . This method is key when addressing sensitive subjects.
- Encourage participants to give responses.
- It stimulates a deeper connection between participants.
- The relative anonymity of respondents increases participation.
- It improves the richness of the data collected.
- It costs the most out of all the top 7.
- It’s the most time-consuming.
What are the Best Data Collection Tools for Combination Research?
The Combination Research method involves two or more data collection methods, for instance, interviews as well as questionnaires or a combination of semi-structured telephone interviews and focus groups. The best tools for combination research are:
- Online Survey – The two tools combined here are online interviews and the use of questionnaires. This is a questionnaire that the target audience can complete over the Internet. It is timely, effective, and efficient. Especially since the data to be collected is quantitative in nature.
- Dual-Moderator – The two tools combined here are focus groups and structured questionnaires. The structured questionnaires give a direction as to where the research is headed while two moderators take charge of the proceedings. Whilst one ensures the focus group session progresses smoothly, the other makes sure that the topics in question are all covered. Dual-moderator focus groups typically result in a more productive session and essentially lead to an optimum collection of data.
Why Formplus is the Best Data Collection Tool
- Vast Options for Form Customization
With Formplus, you can create your unique survey form. With options to change themes, font color, font, font type, layout, width, and more, you can create an attractive survey form. The builder also gives you as many features as possible to choose from and you do not need to be a graphic designer to create a form.
- Extensive Analytics
Form Analytics, a feature in formplus helps you view the number of respondents, unique visits, total visits, abandonment rate, and average time spent before submission. This tool eliminates the need for a manual calculation of the received data and/or responses as well as the conversion rate for your poll.
- Embed Survey Form on Your Website
Copy the link to your form and embed it as an iframe which will automatically load as your website loads, or as a popup that opens once the respondent clicks on the link. Embed the link on your Twitter page to give instant access to your followers.
.png?resize=845%2C418&ssl=1 "methods of data collection in research project")
- Geolocation Support
The geolocation feature on Formplus lets you ascertain where individual responses are coming. It utilises Google Maps to pinpoint the longitude and latitude of the respondent, to the nearest accuracy, along with the responses.
- Multi-Select feature
This feature helps to conserve horizontal space as it allows you to put multiple options in one field. This translates to including more information on the survey form.
Read Also: 10 Reasons to Use Formplus for Online Data Collection
How to Use Formplus to collect online data in 7 simple steps.
- Register or sign up on Formplus builder : Start creating your preferred questionnaire or survey by signing up with either your Google, Facebook, or Email account.

Formplus gives you a free plan with basic features you can use to collect online data. Pricing plans with vast features starts at $20 monthly, with reasonable discounts for Education and Non-Profit Organizations.
2. Input your survey title and use the form builder choice options to start creating your surveys.
Use the choice option fields like single select, multiple select, checkbox, radio, and image choices to create your preferred multi-choice surveys online.

3. Do you want customers to rate any of your products or services delivery?
Use the rating to allow survey respondents rate your products or services. This is an ideal quantitative research method of collecting data.

4. Beautify your online questionnaire with Formplus Customisation features.

- Change the theme color
- Add your brand’s logo and image to the forms
- Change the form width and layout
- Edit the submission button if you want
- Change text font color and sizes
- Do you have already made custom CSS to beautify your questionnaire? If yes, just copy and paste it to the CSS option.
5. Edit your survey questionnaire settings for your specific needs
Choose where you choose to store your files and responses. Select a submission deadline, choose a timezone, limit respondents’ responses, enable Captcha to prevent spam, and collect location data of customers.

Set an introductory message to respondents before they begin the survey, toggle the “start button” post final submission message or redirect respondents to another page when they submit their questionnaires.
Change the Email Notifications inventory and initiate an autoresponder message to all your survey questionnaire respondents. You can also transfer your forms to other users who can become form administrators.
6. Share links to your survey questionnaire page with customers.
There’s an option to copy and share the link as “Popup” or “Embed code” The data collection tool automatically creates a QR Code for Survey Questionnaire which you can download and share as appropriate.

Congratulations if you’ve made it to this stage. You can start sharing the link to your survey questionnaire with your customers.
7. View your Responses to the Survey Questionnaire
Toggle with the presentation of your summary from the options. Whether as a single, table or cards.

8. Allow Formplus Analytics to interpret your Survey Questionnaire Data

With online form builder analytics, a business can determine;
- The number of times the survey questionnaire was filled
- The number of customers reached
- Abandonment Rate: The rate at which customers exit the form without submitting it.
- Conversion Rate: The percentage of customers who completed the online form
- Average time spent per visit
- Location of customers/respondents.
- The type of device used by the customer to complete the survey questionnaire.
7 Tips to Create The Best Surveys For Data Collections
- Define the goal of your survey – Once the goal of your survey is outlined, it will aid in deciding which questions are the top priority. A clear attainable goal would, for example, mirror a clear reason as to why something is happening. e.g. “The goal of this survey is to understand why Employees are leaving an establishment.”
- Use close-ended clearly defined questions – Avoid open-ended questions and ensure you’re not suggesting your preferred answer to the respondent. If possible offer a range of answers with choice options and ratings.
- Survey outlook should be attractive and Inviting – An attractive-looking survey encourages a higher number of recipients to respond to the survey. Check out Formplus Builder for colorful options to integrate into your survey design. You could use images and videos to keep participants glued to their screens.
- Assure Respondents about the safety of their data – You want your respondents to be assured whilst disclosing details of their personal information to you. It’s your duty to inform the respondents that the data they provide is confidential and only collected for the purpose of research.
- Ensure your survey can be completed in record time – Ideally, in a typical survey, users should be able to respond in 100 seconds. It is pertinent to note that they, the respondents, are doing you a favor. Don’t stress them. Be brief and get straight to the point.
- Do a trial survey – Preview your survey before sending out your surveys to the intended respondents. Make a trial version which you’ll send to a few individuals. Based on their responses, you can draw inferences and decide whether or not your survey is ready for the big time.
- Attach a reward upon completion for users – Give your respondents something to look forward to at the end of the survey. Think of it as a penny for their troubles. It could well be the encouragement they need to not abandon the survey midway.
Try out Formplus today . You can start making your own surveys with the Formplus online survey builder. By applying these tips, you will definitely get the most out of your online surveys.
Top Survey Templates For Data Collection
- Customer Satisfaction Survey Template
On the template, you can collect data to measure customer satisfaction over key areas like the commodity purchase and the level of service they received. It also gives insight as to which products the customer enjoyed, how often they buy such a product, and whether or not the customer is likely to recommend the product to a friend or acquaintance.
- Demographic Survey Template
With this template, you would be able to measure, with accuracy, the ratio of male to female, age range, and the number of unemployed persons in a particular country as well as obtain their personal details such as names and addresses.
Respondents are also able to state their religious and political views about the country under review.
- Feedback Form Template
Contained in the template for the online feedback form is the details of a product and/or service used. Identifying this product or service and documenting how long the customer has used them.
The overall satisfaction is measured as well as the delivery of the services. The likelihood that the customer also recommends said product is also measured.
- Online Questionnaire Template
The online questionnaire template houses the respondent’s data as well as educational qualifications to collect information to be used for academic research.
Respondents can also provide their gender, race, and field of study as well as present living conditions as prerequisite data for the research study.
- Student Data Sheet Form Template
The template is a data sheet containing all the relevant information of a student. The student’s name, home address, guardian’s name, record of attendance as well as performance in school is well represented on this template. This is a perfect data collection method to deploy for a school or an education organization.
Also included is a record for interaction with others as well as a space for a short comment on the overall performance and attitude of the student.
- Interview Consent Form Template
This online interview consent form template allows the interviewee to sign off their consent to use the interview data for research or report to journalists. With premium features like short text fields, upload, e-signature, etc., Formplus Builder is the perfect tool to create your preferred online consent forms without coding experience.
What is the Best Data Collection Method for Qualitative Data?
Answer: Combination Research
The best data collection method for a researcher for gathering qualitative data which generally is data relying on the feelings, opinions, and beliefs of the respondents would be Combination Research.
The reason why combination research is the best fit is that it encompasses the attributes of Interviews and Focus Groups. It is also useful when gathering data that is sensitive in nature. It can be described as an all-purpose quantitative data collection method.
Above all, combination research improves the richness of data collected when compared with other data collection methods for qualitative data.

What is the Best Data Collection Method for Quantitative Research Data?
Ans: Questionnaire
The best data collection method a researcher can employ in gathering quantitative data which takes into consideration data that can be represented in numbers and figures that can be deduced mathematically is the Questionnaire.
These can be administered to a large number of respondents while saving costs. For quantitative data that may be bulky or voluminous in nature, the use of a Questionnaire makes such data easy to visualize and analyze.
Another key advantage of the Questionnaire is that it can be used to compare and contrast previous research work done to measure changes.
Technology-Enabled Data Collection Methods
There are so many diverse methods available now in the world because technology has revolutionized the way data is being collected. It has provided efficient and innovative methods that anyone, especially researchers and organizations. Below are some technology-enabled data collection methods:
- Online Surveys: Online surveys have gained popularity due to their ease of use and wide reach. You can distribute them through email, social media, or embed them on websites. Online surveys allow you to quickly complete data collection, automated data capture, and real-time analysis. Online surveys also offer features like skip logic, validation checks, and multimedia integration.
- Mobile Surveys: With the widespread use of smartphones, mobile surveys’ popularity is also on the rise. Mobile surveys leverage the capabilities of mobile devices, and this allows respondents to participate at their convenience. This includes multimedia elements, location-based information, and real-time feedback. Mobile surveys are the best for capturing in-the-moment experiences or opinions.
- Social Media Listening: Social media platforms are a good source of unstructured data that you can analyze to gain insights into customer sentiment and trends. Social media listening involves monitoring and analyzing social media conversations, mentions, and hashtags to understand public opinion, identify emerging topics, and assess brand reputation.
- Wearable Devices and Sensors: You can embed wearable devices, such as fitness trackers or smartwatches, and sensors in everyday objects to capture continuous data on various physiological and environmental variables. This data can provide you with insights into health behaviors, activity patterns, sleep quality, and environmental conditions, among others.
- Big Data Analytics: Big data analytics leverages large volumes of structured and unstructured data from various sources, such as transaction records, social media, and internet browsing. Advanced analytics techniques, like machine learning and natural language processing, can extract meaningful insights and patterns from this data, enabling organizations to make data-driven decisions.
Read Also: How Technology is Revolutionizing Data Collection
Faulty Data Collection Practices – Common Mistakes & Sources of Error
While technology-enabled data collection methods offer numerous advantages, there are some pitfalls and sources of error that you should be aware of. Here are some common mistakes and sources of error in data collection:
- Population Specification Error: Population specification error occurs when the target population is not clearly defined or misidentified. This error leads to a mismatch between the research objectives and the actual population being studied, resulting in biased or inaccurate findings.
- Sample Frame Error: Sample frame error occurs when the sampling frame, the list or source from which the sample is drawn, does not adequately represent the target population. This error can introduce selection bias and affect the generalizability of the findings.
- Selection Error: Selection error occurs when the process of selecting participants or units for the study introduces bias. It can happen due to nonrandom sampling methods, inadequate sampling techniques, or self-selection bias. Selection error compromises the representativeness of the sample and affects the validity of the results.
- Nonresponse Error: Nonresponse error occurs when selected participants choose not to participate or fail to respond to the data collection effort. Nonresponse bias can result in an unrepresentative sample if those who choose not to respond differ systematically from those who do respond. Efforts should be made to mitigate nonresponse and encourage participation to minimize this error.
- Measurement Error: Measurement error arises from inaccuracies or inconsistencies in the measurement process. It can happen due to poorly designed survey instruments, ambiguous questions, respondent bias, or errors in data entry or coding. Measurement errors can lead to distorted or unreliable data, affecting the validity and reliability of the findings.
In order to mitigate these errors and ensure high-quality data collection, you should carefully plan your data collection procedures, and validate measurement tools. You should also use appropriate sampling techniques, employ randomization where possible, and minimize nonresponse through effective communication and incentives. Ensure you conduct regular checks and implement validation processes, and data cleaning procedures to identify and rectify errors during data analysis.
Best Practices for Data Collection
- Clearly Define Objectives: Clearly define the research objectives and questions to guide the data collection process. This helps ensure that the collected data aligns with the research goals and provides relevant insights.
- Plan Ahead: Develop a detailed data collection plan that includes the timeline, resources needed, and specific procedures to follow. This helps maintain consistency and efficiency throughout the data collection process.
- Choose the Right Method: Select data collection methods that are appropriate for the research objectives and target population. Consider factors such as feasibility, cost-effectiveness, and the ability to capture the required data accurately.
- Pilot Test : Before full-scale data collection, conduct a pilot test to identify any issues with the data collection instruments or procedures. This allows for refinement and improvement before data collection with the actual sample.
- Train Data Collectors: If data collection involves human interaction, ensure that data collectors are properly trained on the data collection protocols, instruments, and ethical considerations. Consistent training helps minimize errors and maintain data quality.
- Maintain Consistency: Follow standardized procedures throughout the data collection process to ensure consistency across data collectors and time. This includes using consistent measurement scales, instructions, and data recording methods.
- Minimize Bias: Be aware of potential sources of bias in data collection and take steps to minimize their impact. Use randomization techniques, employ diverse data collectors, and implement strategies to mitigate response biases.
- Ensure Data Quality: Implement quality control measures to ensure the accuracy, completeness, and reliability of the collected data. Conduct regular checks for data entry errors, inconsistencies, and missing values.
- Maintain Data Confidentiality: Protect the privacy and confidentiality of participants’ data by implementing appropriate security measures. Ensure compliance with data protection regulations and obtain informed consent from participants.
- Document the Process: Keep detailed documentation of the data collection process, including any deviations from the original plan, challenges encountered, and decisions made. This documentation facilitates transparency, replicability, and future analysis.
FAQs about Data Collection
- What are secondary sources of data collection? Secondary sources of data collection are defined as the data that has been previously gathered and is available for your use as a researcher. These sources can include published research papers, government reports, statistical databases, and other existing datasets.
- What are the primary sources of data collection? Primary sources of data collection involve collecting data directly from the original source also known as the firsthand sources. You can do this through surveys, interviews, observations, experiments, or other direct interactions with individuals or subjects of study.
- How many types of data are there? There are two main types of data: qualitative and quantitative. Qualitative data is non-numeric and it includes information in the form of words, images, or descriptions. Quantitative data, on the other hand, is numeric and you can measure and analyze it statistically.
Sign up on Formplus Builder to create your preferred online surveys or questionnaire for data collection. You don’t need to be tech-savvy!
Connect to Formplus, Get Started Now - It's Free!
- academic research
- Data collection method
- data collection techniques
- data collection tool
- data collection tools
- field data collection
- online data collection tool
- product research
- qualitative research data
- quantitative research data
- scientific research
- busayo.longe
You may also like:
Data Collection Sheet: Types + [Template Examples]
Simple guide on data collection sheet. Types, tools, and template examples.
Data Collection Plan: Definition + Steps to Do It
Introduction A data collection plan is a way to get specific information on your audience. You can use it to better understand what they...
User Research: Definition, Methods, Tools and Guide
In this article, you’ll learn to provide value to your target market with user research. As a bonus, we’ve added user research tools and...
How Technology is Revolutionizing Data Collection
As global industrialization continues to transform, it is becoming evident that there is a ubiquity of large datasets driven by the need...
Formplus - For Seamless Data Collection
Collect data the right way with a versatile data collection tool. try formplus and transform your work productivity today..
Table of Contents
What is data collection, why do we need data collection, what are the different data collection methods, data collection tools, the importance of ensuring accurate and appropriate data collection, issues related to maintaining the integrity of data collection, what are common challenges in data collection, what are the key steps in the data collection process, data collection considerations and best practices, choose the right data science program, are you interested in a career in data science, what is data collection: methods, types, tools.

The process of gathering and analyzing accurate data from various sources to find answers to research problems, trends and probabilities, etc., to evaluate possible outcomes is Known as Data Collection. Knowledge is power, information is knowledge, and data is information in digitized form, at least as defined in IT. Hence, data is power. But before you can leverage that data into a successful strategy for your organization or business, you need to gather it. That’s your first step.
So, to help you get the process started, we shine a spotlight on data collection. What exactly is it? Believe it or not, it’s more than just doing a Google search! Furthermore, what are the different types of data collection? And what kinds of data collection tools and data collection techniques exist?
If you want to get up to speed about what is data collection process, you’ve come to the right place.
Transform raw data into captivating visuals with Simplilearn's hands-on Data Visualization Courses and captivate your audience. Also, master the art of data management with Simplilearn's comprehensive data management courses - unlock new career opportunities today!
Data collection is the process of collecting and evaluating information or data from multiple sources to find answers to research problems, answer questions, evaluate outcomes, and forecast trends and probabilities. It is an essential phase in all types of research, analysis, and decision-making, including that done in the social sciences, business, and healthcare.
Accurate data collection is necessary to make informed business decisions, ensure quality assurance, and keep research integrity.
During data collection, the researchers must identify the data types, the sources of data, and what methods are being used. We will soon see that there are many different data collection methods . There is heavy reliance on data collection in research, commercial, and government fields.
Before an analyst begins collecting data, they must answer three questions first:
- What’s the goal or purpose of this research?
- What kinds of data are they planning on gathering?
- What methods and procedures will be used to collect, store, and process the information?
Additionally, we can break up data into qualitative and quantitative types. Qualitative data covers descriptions such as color, size, quality, and appearance. Quantitative data, unsurprisingly, deals with numbers, such as statistics, poll numbers, percentages, etc.
Before a judge makes a ruling in a court case or a general creates a plan of attack, they must have as many relevant facts as possible. The best courses of action come from informed decisions, and information and data are synonymous.
The concept of data collection isn’t a new one, as we’ll see later, but the world has changed. There is far more data available today, and it exists in forms that were unheard of a century ago. The data collection process has had to change and grow with the times, keeping pace with technology.
Whether you’re in the world of academia, trying to conduct research, or part of the commercial sector, thinking of how to promote a new product, you need data collection to help you make better choices.
Now that you know what is data collection and why we need it, let's take a look at the different methods of data collection. While the phrase “data collection” may sound all high-tech and digital, it doesn’t necessarily entail things like computers, big data , and the internet. Data collection could mean a telephone survey, a mail-in comment card, or even some guy with a clipboard asking passersby some questions. But let’s see if we can sort the different data collection methods into a semblance of organized categories.
Primary and secondary methods of data collection are two approaches used to gather information for research or analysis purposes. Let's explore each data collection method in detail:
1. Primary Data Collection:
Primary data collection involves the collection of original data directly from the source or through direct interaction with the respondents. This method allows researchers to obtain firsthand information specifically tailored to their research objectives. There are various techniques for primary data collection, including:
a. Surveys and Questionnaires: Researchers design structured questionnaires or surveys to collect data from individuals or groups. These can be conducted through face-to-face interviews, telephone calls, mail, or online platforms.
b. Interviews: Interviews involve direct interaction between the researcher and the respondent. They can be conducted in person, over the phone, or through video conferencing. Interviews can be structured (with predefined questions), semi-structured (allowing flexibility), or unstructured (more conversational).
c. Observations: Researchers observe and record behaviors, actions, or events in their natural setting. This method is useful for gathering data on human behavior, interactions, or phenomena without direct intervention.
d. Experiments: Experimental studies involve the manipulation of variables to observe their impact on the outcome. Researchers control the conditions and collect data to draw conclusions about cause-and-effect relationships.
e. Focus Groups: Focus groups bring together a small group of individuals who discuss specific topics in a moderated setting. This method helps in understanding opinions, perceptions, and experiences shared by the participants.
2. Secondary Data Collection:
Secondary data collection involves using existing data collected by someone else for a purpose different from the original intent. Researchers analyze and interpret this data to extract relevant information. Secondary data can be obtained from various sources, including:
a. Published Sources: Researchers refer to books, academic journals, magazines, newspapers, government reports, and other published materials that contain relevant data.
b. Online Databases: Numerous online databases provide access to a wide range of secondary data, such as research articles, statistical information, economic data, and social surveys.
c. Government and Institutional Records: Government agencies, research institutions, and organizations often maintain databases or records that can be used for research purposes.
d. Publicly Available Data: Data shared by individuals, organizations, or communities on public platforms, websites, or social media can be accessed and utilized for research.
e. Past Research Studies: Previous research studies and their findings can serve as valuable secondary data sources. Researchers can review and analyze the data to gain insights or build upon existing knowledge.
Now that we’ve explained the various techniques, let’s narrow our focus even further by looking at some specific tools. For example, we mentioned interviews as a technique, but we can further break that down into different interview types (or “tools”).
Word Association
The researcher gives the respondent a set of words and asks them what comes to mind when they hear each word.
Sentence Completion
Researchers use sentence completion to understand what kind of ideas the respondent has. This tool involves giving an incomplete sentence and seeing how the interviewee finishes it.
Role-Playing
Respondents are presented with an imaginary situation and asked how they would act or react if it was real.
In-Person Surveys
The researcher asks questions in person.
Online/Web Surveys
These surveys are easy to accomplish, but some users may be unwilling to answer truthfully, if at all.
Mobile Surveys
These surveys take advantage of the increasing proliferation of mobile technology. Mobile collection surveys rely on mobile devices like tablets or smartphones to conduct surveys via SMS or mobile apps.
Phone Surveys
No researcher can call thousands of people at once, so they need a third party to handle the chore. However, many people have call screening and won’t answer.
Observation
Sometimes, the simplest method is the best. Researchers who make direct observations collect data quickly and easily, with little intrusion or third-party bias. Naturally, it’s only effective in small-scale situations.
Accurate data collecting is crucial to preserving the integrity of research, regardless of the subject of study or preferred method for defining data (quantitative, qualitative). Errors are less likely to occur when the right data gathering tools are used (whether they are brand-new ones, updated versions of them, or already available).
Among the effects of data collection done incorrectly, include the following -
- Erroneous conclusions that squander resources
- Decisions that compromise public policy
- Incapacity to correctly respond to research inquiries
- Bringing harm to participants who are humans or animals
- Deceiving other researchers into pursuing futile research avenues
- The study's inability to be replicated and validated
When these study findings are used to support recommendations for public policy, there is the potential to result in disproportionate harm, even if the degree of influence from flawed data collecting may vary by discipline and the type of investigation.
Let us now look at the various issues that we might face while maintaining the integrity of data collection.
In order to assist the errors detection process in the data gathering process, whether they were done purposefully (deliberate falsifications) or not, maintaining data integrity is the main justification (systematic or random errors).
Quality assurance and quality control are two strategies that help protect data integrity and guarantee the scientific validity of study results.
Each strategy is used at various stages of the research timeline:
- Quality control - tasks that are performed both after and during data collecting
- Quality assurance - events that happen before data gathering starts
Let us explore each of them in more detail now.
Quality Assurance
As data collecting comes before quality assurance, its primary goal is "prevention" (i.e., forestalling problems with data collection). The best way to protect the accuracy of data collection is through prevention. The uniformity of protocol created in the thorough and exhaustive procedures manual for data collecting serves as the best example of this proactive step.
The likelihood of failing to spot issues and mistakes early in the research attempt increases when guides are written poorly. There are several ways to show these shortcomings:
- Failure to determine the precise subjects and methods for retraining or training staff employees in data collecting
- List of goods to be collected, in part
- There isn't a system in place to track modifications to processes that may occur as the investigation continues.
- Instead of detailed, step-by-step instructions on how to deliver tests, there is a vague description of the data gathering tools that will be employed.
- Uncertainty regarding the date, procedure, and identity of the person or people in charge of examining the data
- Incomprehensible guidelines for using, adjusting, and calibrating the data collection equipment.
Now, let us look at how to ensure Quality Control.
Become a Data Scientist With Real-World Experience
Quality Control
Despite the fact that quality control actions (detection/monitoring and intervention) take place both after and during data collection, the specifics should be meticulously detailed in the procedures manual. Establishing monitoring systems requires a specific communication structure, which is a prerequisite. Following the discovery of data collection problems, there should be no ambiguity regarding the information flow between the primary investigators and staff personnel. A poorly designed communication system promotes slack oversight and reduces opportunities for error detection.
Direct staff observation conference calls, during site visits, or frequent or routine assessments of data reports to spot discrepancies, excessive numbers, or invalid codes can all be used as forms of detection or monitoring. Site visits might not be appropriate for all disciplines. Still, without routine auditing of records, whether qualitative or quantitative, it will be challenging for investigators to confirm that data gathering is taking place in accordance with the manual's defined methods. Additionally, quality control determines the appropriate solutions, or "actions," to fix flawed data gathering procedures and reduce recurrences.
Problems with data collection, for instance, that call for immediate action include:
- Fraud or misbehavior
- Systematic mistakes, procedure violations
- Individual data items with errors
- Issues with certain staff members or a site's performance
Researchers are trained to include one or more secondary measures that can be used to verify the quality of information being obtained from the human subject in the social and behavioral sciences where primary data collection entails using human subjects.
For instance, a researcher conducting a survey would be interested in learning more about the prevalence of risky behaviors among young adults as well as the social factors that influence these risky behaviors' propensity for and frequency. Let us now explore the common challenges with regard to data collection.
There are some prevalent challenges faced while collecting data, let us explore a few of them to understand them better and avoid them.
Data Quality Issues
The main threat to the broad and successful application of machine learning is poor data quality. Data quality must be your top priority if you want to make technologies like machine learning work for you. Let's talk about some of the most prevalent data quality problems in this blog article and how to fix them.
Inconsistent Data
When working with various data sources, it's conceivable that the same information will have discrepancies between sources. The differences could be in formats, units, or occasionally spellings. The introduction of inconsistent data might also occur during firm mergers or relocations. Inconsistencies in data have a tendency to accumulate and reduce the value of data if they are not continually resolved. Organizations that have heavily focused on data consistency do so because they only want reliable data to support their analytics.
Data Downtime
Data is the driving force behind the decisions and operations of data-driven businesses. However, there may be brief periods when their data is unreliable or not prepared. Customer complaints and subpar analytical outcomes are only two ways that this data unavailability can have a significant impact on businesses. A data engineer spends about 80% of their time updating, maintaining, and guaranteeing the integrity of the data pipeline. In order to ask the next business question, there is a high marginal cost due to the lengthy operational lead time from data capture to insight.
Schema modifications and migration problems are just two examples of the causes of data downtime. Data pipelines can be difficult due to their size and complexity. Data downtime must be continuously monitored, and it must be reduced through automation.
Ambiguous Data
Even with thorough oversight, some errors can still occur in massive databases or data lakes. For data streaming at a fast speed, the issue becomes more overwhelming. Spelling mistakes can go unnoticed, formatting difficulties can occur, and column heads might be deceptive. This unclear data might cause a number of problems for reporting and analytics.
Become a Data Science Expert & Get Your Dream Job
Duplicate Data
Streaming data, local databases, and cloud data lakes are just a few of the sources of data that modern enterprises must contend with. They might also have application and system silos. These sources are likely to duplicate and overlap each other quite a bit. For instance, duplicate contact information has a substantial impact on customer experience. If certain prospects are ignored while others are engaged repeatedly, marketing campaigns suffer. The likelihood of biased analytical outcomes increases when duplicate data are present. It can also result in ML models with biased training data.
Too Much Data
While we emphasize data-driven analytics and its advantages, a data quality problem with excessive data exists. There is a risk of getting lost in an abundance of data when searching for information pertinent to your analytical efforts. Data scientists, data analysts, and business users devote 80% of their work to finding and organizing the appropriate data. With an increase in data volume, other problems with data quality become more serious, particularly when dealing with streaming data and big files or databases.
Inaccurate Data
For highly regulated businesses like healthcare, data accuracy is crucial. Given the current experience, it is more important than ever to increase the data quality for COVID-19 and later pandemics. Inaccurate information does not provide you with a true picture of the situation and cannot be used to plan the best course of action. Personalized customer experiences and marketing strategies underperform if your customer data is inaccurate.
Data inaccuracies can be attributed to a number of things, including data degradation, human mistake, and data drift. Worldwide data decay occurs at a rate of about 3% per month, which is quite concerning. Data integrity can be compromised while being transferred between different systems, and data quality might deteriorate with time.
Hidden Data
The majority of businesses only utilize a portion of their data, with the remainder sometimes being lost in data silos or discarded in data graveyards. For instance, the customer service team might not receive client data from sales, missing an opportunity to build more precise and comprehensive customer profiles. Missing out on possibilities to develop novel products, enhance services, and streamline procedures is caused by hidden data.
Finding Relevant Data
Finding relevant data is not so easy. There are several factors that we need to consider while trying to find relevant data, which include -
- Relevant Domain
- Relevant demographics
- Relevant Time period and so many more factors that we need to consider while trying to find relevant data.
Data that is not relevant to our study in any of the factors render it obsolete and we cannot effectively proceed with its analysis. This could lead to incomplete research or analysis, re-collecting data again and again, or shutting down the study.
Deciding the Data to Collect
Determining what data to collect is one of the most important factors while collecting data and should be one of the first factors while collecting data. We must choose the subjects the data will cover, the sources we will be used to gather it, and the quantity of information we will require. Our responses to these queries will depend on our aims, or what we expect to achieve utilizing your data. As an illustration, we may choose to gather information on the categories of articles that website visitors between the ages of 20 and 50 most frequently access. We can also decide to compile data on the typical age of all the clients who made a purchase from your business over the previous month.
Not addressing this could lead to double work and collection of irrelevant data or ruining your study as a whole.
Dealing With Big Data
Big data refers to exceedingly massive data sets with more intricate and diversified structures. These traits typically result in increased challenges while storing, analyzing, and using additional methods of extracting results. Big data refers especially to data sets that are quite enormous or intricate that conventional data processing tools are insufficient. The overwhelming amount of data, both unstructured and structured, that a business faces on a daily basis.
The amount of data produced by healthcare applications, the internet, social networking sites social, sensor networks, and many other businesses are rapidly growing as a result of recent technological advancements. Big data refers to the vast volume of data created from numerous sources in a variety of formats at extremely fast rates. Dealing with this kind of data is one of the many challenges of Data Collection and is a crucial step toward collecting effective data.
Low Response and Other Research Issues
Poor design and low response rates were shown to be two issues with data collecting, particularly in health surveys that used questionnaires. This might lead to an insufficient or inadequate supply of data for the study. Creating an incentivized data collection program might be beneficial in this case to get more responses.
Now, let us look at the key steps in the data collection process.
In the Data Collection Process, there are 5 key steps. They are explained briefly below -
1. Decide What Data You Want to Gather
The first thing that we need to do is decide what information we want to gather. We must choose the subjects the data will cover, the sources we will use to gather it, and the quantity of information that we would require. For instance, we may choose to gather information on the categories of products that an average e-commerce website visitor between the ages of 30 and 45 most frequently searches for.
2. Establish a Deadline for Data Collection
The process of creating a strategy for data collection can now begin. We should set a deadline for our data collection at the outset of our planning phase. Some forms of data we might want to continuously collect. We might want to build up a technique for tracking transactional data and website visitor statistics over the long term, for instance. However, we will track the data throughout a certain time frame if we are tracking it for a particular campaign. In these situations, we will have a schedule for when we will begin and finish gathering data.
3. Select a Data Collection Approach
We will select the data collection technique that will serve as the foundation of our data gathering plan at this stage. We must take into account the type of information that we wish to gather, the time period during which we will receive it, and the other factors we decide on to choose the best gathering strategy.
4. Gather Information
Once our plan is complete, we can put our data collection plan into action and begin gathering data. In our DMP, we can store and arrange our data. We need to be careful to follow our plan and keep an eye on how it's doing. Especially if we are collecting data regularly, setting up a timetable for when we will be checking in on how our data gathering is going may be helpful. As circumstances alter and we learn new details, we might need to amend our plan.
5. Examine the Information and Apply Your Findings
It's time to examine our data and arrange our findings after we have gathered all of our information. The analysis stage is essential because it transforms unprocessed data into insightful knowledge that can be applied to better our marketing plans, goods, and business judgments. The analytics tools included in our DMP can be used to assist with this phase. We can put the discoveries to use to enhance our business once we have discovered the patterns and insights in our data.
Let us now look at some data collection considerations and best practices that one might follow.
We must carefully plan before spending time and money traveling to the field to gather data. While saving time and resources, effective data collection strategies can help us collect richer, more accurate, and richer data.
Below, we will be discussing some of the best practices that we can follow for the best results -
1. Take Into Account the Price of Each Extra Data Point
Once we have decided on the data we want to gather, we need to make sure to take the expense of doing so into account. Our surveyors and respondents will incur additional costs for each additional data point or survey question.
2. Plan How to Gather Each Data Piece
There is a dearth of freely accessible data. Sometimes the data is there, but we may not have access to it. For instance, unless we have a compelling cause, we cannot openly view another person's medical information. It could be challenging to measure several types of information.
Consider how time-consuming and difficult it will be to gather each piece of information while deciding what data to acquire.
3. Think About Your Choices for Data Collecting Using Mobile Devices
Mobile-based data collecting can be divided into three categories -
- IVRS (interactive voice response technology) - Will call the respondents and ask them questions that have already been recorded.
- SMS data collection - Will send a text message to the respondent, who can then respond to questions by text on their phone.
- Field surveyors - Can directly enter data into an interactive questionnaire while speaking to each respondent, thanks to smartphone apps.
We need to make sure to select the appropriate tool for our survey and responders because each one has its own disadvantages and advantages.
4. Carefully Consider the Data You Need to Gather
It's all too easy to get information about anything and everything, but it's crucial to only gather the information that we require.
It is helpful to consider these 3 questions:
- What details will be helpful?
- What details are available?
- What specific details do you require?
5. Remember to Consider Identifiers
Identifiers, or details describing the context and source of a survey response, are just as crucial as the information about the subject or program that we are actually researching.
In general, adding more identifiers will enable us to pinpoint our program's successes and failures with greater accuracy, but moderation is the key.
6. Data Collecting Through Mobile Devices is the Way to Go
Although collecting data on paper is still common, modern technology relies heavily on mobile devices. They enable us to gather many various types of data at relatively lower prices and are accurate as well as quick. There aren't many reasons not to pick mobile-based data collecting with the boom of low-cost Android devices that are available nowadays.
The Ultimate Ticket to Top Data Science Job Roles
1. What is data collection with example?
Data collection is the process of collecting and analyzing information on relevant variables in a predetermined, methodical way so that one can respond to specific research questions, test hypotheses, and assess results. Data collection can be either qualitative or quantitative. Example: A company collects customer feedback through online surveys and social media monitoring to improve their products and services.
2. What are the primary data collection methods?
As is well known, gathering primary data is costly and time intensive. The main techniques for gathering data are observation, interviews, questionnaires, schedules, and surveys.
3. What are data collection tools?
The term "data collecting tools" refers to the tools/devices used to gather data, such as a paper questionnaire or a system for computer-assisted interviews. Tools used to gather data include case studies, checklists, interviews, occasionally observation, surveys, and questionnaires.
4. What’s the difference between quantitative and qualitative methods?
While qualitative research focuses on words and meanings, quantitative research deals with figures and statistics. You can systematically measure variables and test hypotheses using quantitative methods. You can delve deeper into ideas and experiences using qualitative methodologies.
5. What are quantitative data collection methods?
While there are numerous other ways to get quantitative information, the methods indicated above—probability sampling, interviews, questionnaire observation, and document review—are the most typical and frequently employed, whether collecting information offline or online.
6. What is mixed methods research?
User research that includes both qualitative and quantitative techniques is known as mixed methods research. For deeper user insights, mixed methods research combines insightful user data with useful statistics.
7. What are the benefits of collecting data?
Collecting data offers several benefits, including:
- Knowledge and Insight
- Evidence-Based Decision Making
- Problem Identification and Solution
- Validation and Evaluation
- Identifying Trends and Predictions
- Support for Research and Development
- Policy Development
- Quality Improvement
- Personalization and Targeting
- Knowledge Sharing and Collaboration
8. What’s the difference between reliability and validity?
Reliability is about consistency and stability, while validity is about accuracy and appropriateness. Reliability focuses on the consistency of results, while validity focuses on whether the results are actually measuring what they are intended to measure. Both reliability and validity are crucial considerations in research to ensure the trustworthiness and meaningfulness of the collected data and measurements.
Are you thinking about pursuing a career in the field of data science? Simplilearn's Data Science courses are designed to provide you with the necessary skills and expertise to excel in this rapidly changing field. Here's a detailed comparison for your reference:
Program Name Data Scientist Master's Program Post Graduate Program In Data Science Post Graduate Program In Data Science Geo All Geos All Geos Not Applicable in US University Simplilearn Purdue Caltech Course Duration 11 Months 11 Months 11 Months Coding Experience Required Basic Basic No Skills You Will Learn 10+ skills including data structure, data manipulation, NumPy, Scikit-Learn, Tableau and more 8+ skills including Exploratory Data Analysis, Descriptive Statistics, Inferential Statistics, and more 8+ skills including Supervised & Unsupervised Learning Deep Learning Data Visualization, and more Additional Benefits Applied Learning via Capstone and 25+ Data Science Projects Purdue Alumni Association Membership Free IIMJobs Pro-Membership of 6 months Resume Building Assistance Upto 14 CEU Credits Caltech CTME Circle Membership Cost $$ $$$$ $$$$ Explore Program Explore Program Explore Program
We live in the Data Age, and if you want a career that fully takes advantage of this, you should consider a career in data science. Simplilearn offers a Caltech Post Graduate Program in Data Science that will train you in everything you need to know to secure the perfect position. This Data Science PG program is ideal for all working professionals, covering job-critical topics like R, Python programming , machine learning algorithms , NLP concepts , and data visualization with Tableau in great detail. This is all provided via our interactive learning model with live sessions by global practitioners, practical labs, and industry projects.
Data Science & Business Analytics Courses Duration and Fees
Data Science & Business Analytics programs typically range from a few weeks to several months, with fees varying based on program and institution.
Recommended Reads
Data Science Career Guide: A Comprehensive Playbook To Becoming A Data Scientist
Difference Between Collection and Collections in Java
An Ultimate One-Stop Solution Guide to Collections in C# Programming With Examples
Managing Data
Capped Collection in MongoDB
What Are Java Collections and How to Implement Them?
Get Affiliated Certifications with Live Class programs
Data scientist.
- Industry-recognized Data Scientist Master’s certificate from Simplilearn
- Dedicated live sessions by faculty of industry experts
Caltech Data Sciences-Bootcamp
- Exclusive visit to Caltech’s Robotics Lab
Caltech Post Graduate Program in Data Science
- Earn a program completion certificate from Caltech CTME
- Curriculum delivered in live online sessions by industry experts
- PMP, PMI, PMBOK, CAPM, PgMP, PfMP, ACP, PBA, RMP, SP, and OPM3 are registered marks of the Project Management Institute, Inc.

An official website of the United States government
The .gov means it’s official. Federal government websites often end in .gov or .mil. Before sharing sensitive information, make sure you’re on a federal government site.
The site is secure. The https:// ensures that you are connecting to the official website and that any information you provide is encrypted and transmitted securely.
- Publications
- Account settings
Preview improvements coming to the PMC website in October 2024. Learn More or Try it out now .
- Advanced Search
- Journal List
- Can J Hosp Pharm
- v.68(3); May-Jun 2015
Qualitative Research: Data Collection, Analysis, and Management
Introduction.
In an earlier paper, 1 we presented an introduction to using qualitative research methods in pharmacy practice. In this article, we review some principles of the collection, analysis, and management of qualitative data to help pharmacists interested in doing research in their practice to continue their learning in this area. Qualitative research can help researchers to access the thoughts and feelings of research participants, which can enable development of an understanding of the meaning that people ascribe to their experiences. Whereas quantitative research methods can be used to determine how many people undertake particular behaviours, qualitative methods can help researchers to understand how and why such behaviours take place. Within the context of pharmacy practice research, qualitative approaches have been used to examine a diverse array of topics, including the perceptions of key stakeholders regarding prescribing by pharmacists and the postgraduation employment experiences of young pharmacists (see “Further Reading” section at the end of this article).
In the previous paper, 1 we outlined 3 commonly used methodologies: ethnography 2 , grounded theory 3 , and phenomenology. 4 Briefly, ethnography involves researchers using direct observation to study participants in their “real life” environment, sometimes over extended periods. Grounded theory and its later modified versions (e.g., Strauss and Corbin 5 ) use face-to-face interviews and interactions such as focus groups to explore a particular research phenomenon and may help in clarifying a less-well-understood problem, situation, or context. Phenomenology shares some features with grounded theory (such as an exploration of participants’ behaviour) and uses similar techniques to collect data, but it focuses on understanding how human beings experience their world. It gives researchers the opportunity to put themselves in another person’s shoes and to understand the subjective experiences of participants. 6 Some researchers use qualitative methodologies but adopt a different standpoint, and an example of this appears in the work of Thurston and others, 7 discussed later in this paper.
Qualitative work requires reflection on the part of researchers, both before and during the research process, as a way of providing context and understanding for readers. When being reflexive, researchers should not try to simply ignore or avoid their own biases (as this would likely be impossible); instead, reflexivity requires researchers to reflect upon and clearly articulate their position and subjectivities (world view, perspectives, biases), so that readers can better understand the filters through which questions were asked, data were gathered and analyzed, and findings were reported. From this perspective, bias and subjectivity are not inherently negative but they are unavoidable; as a result, it is best that they be articulated up-front in a manner that is clear and coherent for readers.
THE PARTICIPANT’S VIEWPOINT
What qualitative study seeks to convey is why people have thoughts and feelings that might affect the way they behave. Such study may occur in any number of contexts, but here, we focus on pharmacy practice and the way people behave with regard to medicines use (e.g., to understand patients’ reasons for nonadherence with medication therapy or to explore physicians’ resistance to pharmacists’ clinical suggestions). As we suggested in our earlier article, 1 an important point about qualitative research is that there is no attempt to generalize the findings to a wider population. Qualitative research is used to gain insights into people’s feelings and thoughts, which may provide the basis for a future stand-alone qualitative study or may help researchers to map out survey instruments for use in a quantitative study. It is also possible to use different types of research in the same study, an approach known as “mixed methods” research, and further reading on this topic may be found at the end of this paper.
The role of the researcher in qualitative research is to attempt to access the thoughts and feelings of study participants. This is not an easy task, as it involves asking people to talk about things that may be very personal to them. Sometimes the experiences being explored are fresh in the participant’s mind, whereas on other occasions reliving past experiences may be difficult. However the data are being collected, a primary responsibility of the researcher is to safeguard participants and their data. Mechanisms for such safeguarding must be clearly articulated to participants and must be approved by a relevant research ethics review board before the research begins. Researchers and practitioners new to qualitative research should seek advice from an experienced qualitative researcher before embarking on their project.
DATA COLLECTION
Whatever philosophical standpoint the researcher is taking and whatever the data collection method (e.g., focus group, one-to-one interviews), the process will involve the generation of large amounts of data. In addition to the variety of study methodologies available, there are also different ways of making a record of what is said and done during an interview or focus group, such as taking handwritten notes or video-recording. If the researcher is audio- or video-recording data collection, then the recordings must be transcribed verbatim before data analysis can begin. As a rough guide, it can take an experienced researcher/transcriber 8 hours to transcribe one 45-minute audio-recorded interview, a process than will generate 20–30 pages of written dialogue.
Many researchers will also maintain a folder of “field notes” to complement audio-taped interviews. Field notes allow the researcher to maintain and comment upon impressions, environmental contexts, behaviours, and nonverbal cues that may not be adequately captured through the audio-recording; they are typically handwritten in a small notebook at the same time the interview takes place. Field notes can provide important context to the interpretation of audio-taped data and can help remind the researcher of situational factors that may be important during data analysis. Such notes need not be formal, but they should be maintained and secured in a similar manner to audio tapes and transcripts, as they contain sensitive information and are relevant to the research. For more information about collecting qualitative data, please see the “Further Reading” section at the end of this paper.
DATA ANALYSIS AND MANAGEMENT
If, as suggested earlier, doing qualitative research is about putting oneself in another person’s shoes and seeing the world from that person’s perspective, the most important part of data analysis and management is to be true to the participants. It is their voices that the researcher is trying to hear, so that they can be interpreted and reported on for others to read and learn from. To illustrate this point, consider the anonymized transcript excerpt presented in Appendix 1 , which is taken from a research interview conducted by one of the authors (J.S.). We refer to this excerpt throughout the remainder of this paper to illustrate how data can be managed, analyzed, and presented.
Interpretation of Data
Interpretation of the data will depend on the theoretical standpoint taken by researchers. For example, the title of the research report by Thurston and others, 7 “Discordant indigenous and provider frames explain challenges in improving access to arthritis care: a qualitative study using constructivist grounded theory,” indicates at least 2 theoretical standpoints. The first is the culture of the indigenous population of Canada and the place of this population in society, and the second is the social constructivist theory used in the constructivist grounded theory method. With regard to the first standpoint, it can be surmised that, to have decided to conduct the research, the researchers must have felt that there was anecdotal evidence of differences in access to arthritis care for patients from indigenous and non-indigenous backgrounds. With regard to the second standpoint, it can be surmised that the researchers used social constructivist theory because it assumes that behaviour is socially constructed; in other words, people do things because of the expectations of those in their personal world or in the wider society in which they live. (Please see the “Further Reading” section for resources providing more information about social constructivist theory and reflexivity.) Thus, these 2 standpoints (and there may have been others relevant to the research of Thurston and others 7 ) will have affected the way in which these researchers interpreted the experiences of the indigenous population participants and those providing their care. Another standpoint is feminist standpoint theory which, among other things, focuses on marginalized groups in society. Such theories are helpful to researchers, as they enable us to think about things from a different perspective. Being aware of the standpoints you are taking in your own research is one of the foundations of qualitative work. Without such awareness, it is easy to slip into interpreting other people’s narratives from your own viewpoint, rather than that of the participants.
To analyze the example in Appendix 1 , we will adopt a phenomenological approach because we want to understand how the participant experienced the illness and we want to try to see the experience from that person’s perspective. It is important for the researcher to reflect upon and articulate his or her starting point for such analysis; for example, in the example, the coder could reflect upon her own experience as a female of a majority ethnocultural group who has lived within middle class and upper middle class settings. This personal history therefore forms the filter through which the data will be examined. This filter does not diminish the quality or significance of the analysis, since every researcher has his or her own filters; however, by explicitly stating and acknowledging what these filters are, the researcher makes it easer for readers to contextualize the work.
Transcribing and Checking
For the purposes of this paper it is assumed that interviews or focus groups have been audio-recorded. As mentioned above, transcribing is an arduous process, even for the most experienced transcribers, but it must be done to convert the spoken word to the written word to facilitate analysis. For anyone new to conducting qualitative research, it is beneficial to transcribe at least one interview and one focus group. It is only by doing this that researchers realize how difficult the task is, and this realization affects their expectations when asking others to transcribe. If the research project has sufficient funding, then a professional transcriber can be hired to do the work. If this is the case, then it is a good idea to sit down with the transcriber, if possible, and talk through the research and what the participants were talking about. This background knowledge for the transcriber is especially important in research in which people are using jargon or medical terms (as in pharmacy practice). Involving your transcriber in this way makes the work both easier and more rewarding, as he or she will feel part of the team. Transcription editing software is also available, but it is expensive. For example, ELAN (more formally known as EUDICO Linguistic Annotator, developed at the Technical University of Berlin) 8 is a tool that can help keep data organized by linking media and data files (particularly valuable if, for example, video-taping of interviews is complemented by transcriptions). It can also be helpful in searching complex data sets. Products such as ELAN do not actually automatically transcribe interviews or complete analyses, and they do require some time and effort to learn; nonetheless, for some research applications, it may be a valuable to consider such software tools.
All audio recordings should be transcribed verbatim, regardless of how intelligible the transcript may be when it is read back. Lines of text should be numbered. Once the transcription is complete, the researcher should read it while listening to the recording and do the following: correct any spelling or other errors; anonymize the transcript so that the participant cannot be identified from anything that is said (e.g., names, places, significant events); insert notations for pauses, laughter, looks of discomfort; insert any punctuation, such as commas and full stops (periods) (see Appendix 1 for examples of inserted punctuation), and include any other contextual information that might have affected the participant (e.g., temperature or comfort of the room).
Dealing with the transcription of a focus group is slightly more difficult, as multiple voices are involved. One way of transcribing such data is to “tag” each voice (e.g., Voice A, Voice B). In addition, the focus group will usually have 2 facilitators, whose respective roles will help in making sense of the data. While one facilitator guides participants through the topic, the other can make notes about context and group dynamics. More information about group dynamics and focus groups can be found in resources listed in the “Further Reading” section.
Reading between the Lines
During the process outlined above, the researcher can begin to get a feel for the participant’s experience of the phenomenon in question and can start to think about things that could be pursued in subsequent interviews or focus groups (if appropriate). In this way, one participant’s narrative informs the next, and the researcher can continue to interview until nothing new is being heard or, as it says in the text books, “saturation is reached”. While continuing with the processes of coding and theming (described in the next 2 sections), it is important to consider not just what the person is saying but also what they are not saying. For example, is a lengthy pause an indication that the participant is finding the subject difficult, or is the person simply deciding what to say? The aim of the whole process from data collection to presentation is to tell the participants’ stories using exemplars from their own narratives, thus grounding the research findings in the participants’ lived experiences.
Smith 9 suggested a qualitative research method known as interpretative phenomenological analysis, which has 2 basic tenets: first, that it is rooted in phenomenology, attempting to understand the meaning that individuals ascribe to their lived experiences, and second, that the researcher must attempt to interpret this meaning in the context of the research. That the researcher has some knowledge and expertise in the subject of the research means that he or she can have considerable scope in interpreting the participant’s experiences. Larkin and others 10 discussed the importance of not just providing a description of what participants say. Rather, interpretative phenomenological analysis is about getting underneath what a person is saying to try to truly understand the world from his or her perspective.
Once all of the research interviews have been transcribed and checked, it is time to begin coding. Field notes compiled during an interview can be a useful complementary source of information to facilitate this process, as the gap in time between an interview, transcribing, and coding can result in memory bias regarding nonverbal or environmental context issues that may affect interpretation of data.
Coding refers to the identification of topics, issues, similarities, and differences that are revealed through the participants’ narratives and interpreted by the researcher. This process enables the researcher to begin to understand the world from each participant’s perspective. Coding can be done by hand on a hard copy of the transcript, by making notes in the margin or by highlighting and naming sections of text. More commonly, researchers use qualitative research software (e.g., NVivo, QSR International Pty Ltd; www.qsrinternational.com/products_nvivo.aspx ) to help manage their transcriptions. It is advised that researchers undertake a formal course in the use of such software or seek supervision from a researcher experienced in these tools.
Returning to Appendix 1 and reading from lines 8–11, a code for this section might be “diagnosis of mental health condition”, but this would just be a description of what the participant is talking about at that point. If we read a little more deeply, we can ask ourselves how the participant might have come to feel that the doctor assumed he or she was aware of the diagnosis or indeed that they had only just been told the diagnosis. There are a number of pauses in the narrative that might suggest the participant is finding it difficult to recall that experience. Later in the text, the participant says “nobody asked me any questions about my life” (line 19). This could be coded simply as “health care professionals’ consultation skills”, but that would not reflect how the participant must have felt never to be asked anything about his or her personal life, about the participant as a human being. At the end of this excerpt, the participant just trails off, recalling that no-one showed any interest, which makes for very moving reading. For practitioners in pharmacy, it might also be pertinent to explore the participant’s experience of akathisia and why this was left untreated for 20 years.
One of the questions that arises about qualitative research relates to the reliability of the interpretation and representation of the participants’ narratives. There are no statistical tests that can be used to check reliability and validity as there are in quantitative research. However, work by Lincoln and Guba 11 suggests that there are other ways to “establish confidence in the ‘truth’ of the findings” (p. 218). They call this confidence “trustworthiness” and suggest that there are 4 criteria of trustworthiness: credibility (confidence in the “truth” of the findings), transferability (showing that the findings have applicability in other contexts), dependability (showing that the findings are consistent and could be repeated), and confirmability (the extent to which the findings of a study are shaped by the respondents and not researcher bias, motivation, or interest).
One way of establishing the “credibility” of the coding is to ask another researcher to code the same transcript and then to discuss any similarities and differences in the 2 resulting sets of codes. This simple act can result in revisions to the codes and can help to clarify and confirm the research findings.
Theming refers to the drawing together of codes from one or more transcripts to present the findings of qualitative research in a coherent and meaningful way. For example, there may be examples across participants’ narratives of the way in which they were treated in hospital, such as “not being listened to” or “lack of interest in personal experiences” (see Appendix 1 ). These may be drawn together as a theme running through the narratives that could be named “the patient’s experience of hospital care”. The importance of going through this process is that at its conclusion, it will be possible to present the data from the interviews using quotations from the individual transcripts to illustrate the source of the researchers’ interpretations. Thus, when the findings are organized for presentation, each theme can become the heading of a section in the report or presentation. Underneath each theme will be the codes, examples from the transcripts, and the researcher’s own interpretation of what the themes mean. Implications for real life (e.g., the treatment of people with chronic mental health problems) should also be given.
DATA SYNTHESIS
In this final section of this paper, we describe some ways of drawing together or “synthesizing” research findings to represent, as faithfully as possible, the meaning that participants ascribe to their life experiences. This synthesis is the aim of the final stage of qualitative research. For most readers, the synthesis of data presented by the researcher is of crucial significance—this is usually where “the story” of the participants can be distilled, summarized, and told in a manner that is both respectful to those participants and meaningful to readers. There are a number of ways in which researchers can synthesize and present their findings, but any conclusions drawn by the researchers must be supported by direct quotations from the participants. In this way, it is made clear to the reader that the themes under discussion have emerged from the participants’ interviews and not the mind of the researcher. The work of Latif and others 12 gives an example of how qualitative research findings might be presented.
Planning and Writing the Report
As has been suggested above, if researchers code and theme their material appropriately, they will naturally find the headings for sections of their report. Qualitative researchers tend to report “findings” rather than “results”, as the latter term typically implies that the data have come from a quantitative source. The final presentation of the research will usually be in the form of a report or a paper and so should follow accepted academic guidelines. In particular, the article should begin with an introduction, including a literature review and rationale for the research. There should be a section on the chosen methodology and a brief discussion about why qualitative methodology was most appropriate for the study question and why one particular methodology (e.g., interpretative phenomenological analysis rather than grounded theory) was selected to guide the research. The method itself should then be described, including ethics approval, choice of participants, mode of recruitment, and method of data collection (e.g., semistructured interviews or focus groups), followed by the research findings, which will be the main body of the report or paper. The findings should be written as if a story is being told; as such, it is not necessary to have a lengthy discussion section at the end. This is because much of the discussion will take place around the participants’ quotes, such that all that is needed to close the report or paper is a summary, limitations of the research, and the implications that the research has for practice. As stated earlier, it is not the intention of qualitative research to allow the findings to be generalized, and therefore this is not, in itself, a limitation.
Planning out the way that findings are to be presented is helpful. It is useful to insert the headings of the sections (the themes) and then make a note of the codes that exemplify the thoughts and feelings of your participants. It is generally advisable to put in the quotations that you want to use for each theme, using each quotation only once. After all this is done, the telling of the story can begin as you give your voice to the experiences of the participants, writing around their quotations. Do not be afraid to draw assumptions from the participants’ narratives, as this is necessary to give an in-depth account of the phenomena in question. Discuss these assumptions, drawing on your participants’ words to support you as you move from one code to another and from one theme to the next. Finally, as appropriate, it is possible to include examples from literature or policy documents that add support for your findings. As an exercise, you may wish to code and theme the sample excerpt in Appendix 1 and tell the participant’s story in your own way. Further reading about “doing” qualitative research can be found at the end of this paper.
CONCLUSIONS
Qualitative research can help researchers to access the thoughts and feelings of research participants, which can enable development of an understanding of the meaning that people ascribe to their experiences. It can be used in pharmacy practice research to explore how patients feel about their health and their treatment. Qualitative research has been used by pharmacists to explore a variety of questions and problems (see the “Further Reading” section for examples). An understanding of these issues can help pharmacists and other health care professionals to tailor health care to match the individual needs of patients and to develop a concordant relationship. Doing qualitative research is not easy and may require a complete rethink of how research is conducted, particularly for researchers who are more familiar with quantitative approaches. There are many ways of conducting qualitative research, and this paper has covered some of the practical issues regarding data collection, analysis, and management. Further reading around the subject will be essential to truly understand this method of accessing peoples’ thoughts and feelings to enable researchers to tell participants’ stories.
Appendix 1. Excerpt from a sample transcript
The participant (age late 50s) had suffered from a chronic mental health illness for 30 years. The participant had become a “revolving door patient,” someone who is frequently in and out of hospital. As the participant talked about past experiences, the researcher asked:
- What was treatment like 30 years ago?
- Umm—well it was pretty much they could do what they wanted with you because I was put into the er, the er kind of system er, I was just on
- endless section threes.
- Really…
- But what I didn’t realize until later was that if you haven’t actually posed a threat to someone or yourself they can’t really do that but I didn’t know
- that. So wh-when I first went into hospital they put me on the forensic ward ’cause they said, “We don’t think you’ll stay here we think you’ll just
- run-run away.” So they put me then onto the acute admissions ward and – er – I can remember one of the first things I recall when I got onto that
- ward was sitting down with a er a Dr XXX. He had a book this thick [gestures] and on each page it was like three questions and he went through
- all these questions and I answered all these questions. So we’re there for I don’t maybe two hours doing all that and he asked me he said “well
- when did somebody tell you then that you have schizophrenia” I said “well nobody’s told me that” so he seemed very surprised but nobody had
- actually [pause] whe-when I first went up there under police escort erm the senior kind of consultants people I’d been to where I was staying and
- ermm so er [pause] I . . . the, I can remember the very first night that I was there and given this injection in this muscle here [gestures] and just
- having dreadful side effects the next day I woke up [pause]
- . . . and I suffered that akathesia I swear to you, every minute of every day for about 20 years.
- Oh how awful.
- And that side of it just makes life impossible so the care on the wards [pause] umm I don’t know it’s kind of, it’s kind of hard to put into words
- [pause]. Because I’m not saying they were sort of like not friendly or interested but then nobody ever seemed to want to talk about your life [pause]
- nobody asked me any questions about my life. The only questions that came into was they asked me if I’d be a volunteer for these student exams
- and things and I said “yeah” so all the questions were like “oh what jobs have you done,” er about your relationships and things and er but
- nobody actually sat down and had a talk and showed some interest in you as a person you were just there basically [pause] um labelled and you
- know there was there was [pause] but umm [pause] yeah . . .
This article is the 10th in the CJHP Research Primer Series, an initiative of the CJHP Editorial Board and the CSHP Research Committee. The planned 2-year series is intended to appeal to relatively inexperienced researchers, with the goal of building research capacity among practising pharmacists. The articles, presenting simple but rigorous guidance to encourage and support novice researchers, are being solicited from authors with appropriate expertise.
Previous articles in this series:
Bond CM. The research jigsaw: how to get started. Can J Hosp Pharm . 2014;67(1):28–30.
Tully MP. Research: articulating questions, generating hypotheses, and choosing study designs. Can J Hosp Pharm . 2014;67(1):31–4.
Loewen P. Ethical issues in pharmacy practice research: an introductory guide. Can J Hosp Pharm. 2014;67(2):133–7.
Tsuyuki RT. Designing pharmacy practice research trials. Can J Hosp Pharm . 2014;67(3):226–9.
Bresee LC. An introduction to developing surveys for pharmacy practice research. Can J Hosp Pharm . 2014;67(4):286–91.
Gamble JM. An introduction to the fundamentals of cohort and case–control studies. Can J Hosp Pharm . 2014;67(5):366–72.
Austin Z, Sutton J. Qualitative research: getting started. C an J Hosp Pharm . 2014;67(6):436–40.
Houle S. An introduction to the fundamentals of randomized controlled trials in pharmacy research. Can J Hosp Pharm . 2014; 68(1):28–32.
Charrois TL. Systematic reviews: What do you need to know to get started? Can J Hosp Pharm . 2014;68(2):144–8.
Competing interests: None declared.
Further Reading
Examples of qualitative research in pharmacy practice.
- Farrell B, Pottie K, Woodend K, Yao V, Dolovich L, Kennie N, et al. Shifts in expectations: evaluating physicians’ perceptions as pharmacists integrated into family practice. J Interprof Care. 2010; 24 (1):80–9. [ PubMed ] [ Google Scholar ]
- Gregory P, Austin Z. Postgraduation employment experiences of new pharmacists in Ontario in 2012–2013. Can Pharm J. 2014; 147 (5):290–9. [ PMC free article ] [ PubMed ] [ Google Scholar ]
- Marks PZ, Jennnings B, Farrell B, Kennie-Kaulbach N, Jorgenson D, Pearson-Sharpe J, et al. “I gained a skill and a change in attitude”: a case study describing how an online continuing professional education course for pharmacists supported achievement of its transfer to practice outcomes. Can J Univ Contin Educ. 2014; 40 (2):1–18. [ Google Scholar ]
- Nair KM, Dolovich L, Brazil K, Raina P. It’s all about relationships: a qualitative study of health researchers’ perspectives on interdisciplinary research. BMC Health Serv Res. 2008; 8 :110. [ PMC free article ] [ PubMed ] [ Google Scholar ]
- Pojskic N, MacKeigan L, Boon H, Austin Z. Initial perceptions of key stakeholders in Ontario regarding independent prescriptive authority for pharmacists. Res Soc Adm Pharm. 2014; 10 (2):341–54. [ PubMed ] [ Google Scholar ]
Qualitative Research in General
- Breakwell GM, Hammond S, Fife-Schaw C. Research methods in psychology. Thousand Oaks (CA): Sage Publications; 1995. [ Google Scholar ]
- Given LM. 100 questions (and answers) about qualitative research. Thousand Oaks (CA): Sage Publications; 2015. [ Google Scholar ]
- Miles B, Huberman AM. Qualitative data analysis. Thousand Oaks (CA): Sage Publications; 2009. [ Google Scholar ]
- Patton M. Qualitative research and evaluation methods. Thousand Oaks (CA): Sage Publications; 2002. [ Google Scholar ]
- Willig C. Introducing qualitative research in psychology. Buckingham (UK): Open University Press; 2001. [ Google Scholar ]
Group Dynamics in Focus Groups
- Farnsworth J, Boon B. Analysing group dynamics within the focus group. Qual Res. 2010; 10 (5):605–24. [ Google Scholar ]
Social Constructivism
- Social constructivism. Berkeley (CA): University of California, Berkeley, Berkeley Graduate Division, Graduate Student Instruction Teaching & Resource Center; [cited 2015 June 4]. Available from: http://gsi.berkeley.edu/gsi-guide-contents/learning-theory-research/social-constructivism/ [ Google Scholar ]
Mixed Methods
- Creswell J. Research design: qualitative, quantitative, and mixed methods approaches. Thousand Oaks (CA): Sage Publications; 2009. [ Google Scholar ]
Collecting Qualitative Data
- Arksey H, Knight P. Interviewing for social scientists: an introductory resource with examples. Thousand Oaks (CA): Sage Publications; 1999. [ Google Scholar ]
- Guest G, Namey EE, Mitchel ML. Collecting qualitative data: a field manual for applied research. Thousand Oaks (CA): Sage Publications; 2013. [ Google Scholar ]
Constructivist Grounded Theory
- Charmaz K. Grounded theory: objectivist and constructivist methods. In: Denzin N, Lincoln Y, editors. Handbook of qualitative research. 2nd ed. Thousand Oaks (CA): Sage Publications; 2000. pp. 509–35. [ Google Scholar ]
- Accountancy
- Business Studies
- Organisational Behaviour
- Human Resource Management
- Entrepreneurship
- CBSE Class 11 Statistics for Economics Notes
Chapter 1: Concept of Economics and Significance of Statistics in Economics
- Statistics for Economics | Functions, Importance, and Limitations
Chapter 2: Collection of Data
Methods of data collection.
- Sources of Data Collection | Primary and Secondary Sources
- Direct Personal Investigation: Meaning, Suitability, Merits, Demerits and Precautions
- Indirect Oral Investigation : Suitability, Merits, Demerits and Precautions
- Difference between Direct Personal Investigation and Indirect Oral Investigation
- Information from Local Source or Correspondents: Meaning, Suitability, Merits, and Demerits
- Questionnaires and Schedules Method of Data Collection
- Difference between Questionnaire and Schedule
- Qualities of a Good Questionnaire and Types of Questionnaires
- What are the Published Sources of Collecting Secondary Data?
- What Precautions should be taken before using Secondary Data?
- Two Important Sources of Secondary Data: Census of India and Reports & Publications of NSSO
- What is National Sample Survey Organisation (NSSO)?
- What is Census Method of Collecting Data?
- Sample Method of Collection of Data
- Methods of Sampling
- Father of Indian Census
- What makes a Sampling Data Reliable?
- Difference between Census Method and Sampling Method of Collecting Data
- What are Statistical Errors?
Chapter 3: Organisation of Data
- Organization of Data
- Objectives and Characteristics of Classification of Data
- Classification of Data in Statistics | Meaning and Basis of Classification of Data
- Concept of Variable and Raw Data
- Types of Statistical Series
- Difference between Frequency Array and Frequency Distribution
- Types of Frequency Distribution
Chapter 4: Presentation of Data: Textual and Tabular
- Textual Presentation of Data: Meaning, Suitability, and Drawbacks
- Tabular Presentation of Data: Meaning, Objectives, Features and Merits
- Different Types of Tables
- Classification and Tabulation of Data
Chapter 5: Diagrammatic Presentation of Data
- Diagrammatic Presentation of Data: Meaning , Features, Guidelines, Advantages and Disadvantages
- Types of Diagrams
- Bar Graph | Meaning, Types, and Examples
- Pie Diagrams | Meaning, Example and Steps to Construct
- Histogram | Meaning, Example, Types and Steps to Draw
- Frequency Polygon | Meaning, Steps to Draw and Examples
- Ogive (Cumulative Frequency Curve) and its Types
- What is Arithmetic Line-Graph or Time-Series Graph?
- Diagrammatic and Graphic Presentation of Data
Chapter 6: Measures of Central Tendency: Arithmetic Mean
- Measures of Central Tendency in Statistics
- Arithmetic Mean: Meaning, Example, Types, Merits, and Demerits
- What is Simple Arithmetic Mean?
- Calculation of Mean in Individual Series | Formula of Mean
- Calculation of Mean in Discrete Series | Formula of Mean
- Calculation of Mean in Continuous Series | Formula of Mean
- Calculation of Arithmetic Mean in Special Cases
- Weighted Arithmetic Mean
Chapter 7: Measures of Central Tendency: Median and Mode
- Median(Measures of Central Tendency): Meaning, Formula, Merits, Demerits, and Examples
- Calculation of Median for Different Types of Statistical Series
- Calculation of Median in Individual Series | Formula of Median
- Calculation of Median in Discrete Series | Formula of Median
- Calculation of Median in Continuous Series | Formula of Median
- Graphical determination of Median
- Mode: Meaning, Formula, Merits, Demerits, and Examples
- Calculation of Mode in Individual Series | Formula of Mode
- Calculation of Mode in Discrete Series | Formula of Mode
- Grouping Method of Calculating Mode in Discrete Series | Formula of Mode
- Calculation of Mode in Continuous Series | Formula of Mode
- Calculation of Mode in Special Cases
- Calculation of Mode by Graphical Method
- Mean, Median and Mode| Comparison, Relationship and Calculation
Chapter 8: Measures of Dispersion
- Measures of Dispersion | Meaning, Absolute and Relative Measures of Dispersion
- Range | Meaning, Coefficient of Range, Merits and Demerits, Calculation of Range
- Calculation of Range and Coefficient of Range
- Interquartile Range and Quartile Deviation
- Partition Value | Quartiles, Deciles and Percentiles
- Quartile Deviation and Coefficient of Quartile Deviation: Meaning, Formula, Calculation, and Examples
- Quartile Deviation in Discrete Series | Formula, Calculation and Examples
- Quartile Deviation in Continuous Series | Formula, Calculation and Examples
- Mean Deviation: Coefficient of Mean Deviation, Merits, and Demerits
- Calculation of Mean Deviation for different types of Statistical Series
- Mean Deviation from Mean | Individual, Discrete, and Continuous Series
- Mean Deviation from Median | Individual, Discrete, and Continuous Series
- Standard Deviation: Meaning, Coefficient of Standard Deviation, Merits, and Demerits
- Standard Deviation in Individual Series
- Methods of Calculating Standard Deviation in Discrete Series
- Methods of calculation of Standard Deviation in frequency distribution series
- Combined Standard Deviation: Meaning, Formula, and Example
- How to calculate Variance?
- Coefficient of Variation: Meaning, Formula and Examples
- Lorenz Curveb : Meaning, Construction, and Application
Chapter 9: Correlation
- Correlation: Meaning, Significance, Types and Degree of Correlation
- Methods of Measurements of Correlation
- Scatter Diagram Correlation | Meaning, Interpretation, Example
- Spearman's Rank Correlation Coefficient in Statistics
- Karl Pearson's Coefficient of Correlation | Assumptions, Merits and Demerits
- Karl Pearson's Coefficient of Correlation | Methods and Examples
Chapter 10: Index Number
- Index Number | Meaning, Characteristics, Uses and Limitations
- Methods of Construction of Index Number
- Unweighted or Simple Index Numbers: Meaning and Methods
- Methods of calculating Weighted Index Numbers
- Fisher's Index Number as an Ideal Method
- Fisher's Method of calculating Weighted Index Number
- Paasche's Method of calculating Weighted Index Number
- Laspeyre's Method of calculating Weighted Index Number
- Laspeyre's, Paasche's, and Fisher's Methods of Calculating Index Number
- Consumer Price Index (CPI) or Cost of Living Index Number: Construction of Consumer Price Index|Difficulties and Uses of Consumer Price Index
- Methods of Constructing Consumer Price Index (CPI)
- Wholesale Price Index (WPI) | Meaning, Uses, Merits, and Demerits
- Index Number of Industrial Production : Characteristics, Construction & Example
- Inflation and Index Number
Important Formulas in Statistics for Economics
- Important Formulas in Statistics for Economics | Class 11
Data Collection refers to the systematic process of gathering, measuring, and analyzing information from various sources to get a complete and accurate picture of an area of interest. Different methods of collecting data include Direct Personal Investigation, Indirect Oral Investigation, Information from Local Sources or Correspondents, Information through Questionnaires and Schedules, and Published Sources and Unpublished Sources.
What is Data Collection?
Data Collection is the process of collecting information from relevant sources in order to find a solution to the given statistical enquiry. Collection of Data is the first and foremost step in a statistical investigation.
Here, statistical enquiry means an investigation made by any agency on a topic in which the investigator collects the relevant quantitative information. In simple terms, a statistical enquiry is a search for truth by using statistical methods of collection, compiling, analysis, interpretation, etc. The basic problem for any statistical enquiry is the collection of facts and figures related to this specific phenomenon that is being studied. Therefore, the basic purpose of data collection is collecting evidence to reach a sound and clear solution to a problem.

Table of Content
Important Terms related to Data Collection:
Methods of collecting data, a. methods of collecting primary data:, b. methods of collecting secondary data, 1. published sources, 2. unpublished sources, methods of data collection – faqs.
1. Investigator: An investigator is a person who conducts the statistical enquiry.
2. Enumerators: In order to collect information for statistical enquiry, an investigator needs the help of some people. These people are known as enumerators.
3. Respondents: A respondent is a person from whom the statistical information required for the enquiry is collected.
4. Survey: I t is a method of collecting information from individuals. The basic purpose of a survey is to collect data to describe different characteristics such as usefulness, quality, price, kindness, etc. It involves asking questions about a product or service from a large number of people.
Also Read: Sources of Data Collection | Primary and Secondary Sources

There are two different methods of collecting data: Primary Data Collection and Secondary Data Collection.
There are a number of methods of collecting primary data, Some of the common methods are as follows:
1. Direct Personal Investigation : As the name suggests, the method of direct personal investigation involves collecting data personally from the source of origin. In simple words, the investigator makes direct contact with the person from whom he/she wants to obtain information. This method can attain success only when the investigator collecting data is efficient, diligent, tolerant and impartial. For example, direct contact with the household women to obtain information about their daily routine and schedule.
2. Indirect Oral Investigation : In this method of collecting primary data, the investigator does not make direct contact with the person from whom he/she needs information, instead they collect the data orally from some other person who has the necessary required information. For example, collecting data of employees from their superiors or managers.
3. Information from Local Sources or Correspondents : In this method, for the collection of data, the investigator appoints correspondents or local persons at various places, which are then furnished by them to the investigator. With the help of correspondents and local persons, the investigators can cover a wide area.
4. Information through Questionnaires and Schedules : In this method of collecting primary data, the investigator, while keeping in mind the motive of the study, prepares a questionnaire. The investigator can collect data through the questionnaire in two ways:
- Mailing Method: This method involves mailing the questionnaires to the informants for the collection of data. The investigator attaches a letter with the questionnaire in the mail to define the purpose of the study or research. The investigator also assures the informants that their information would be kept secret, and then the informants note the answers to the questionnaire and return the completed file.
- Enumerator’s Method: This method involves the preparation of a questionnaire according to the purpose of the study or research. However, in this case, the enumerator reaches out to the informants himself with the prepared questionnaire. Enumerators are not the investigators themselves; they are the people who help the investigator in the collection of data.
Also Read: Qualities of a Good Questionnaire and Types of Questionnaires Difference between Questionnaire and Schedule
Secondary data can be collected through different published and unpublished sources. Some of them are as follows:
- Government Publications: Government publishes different documents which consists of different varieties of information or data published by the Ministries, Central and State Governments in India as their routine activity. As the government publishes these Statistics, they are fairly reliable to the investigator. Examples of Government publications on Statistics are the Annual Survey of Industries, Statistical Abstract of India, etc.
- Semi-Government Publications: Different Semi-Government bodies also publish data related to health, education, deaths and births. These kinds of data are also reliable and used by different informants. Some examples of semi-government bodies are Metropolitan Councils, Municipalities, etc.
- Publications of Trade Associations: Various big trade associations collect and publish data from their research and statistical divisions of different trading activities and their aspects. For example , data published by Sugar Mills Association regarding different sugar mills in India.
- Journals and Papers: Different newspapers and magazines provide a variety of statistical data in their writings, which are used by different investigators for their studies.
- International Publications: Different international organizations like IMF , UNO , ILO, World Bank, etc., publish a variety of statistical information which are used as secondary data.
- Publications of Research Institutions: Research institutions and universities also publish their research activities and their findings, which are used by different investigators as secondary data. For example National Council of Applied Economics, the Indian Statistical Institute, etc.
Another source of collecting secondary data is unpublished sources. The data in unpublished sources is collected by different government organizations and other organizations. These organizations usually collect data for their self-use and are not published anywhere. For example, research work done by professors, professionals, teachers and records maintained by business and private enterprises .
The table below shows the production of rice in India.

The above table contains the production of rice in India in different years. It can be seen that these values vary from one year to another. Therefore, they are known as variable . A variable is a quantity or attribute, the value of which varies from one investigation to another. In general, the variables are represented by letters such as X, Y, or Z. In the above example, years are represented by variable X, and the production of rice is represented by variable Y. The values of variable X and variable Y are data from which an investigator and enumerator collect information regarding the trends of rice production in India.
Thus, Data is a tool that helps an investigator in understanding the problem by providing him with the information required. Data can be classified into two types; viz., Primary Data and Secondary Data . Primary Data is the data collected by the investigator from primary sources for the first time from scratch. However, Secondary Data is the data already in existence that has been previously collected by someone else for other purposes. It does not include any real-time data as the research has already been done on that information.
Why is data collection important in economics?
Data collection is crucial in economics because it provides the empirical foundation for analyzing economic phenomena, testing theories, forecasting trends, and informing policy decisions. Accurate data collection ensures the reliability and validity of economic analyses.
What are surveys and questionnaires, and how are they used?
Surveys and questionnaires are tools used to collect data from a large number of respondents. They contain a series of questions designed to gather information on specific topics. Surveys can be conducted online, by phone, by mail, or in person. They are widely used in economics to collect data on consumer behavior, market trends, and economic conditions.
How are interviews conducted, and what types are there?
Interviews involve direct interaction between the interviewer and the respondent to gather detailed information. Types of interviews include: Structured Interviews: Follow a fixed set of questions. Unstructured Interviews: Open-ended, allowing for in-depth exploration. Semi-Structured Interviews: Combination of structured and unstructured formats. Interviews are useful for obtaining qualitative data and understanding complex economic issues.
How do you choose the appropriate data collection method for a study?
Choosing a data collection method depends on several factors: Research Objectives: Define the goals and questions of the study. Nature of Data Required: Determine whether quantitative or qualitative data is needed. Resources Available: Consider budget, time, and personnel constraints. Population and Sample: Assess the accessibility and characteristics of the target population. Ethical Considerations: Ensure ethical standards are met in data collection.
What are the ethical considerations in data collection?
Ethical considerations include obtaining informed consent from participants, ensuring confidentiality and privacy, avoiding harm to respondents, and maintaining data integrity. Ethical practices are essential for the credibility and validity of the research.
Please Login to comment...
Similar reads.
- Commerce - 11th
- Statistics for Economics
Improve your Coding Skills with Practice
What kind of Experience do you want to share?
Filter by Keywords
Project Management
Top 18 project management methodologies.
Erica Golightly
Senior Writer
February 7, 2022
Have you considered how a project management methodology can help you and your team achieve long-term success?
If you’re thinking, “I don’t work in industries like technology or construction, so this doesn’t apply to us,” think back to the last project you worked on. Did the team feel motivated? Productive from start to finish? Or did every day feel like this? ⬇️
We understand. As a project manager , it’s hard to deliver projects with often unclear direction from clients and stakeholders, let alone manage the process in between.
Project management methods establish a system of principles, standard processes, and control to manage multifaceted projects that come in all shapes and requirements— across all industries.
By the end of this article, you’ll learn:
- How to optimize the five phases of a project lifecycle
- The top 18 project management methodologies used across wide geographies
- Recommended features in ClickUp for specific project management methodologies
We invite you to ditch the messy, complicated, and inflexible processes for proven methodologies to leverage project management tools and various techniques for success. ⚙️⚖️🚀
The 5 Phases of a Project Lifecycle
Adaptive project framework (apf).
- Agifall/Hybrid
- Critical Path Method
- eXtreme Programming (XP)
Get Things Done (GTD)
- Integrated Project Management (IPM)
- New Product Introduction (NPI)
- Outcome Mapping
- Package Enabled Reengineering (PER)
Project Management Institute’s Project Management Body of Knowledge (PMI’s PMBOK)
Projects in controlled environments (prince2), rational unified process (rup), 100+ powerful tools in clickup for any project type.

Whether you’re a new or seasoned project manager, let’s refresh our minds on the five fundamental project lifecycle phases you need to know to run successful projects. This will help you in your decision to choose the right project management methodology.
👾 Phase 1: Initiation
A project always begins with a conversation. When you come out of the first meeting with a client or stakeholder , you should fully understand the project purpose, SMART (specific, measurable, achievable, relevant, and time-bound) goals, communication expectations, and budget.
👾 Phase 2: Planning
The planning phase goes more in-depth than determining the project scope and schedule (which is only the beginning). If you’re using a timeline or Gantt chart tool, it’s critical also to disclose these key project details in a project charter :
- Estimates and cost for people and software resources
- Potential risks, assumptions, and blockers
- Dependencies
- Project teams (roles and workflows)
- Change process requirements
- Success criteria
- Did we mention dependencies?
👾 Phase 3: Execution
Dependencies are an absolute necessity for controlled project execution . If you’re a coffee person and you skip your morning cup and head straight to work, chances are, you make your day a little more difficult than it should be.
As you’re on the path to assigning individual tasks, have an open discussion with the project team about what can or can’t be started until a specific task is completed. You’ll save time and money with transparency and set everyone up for success from start to finish.
👾 Phase 4: Monitoring
Data is your north star metric to manage people, resources, budgets , and risks during the execution phase. Make sure you’re using a powerful productivity tool like ClickUp to know what project contributors are working on and what they need to do next.
Even more, track project goals and communicate with stakeholders and clients within ClickUp.
👾 Phase 5: Closing
After you turn in the final deliverables and wrap up loose ends, it’s advantageous to assess the performance of team members and resources. This reflection period will help improve the next project.
Have all deliverables been completed, validated, and archived?
Were issues and risks effectively managed?
Which processes were easy/challenging, and what would they change?
Relate: Project Management Examples !
Welcome to your pocket encyclopedia of the top 18 project management methodologies! 📘
A nod to agile project management methodology, the adaptive project framework is an iterative approach to satisfy a project’s goals and outcomes. Meaning, a project’s plan is broken into short iterations (or cycles) of tasks. This helps structure task dependencies and establishes clear deadlines.
The five steps in the adaptive project framework are:
- Project Scope : document the project plan with a project charter (download ClickUp’s Project Charter Template )
- Cycle Plan: define each task with all dependencies
- Cycle Completion : after one cycle completes, another begins
- Control Point : the client or stakeholder meets with the team to assess the quality and potential room for improvements in the next cycle
- Final Report : determines if results were achieved and successful
🟢 Adaptive Project Framework Pros
- Less time is spent on the first phase (defining project scope)
- Client and stakeholder satisfaction increases because of their involvement
- Teams create the most value with learnings in short cycles
🟡 Adaptive Project Framework Cons
- The project scope will potentially change throughout the lifecycle, reverting from a client or stakeholder’s original vision
- Too much flexibility for teams accustomed to fixed schedules
- Limited control over business processes
The hybrid model is the best of both Agile and Waterfall methods . Commonly used in product development companies, the planning phase uses waterfall method techniques but applies agile practices during execution .

🟢 Agifall/Hybrid Pros
- Continous collaboration and communication amongst different teams within a project
- A gateway to a complete transition into Agile methodology
- Using the best techniques of both methods to create a custom approach
🟡 Agifall/Hybrid Cons
- A good amount of time is required to plan a clear, clean, and understandable project approach
Today, one of the most popular project management methodologies, the agile methodology , is an incremental and iterative approach to managing projects in phases . Each iteration has a fixed scope (between 1-3 weeks) to maintain product release consistency, stability, and on-time delivery.
At its core, release management minimizes risks, tracks and audits requirements , and secures consistent implementation—in the least disruptive approach .
The five steps in the Agile methodology are:
- Defining the release plan and product roadmap
- Designing and building product feature(s)
- Testing and iterating
- Closing and maintenance

🟢 Agile Pros
- Increases customer satisfaction and retention
- Software code and testing standards are used repeatedly
- Specific roles with multiple project drivers to meet the same goal
🟡 Agile Cons
- Some organizations might find agile workflows to be a poor culture fit
- Potential lack of understanding in workflow flexibility
- An experienced agile professional might be necessary for teams new to agile
Project managers use the Critical Path Method to define the critical and non-critical tasks for timely delivery. After listing every activity and task required for completion, they will note dependencies and write a sequence of times for each.
Planning with the Critical Path Method allows teams to pinpoint opportunities to shorten task times and flag potential shifts when changes can affect critical tasks.

🟢 Critical Path Method Pros
- Identifies the most important activities and tasks in a project
- Displays the complexities of whether a project is small or substantial
- Easily explained with a chart or graph
🟡 Critical Path Method Cons
- Mid-changes could disrupt the overall stability of the project
- Requires time and effort to build the CPM chart successfully
- Client and stakeholders must be comfortable with estimates on progress and delivery
Note : Critical Chain Project Management, a related project management methodology, focuses on managing resources and buffer duration between task chains and improving upon the Critical Path Method.
Test out these critical path templates !
The eXtreme Programming methodology takes elements of traditional software engineering practices to, well, extreme levels. However, it’s familiar to the agile framework like specific planning approach, on-site customer participation, and continuous testing.
Standard software development practices found in the eXtreme Programming method are:
- Pair Programming : two developers work together simultaneously on code
- Refactoring : implementing a feature without changing the behavior of the system
- Continuous Integration : integrating as soon as you identify issues decreases the number of bugs that could arise in production
- Short Release Cycles: every day is optimized, so by the end of the cycle, tested features are deployed for customer feedback
- The Planning Game : Customer and developers meet to discuss the upcoming release
- 40-Hour Week: developers must work fast and efficiently to maintain product quality, so keeping to a manageable work supports a healthy work-life balance
- Non-Complex Design : when design complications are found, it’s removed so developers can articulate product intention

🟢 eXtreme Programming Pros
- Fixed timeline length, typically 1-2 weeks
- Flexible to changes during the sprint cycle
- Higher customer satisfaction
🟡 eXtreme Programming Cons
- Requires engaged customer(s) to make informed project decisions
- Stressful if teams don’t fully understand the demanding workflow
- Geared towards product delivery businesses
The GTD (Get Things Done) method is a project management methodology less concerned with technical activities such as coding and testing. Instead, it emphasizes personal productivity to create the best systems for approaching life and work.
The five simple steps in the GTD method are:
- Capture : record your notes to make room for more headspace
- Clarify : review your notes and determine whether they should be converted into tasks, filed for referenced, or tossed
- Organize : dedicate a single place for your collection of ideas and tasks
- Reflect : visit your collection frequently to update for relevancy and opportunities
- Engage : use the system you’ve built to take action on your items
If you’re looking for a productivity tool to help gather your thoughts, tasks, schedule, and workflow in one place, learn how to use ClickUp with the GTD project management methodology. ⬇️
🟢 Get Things Done Pros
- Large or intimidating projects are broken down into manageable tasks
- Easily view which tasks take priority over others
- Entirely customizable for whatever season of life and work you’re in
🟡 Get Things Done Cons
- Requires time to set up a system for long term success
- Recording changes with the most up to date information are necessary to prevent backtracking
Check out these GTD apps !
The Integrated Project Management (IPM) project management methodology oversees the cross-functional communication and hand-off during all project phases . Since cross-functional teams have different processes and workflows, IPM helps resolve schedule conflicts, bottlenecks, and team bandwidths.
👉 Check out these project management communication resources to assist with Integrated Project Management planning:
- 7 Project Management Challenges And How To Solve Them
- How Toyin Olasehinde Uses ClickUp Comments to Streamline Communication
- 20+ Project Management Tips for Marketers
- Here’s How To Improve Your Team Communication
- 16 Unmissable Benefits of Project Management Software

🟢 Integrated Project Management Pros
- Projects are appropriately monitored and controlled
- Productivity accelerates to complete projects on time
- Complex resource planning becomes simple
🟡 Integrated Project Management Cons
- No cons to cohesive team communication and collaboration! 🤝
The Lean project management methodology focuses on tools and practices heavily centered on product value for customers . The commitment to constantly improve the reliability and quality of products helps businesses deliver faster . In addition, understanding the specific tasks and activities that need to be completed at a given time minimizes the chances of wasting time and resources.
The five principles of lean methodology are:
- Define Value : align processes to deliver on customer needs
- Map the Value Stream : remove barriers that disrupt the flow
- Create Flow : manage team member workloads and production steps to maintain a smooth process
- Establish Pull: remove overproduction of inventory by implementing a system for on-demand delivery
- Seek Perfection : continuously improve to make steps towards eliminating all mistakes

🟢 Lean Pros
- Understands all aspects of customer demands
- Promotes involving team members closest to the work
- Removes inventory waste, process barriers, and defective products
🟡 Lean Cons
- Not suitable for teams that don’t use a dashboard tool
- Not a culture fit for organizations resistant towards full transparency
- Experienced resource management professionals might be necessary for some teams
Bonus: Lean vs. Agile Project Management 💜
The New Product Introduction methodology is used by companies that continuously release new products . NPI streamlines time and efforts to achieve desired results by carefully vetting new ideas and surveying customers .
The six phases of New Product Introduction are:
- Ideation : brainstorming a product concept influenced by business risk and market research
- Product Definition : gathering product requirements
- Prototyping : building a model for the hardware or software product for performance analysis
- Detailed Design : refining the product model and fully designing to its final form
- Pre-Production (Validation/Testing) : validating the product to ensure high-performance results
- Manufacturing : all design, marketing, and sales efforts are carried out to deliver the final product

🟢 New Product Introduction Pros
- Creates a culture of development
- Drives higher value proposition
- Increases opportunities for businesses to innovate and grow within their industry
🟡 New Product Introduction Cons
- Not suitable for projects that are small in scale
- Product ideas can fail unexpectedly
The Outcome Mapping methodology is an approach for planning, monitoring, and evaluation developed by the International Development Research Centre (IDRC) , a Canadian grant-making organization. It’s distinct from all other methodologies mentioned in this list because it focuses on behavior changes of people and groups the project or program works with directly . (Organizations within policy development and research communication typically use this method.)
Outcome Mapping blends social learning, self-assessment, and adaptive management within an organization. The process allows organizations to gather data and encourage reflection about development impacts.
The three stages of Outcome Mapping are:
- Intentional Design : determining the vision, partners, tangible changes (outcomes), and contribution efforts
- Outcome and Performance Monitoring : using an Outcome Journal (tracking progress markers), Strategy Journal (testing strategy in wavering circumstances), and Performance Journal (recording practices and opportunities for improvement) to provide data
- Evaluation Planning : a detailed progress review to influence an evaluation plan and bring strategic benefits to the project

🟢 Outcome Mapping Pros
- Successful results contribute to sustainable improvements
- Incorporates being reflective about organizational and social learnings
- Flexible model to tailor to project needs
🟡 Outcome Mapping Cons
- Requires organizations to take a hard look at their views about development
- Regular communication and participation is necessary for success
- Not suitable for short software development lifecycles
The Package Enabled Reengineering methodology focuses on the original functionality of software packages as a framework for rethinking the design. It requires an analysis of challenges within the current process, management, people, and design to shape new systems.
Check out how to jumpstart your management and design workflows in ClickUp so you can organize your planning with the PER project management methodology. ⬇️
🟢 Package Enabled Reengineering Pros
- Optimizes productivity, resources, and communication strategically
🟡 Package Enabled Reengineering Cons
- Not suitable for organizations with already successful systems
Written by the Project Management Institute, a global “for-purpose” organization , the Project Management Body of Knowledge is a collection of tools, techniques , and best practices for a project manager to align with the evolving changes of project management.

🟢 PMI’s PMBOK Pros
- Resource for project managers studying for project management certification : CAPM (Certified Associate in Project Management) or PMP (Project Management Professional)
- Includes practices guides and comprehensive project management terms glossary
🟡 PMI’s PMBOK Cons
- Extensive 700+ page book not meant for reading cover to cover
The PRINCE2 project management methodology is globally adopted because of its practical and adaptive framework to divide projects into controllable stages . It focuses on an orderly approach in a project’s lifespan from beginning to end. The PRINCE2 methodology directly impacts day-to-day routines to deliver successful projects, from construction development projects to launching social campaigns.

🟢 PRINCE2 Pros
- PRINCE2 certification is available
- Improves project management skills with proven best practices
- Adapts to any project type and scale
🟡 PRINCE2 Cons
- Documentation heavy
- Without certification or experience, it might take longer to see results
The Rational Unified Process methodology is built on well-documented software processes focusing on an iterative approach throughout development. This allows for quick changes on high-risks throughout every stage . As a result, RUP’s structure lends itself to assembling high-quality software production .
The four project phases are:
- Inception : outlining the scope of work or statement of work , impact analysis, identify key use cases, and cost estimates
- Elaboration : designing an architected foundation for the product
- Construction : completing the bulk of the work to develop all software components
- Transition : introducing the product to the end-users, handling bug issues, and reviewing outcome goals

🟢 Rational Unified Process Pros
- Reduces time for initial integration as it’s built in the project stages
- Repeatable steps to apply to future projects
- Emphasizes documentation
🟡 Rational Unified Process Cons
- Not suitable for teams that are unable to keep up with documentation
- The project’s success rate is higher with experienced team members
Scrum project management adds to the agile approach by including a prominent role called the Scrum Master. The Scrum Master conducts a sprint planning meeting with the Product Owner and Development team. Then, they select the high-priority items from the Product Backlog —a list of collected feedback from customers and stakeholders—to release in one sprint. These high-priority items become a Sprint Backlog for the development team to build, test, and release.
Throughout the sprint cycle, a daily scrum meeting is held (typically at the start of the workday) for each project contributor to share: what they did yesterday, what they will do today, and any blockers in the way.
At the end of the sprint, a Sprint Review meeting is held with the Scrum Master, Product Owner, stakeholders, and development team to walk through accomplishments and changes. This review helps improve the performance of future sprints .

🟢 Scrum Pros
- Flexible timeline length, typically 2-4 weeks
- Teams are aligned around tasks and progress through daily scrum meetings
- Short sprints support faster changes from customer and stakeholder feedback
🟡 Scrum Cons
- Daily meetings might not be a culture fit for some teams
- The success rate is higher with experienced agile team members
- Adopting the Scrum framework in larger teams is difficult
Scrumban is the combination of Scrum and Kanban. Kanban adds metric visuals and process improvements to the Scrum methodology. For example, a distinct feature of the Scrumban method is the WIP (work in progress) board to help visualize all tasks from start to finish .
This board, divided into three sections—product backlog, work in progress, and completed—shows the collective work in a given section . With this data, the Scrum team can make adjustments to monitor workloads.
🟢 Scrumban Pros
- Adds a process improvement attribute to the Scrum methodology
- Issues can be pinpointed and resolved quickly on a progress board
- Promotes full transparency for all project team members
🟡 Scrumban Cons
- Boards that are not updated in real-time cause delay and confusion
- A fairly new methodology
- Daily standups are optional, which can be an advantage or disadvantage to a preferred workflow
Motorola introduced the Six Sigma methodology in the 1980s to bring down the defects in its manufacturing process. However, it’s suitable for all industries . It emphasizes a data-driven approach for continuous business transformation . Six means six standard deviations (a statistical benchmark), and the sigma symbol represents a standard deviation.
There are two models of the six sigma methodology:
Six Sigma DMAIC
- D efine the current problem, goals, and deliverables
- M easure the current process and performance
- A nalyze the causes of the problem
- Improve the process by proposing and testing solutions
- C ontrol the outcome by implementing changes in place if problems arise
Six Sigma DMADV
- D esign a process that meets customer expectations and needs
- V erify the design meets customer needs and it’s appropriately
The DMAIC and DMADV models in the six sigma methodology ensure each step is followed to achieve the best results.

🟢 Six Sigma Pros
- Reduces wastes and costs
- Enhances value and improves the quality of a company’s output
- Six Sigma certification is available
🟡 Six Sigma Cons
- An implementation period is necessary for success
- Complicated and requires statistical analysis
- It can get costly in the long run
Bonus: Check out the Top 10 Six Sigma Templates
The Waterfall methodology is one of the traditional project management methods. It has two main attributes: thorough initial planning and fixed-end requirements . Waterfall project management is predictive , meaning each stage starts when its predecessor ends. After a project has begun, it’s nearly impossible to make changes. (This characteristic of Waterfall is off-putting for organizations that experience altering project requirements while in progress.)
On the flip side, for businesses that need predicted outcomes , such as construction and manufacturing, this rigid framework is the best approach for their needs.
The stages of the Waterfall methodology are:
- Requirements Gathering
- Development

🟢 Waterfall Pros
- Easy and familiar to understand for new and seasoned teams
- No overlap between project phases
- Clear deadlines are determined and adhered to at the start of the project
Check out our Waterfall Management Template !
🟡 Waterfall Cons
- Top-down communication model
- Not suitable for software development or complex projects
- Not best for ongoing projects
Now that you know your best project methodologies options, where can you keep your people, processes, and projects organized? 🤔
One of the best ways to add value to your work and optimize your time is to use a software tool. Our recommendation? ClickUp! ✨

ClickUp is the ultimate productivity platform allowing teams to manage projects, collaborate smarter, and bring all work under one tool. Here are a few ClickUp features among the hundreds available that can be customized to any team size for consistent collaboration:
📊 Dashboards
ClickUp Dashboards are a time-saving resource to share high-level views with project stakeholders or project progress with anyone in their Workspace! Track sprints, task progress, portfolio management, and more with customizable widgets.
A must-have tool for these project management methodologies:
- Rational Unified Process
- Adaptive project framework (APF)

🤖 Automations

With ClickUp Automations , you’re able to set up combinations of Triggers and Actions to help automate repetitive actions—saving time and allowing you to focus on things that matter. Does your team use workflow software with external applications like GitHub? Automate your workflow within ClickUp using the GitHub integration !
🗒 List view
ClickUp’s powerful and flexible List view can sort, filter, or group columns in any way. Columns can be customized to show important information—task assignees, start and due dates, project briefs , website links, task comments—it’s up to you!

Subtasks in ClickUp add a layer to your work structure, allowing you to define more detailed goals inside of your tasks. This is a perfect solution for: action items that don’t warrant a new task, objectives that need to be completed to finish an overall task, and task dependencies.
🏃♀️ Sprint
Sprints in ClickUp are packed with additional ClickUp features to help teams better understand and manage their product roadmaps. Available on every ClickUp plan, Sprints use tasks as items of work so teams don’t have to rely on other software to get their work done.

🟫 Board view

Choose whether you want to zoom in on a single List, an entire Folder, or even all Spaces across your Workspace in Board view . For teams that prefer Kanban project management, Board’s view powerful drag-and-drop interface is perfect for visualizing tasks in progress.
ClickUp: A Powerful and Friendly Tool
Your ClickUp Workspace can be fully customized to optimize any project management methodology so you can do your best work and take it anywhere you go . Change the way you build and manage projects with ClickUp today!
Questions? Comments? Visit our Help Center for support.
Receive the latest WriteClick Newsletter updates.
Thanks for subscribing to our blog!
Please enter a valid email
- Free training & 24-hour support
- Serious about security & privacy
- 99.99% uptime the last 12 months

An official website of the United States government
Here’s how you know
Official websites use .gov A .gov website belongs to an official government organization in the United States.
Secure .gov websites use HTTPS A lock ( Lock A locked padlock ) or https:// means you’ve safely connected to the .gov website. Share sensitive information only on official, secure websites.
https://www.nist.gov/artificial-intelligence

Artificial intelligence
NIST aims to cultivate trust in the design, development, use and governance of Artificial Intelligence (AI) technologies and systems in ways that enhance safety and security and improve quality of life. NIST focuses on improving measurement science, technology, standards and related tools — including evaluation and data.
With AI and Machine Learning (ML) changing how society addresses challenges and opportunities, the trustworthiness of AI technologies is critical. Trustworthy AI systems are those demonstrated to be valid and reliable; safe, secure and resilient; accountable and transparent; explainable and interpretable; privacy-enhanced; and fair with harmful bias managed. The agency’s AI goals and activities are driven by its statutory mandates, Presidential Executive Orders and policies, and the needs expressed by U.S. industry, the global research community, other federal agencies,and civil society.
NIST’s AI goals include:
- Conduct fundamental research to advance trustworthy AI technologies.
- Apply AI research and innovation across the NIST Laboratory Programs.
- Establish benchmarks, data and metrics to evaluate AI technologies.
- Lead and participate in development of technical AI standards.
- Contribute technical expertise to discussions and development of AI policies.
NIST’s AI efforts fall in several categories:
Fundamental AI Research
NIST’s AI portfolio includes fundamental research to advance the development of AI technologies — including software, hardware, architectures and the ways humans interact with AI technology and AI-generated information
Applied AI Research
AI approaches are increasingly an essential component in new research. NIST scientists and engineers use various machine learning and AI tools to gain a deeper understanding of and insight into their research. At the same time, NIST laboratory experiences with AI are leading to a better understanding of AI’s capabilities and limitations.
Test, Evaluation, Validation, and Verification (TEVV)
With a long history of working with the community to advance tools, standards and test beds, NIST increasingly is focusing on the sociotechnical evaluation of AI.
Voluntary Consensus-Based Standards
NIST leads and participates in the development of technical standards, including international standards, that promote innovation and public trust in systems that use AI. A broad spectrum of standards for AI data, performance and governance are a priority for the use and creation of trustworthy and responsible AI.
A fact sheet describes NIST's AI programs .
Featured Content
Artificial intelligence topics.
- AI Test, Evaluation, Validation and Verification (TEVV)
- Fundamental AI
- Hardware for AI
- Machine learning
- Trustworthy and Responsible AI
Stay in Touch
Sign up for our newsletter to stay up to date with the latest research, trends, and news for Artificial intelligence.
The Research
Projects & programs, deep learning for mri reconstruction and analysis.

Emerging Hardware for Artificial Intelligence
Embodied ai and data generation for manufacturing robotics, deep generative modeling for communication systems testing and data sharing.

Additional Resources Links

NIST Launches Trustworthy and Responsible AI Resource Center (AIRC)
One-stop shop offers industry, government and academic stakeholders knowledge of AI standards, measurement methods and metrics, data sets, and other resources.

Minimizing Harms and Maximizing the Potential of Generative AI

NIST Reports First Results From Age Estimation Software Evaluation

NIST Launches ARIA, a New Program to Advance Sociotechnical Testing and Evaluation for AI

U.S. Secretary of Commerce Gina Raimondo Releases Strategic Vision on AI Safety, Announces Plan for Global Cooperation Among AI Safety Institutes
2024 Artificial Intelligence for Materials Science (AIMS) Workshop
Skip to Content

Current Students

Interested in more? Search Courses
- Search Input Submit Search
Faculty and Staff Grants From April 2024
University of denver, congratulations to the university of denver faculty and staff members who received grants and awards in april 2024 for the following projects..

Advancing Research Translation
- Naazneen Barma , Josef Korbel School of International Studies
- Grant from American University (subaward National Science Foundation)
- Abstract: The proposed sub-award will support work by Bridging the Gap to inform and contribute to the development of research translation training programs at American University. Bridging the Gap has extensive experience conducting programs that train PhD students and faculty in the development of policy-relevant research questions, the dissemination of research findings to audiences outside academia, the establishment of links with policy practitioners and the pursuit of professional opportunities outside academia. Bridging the Gap will develop two training modules focused on research translation to be incorporated into American University’s training programs and provide foundational inputs as American University develops plans for its own research translation training programs.
Differential Diagnosis in Learning Disabilities
- Lauren McGrath , College of Arts, Humanities & Social Sciences
- Grant from the University of Colorado Boulder (subaward National Institutes of Health)
- Abstract: The goal of this project is to identify and characterize the correlates and trajectory of academic and clinical anxiety symptoms in children with reading disabilities.
Wyoming Child Welfare and Early Childhood Partnerships Grant Evaluation
- Shauna Rienks , Graduate School of Social Work
- Grant from the Wyoming Department of Family Services (subaward Administration for Children and Families)
- Abstract: The Butler Institute for Families will plan and implement a mixed-methods process and summative evaluation of an ACF-funded grant to improve collaborations across early childhood and child welfare systems in Wyoming. This study will involve analysis of administrative data and primary data collection with key partners.
Positive Emotion in Bipolar Disorder Onset and Illness Course in Emerging Adults
- Kateri McRae , College of Arts, Humanities & Social Sciences
- Abstract: Dr. McRae will work with Drs. Gruber and Johnson on the design of all studies and will advise on experimental task training, data collection, analysis and interpretation of data for the fMRI emotion regulation task.
GeriCare EveryWhere Consortium Partner Agreement
- Leslie Hasche , Graduate School of Social Work
- Grant from the University of Colorado Denver
- Abstract: Colorado Senate Bill 2023-31 creates the Colorado multidisciplinary health-care provider access training program to improve the health care of medically complex, costly, compromised and vulnerable older Coloradans. The University of Colorado Anschutz Medical Campus shall develop, implement and administer this program. Dr. Hasche will support the program, which coordinates and expands geriatric training opportunities for clinical health professional graduate students enrolled in participating Colorado institutions of higher education across Colorado studying to become advanced practice providers, dentists, nurses, occupational therapists, pharmacists, physicians (including medical doctors and doctors of osteopathy), physical therapists, psychologists, social workers and speech-language therapists.
Service Agreement
- Benjamin Ingman , Morgridge College of Education
- Grant from Keystone Policy Center (subaward Department of Education)
- Abstract: The contractor will work with Keystone to develop and implement activities for the Colorado Statewide Family Engagement Center.
Differential Diagnosis in Learning - Community Engagement
- Abstract: The Engagement Core is a collaboration between the University of Denver and University of Colorado Boulder. The goal is to disseminate our research results effectively to community stakeholders and to engage in bidirectional communication that shapes future research directions. Dr. McGrath and Dr. Santerre-Lemmon will continue offering collaborative talks and webinars for public audiences and practitioners on evidence-based practices for children with specific learning disabilities.
Leadership Development and Facilitation
- Christa Doty , Graduate School of Social Work
Time Series Analysis Research, From a Novel Jacobian Estimator to Applications to the Orion Capsule
- Petr Vojtechovsky and Frederic Latremoliere , College of Natural Sciences and Mathematics
Related Articles

Faculty and Staff Grants From January 2024

Faculty and Staff Grants From February 2024
Faculty and staff grants from march 2024.
A Causal Analysis of the Influential Criteria in Underground Mining Method Selection
- Original Paper
- Published: 02 June 2024
Cite this article

- Zeinab Jahanbani 1 ,
- Ali Mortazavi 2 &
- Majid Ataee-pour 1
Explore all metrics
The criteria affecting the choice of underground mining methods (UMMs) are interdependent and the causal relationship among them is intricate. This can cause various risks and can be a significant challenge in mines. Therefore, measuring and assessing the level of a causal relationship between these effective criteria aids in the choosing of the most financially advantageous mining technique prior to commencing the mining operation. Additionally, it can help in designing a more secure/safe mine, and lowering the hazards involved. In this study, a hybrid model according to the fuzzy decision-making trial and evaluation laboratory (DEMATEL) technique and Z-numbers theory (Z-NT) was proposed to investigate the causal interaction among the influential factors in the instability of underground excavations and choosing the best and safest UMM. Generally, conducting this research will show the cause groups and the effect groups of the criteria. Hence, it will help the decision-makers in identifying the influencing criteria and resolving the project’s problems. Also, the use of the Z-NT makes it possible to highly reduce the uncertainties associated with these effective factors and the expert’s opinions. To do this study, first, the criteria that affect the underground mining method selection (UMMS) were recognized and classified. Then, the proposed hybrid model was used and the causal diagram was constructed. As a result, by applying the proposed model, the cause criteria and the effect criteria were determined. In addition, the significance of every criterion was calculated.
A causal analysis of the influential criteria in underground mining method selection
Development of a hybrid model based on the fuzzy DEMATEL technique, and Z-numbers theory
Demonstration of the cause groups and the effect groups of the effective criteria
Development of a model to choose the best mining method, design a safer mine, and reduce the various risks
The proposed model decreases the uncertainty of the experts’ opinions and the results
This is a preview of subscription content, log in via an institution to check access.
Access this article
Price includes VAT (Russian Federation)
Instant access to the full article PDF.
Rent this article via DeepDyve
Institutional subscriptions
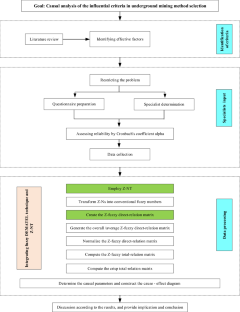
Analysis of Factors Influencing Floor Water Inrush in Coal Mines: A Nonlinear Fuzzy Interval Assessment Method

Determination of the most appropriate tools of multi-criteria decision analysis for underground mining method selection—a case study

Impact Hazard Assessment of Mine Roadway Excavation Based on FAHP Method
Abbreviations.
Underground mining method
Underground mining method selection
Decision-making trial and evaluation laboratory
Z-numbers theory
Hanging wall
Geometric conditions of the deposit
Geomechanical design factors and Geological conditions
Deposit size
Deposit shape
Deposit depth
Deposit dip
Loading conditions
Main discontinuities’ shear strength
Major discontinuities’ dip/dip direction
Discontinuity spacing
In-situ stress magnitude and orientation
Tensile strength of rock mass
Rock mass deformation modulus
Friction angle of rock mass
Rock mass cohesion
Hydrologic conditions (surface and underground water)
Tunnel-boring machines
International Society of Rock Mechanics
Rock Mass Rating
The first component of Z-Ns
The second component of Z-Ns
The reliability value, which is the second element of Z-Ns, is subjected to a transformation process to yield a precise numerical value
A fuzzy set, which is established on a universal set X
The membership function of R
The membership value that denotes the degree to which an element x is a member of the set X in the context of the R
The Z-fuzzy direct-relation matrix
The number of criteria
The average of pair-wise comparison matrix
The initial direct influence matrix
The total-relation matrix
The ( i, j ) element of matrix \(\tilde{T}\)
Defuzzification of triangular fuzzy numbers into crisp values through changing every factor
The cumulative impacts of criterion i on the other criteria, both directly and indirectly
The total of the direct and indirect impacts that criterion j gets from the other criteria
Abdelrasoul ME, Wang G, Kim JG, Ren G, Abd-El-Hakeem Mohamed M, Ali MA, Abdellah WR (2022) Review on the development of mining method selection to identify new techniques using a cascade-forward backpropagation neural network. Adv Civ Eng 2022:1–16
Article Google Scholar
Ali MA, Kim J-G (2021) Selection mining methods via multiple criteria decision analysis using TOPSIS and modification of the UBC method. J Sustain Min 20:49–55
Alpay S, Yavuz M (2007) A decision support system for underground mining method selection. In: International conference on industrial, engineering and other applications of applied intelligent systems. Springer
Alpay S, Yavuz M (2009) Underground mining method selection by decision making tools. Tunn Undergr Space Technol 24(2):173–184
Antoniou AA, Lekkas E (2010) Rockfall susceptibility map for Athinios port, Santorini island, Greece. Geomorphology 118(1–2):152–166
Ataei M (2011) Underground mining, 3rd edn. Shahrood University of Technology, Shahrood
Google Scholar
Ataei M, Jamshidi M, Sereshki F, Jalali SME (2008) Mining method selection by AHP approach. J S Afr Inst Min Metall 108(12):741–749
Ataei M, Shahsavany H, Mikaeil R (2013) Monte Carlo Analytic Hierarchy Process (MAHP) approach to selection of optimum mining method. Int J Min Sci Technol 23(4):573–578
Azadeh A, Osanloo M, Ataei M (2010) A new approach to mining method selection based on modifying the Nicholas technique. Appl Soft Comput 10(4):1040–1061
Bajić S, Bajić D, Gluščević B, Ristić Vakanjac V (2020) Application of fuzzy analytic hierarchy process to underground mining method selection. Symmetry 12(2):192
Balusa BC, Gorai AK (2019a) Sensitivity analysis of fuzzy-analytic hierarchical process (FAHP) decision-making model in selection of underground metal mining method. J Sustain Min 18(1):8–17
Balusa BC, Gorai AK (2019b) A comparative study of various multi-criteria decision-making models in underground mining method selection. J Inst Eng (india) Ser D 100(1):105–121
Balusa BC, Singam J (2018) Underground mining method selection using WPM and PROMETHEE. J Inst Eng (india) Ser D 99(1):165–171
Baykasoğlu A, Kaplanoğlu V, Durmuşoğlu ZD, Şahin C (2013) Integrating fuzzy DEMATEL and fuzzy hierarchical TOPSIS methods for truck selection. Expert Syst Appl 40(3):899–907
Bogdanovic D, Nikolic D, Ilic I (2012) Mining method selection by integrated AHP and PROMETHEE method. An Acad Bras Ciênc 84:219–233
Boshkov SH, Wright FD (1973) Basic and parametric criteria in the selection, design and development of underground mining systems. SME mining engineering handbook, vol 1. p 12.2
Brady BH, Brown ET (2006) Rock mechanics: for underground mining. Springer
Brown ET (2002) Block caving geomechanics
Brown ET (2007) Block caving geomechanics, 2nd edn. JKMRC, Brisbane
Brown ET (2012) Risk assessment and management in underground rock engineering—an overview. J Rock Mech Geotech Eng 4(3):193–204
Cai M (2011) Rock mass characterization and rock property variability considerations for tunnel and cavern design. Rock Mech Rock Eng 44:379–399
Collins L (2007) Research design and methods, encyclopedia of gerontology. Elsevier, Amsterdam
Cronbach LJ (1951) Coefficient alpha and the internal structure of tests. Psychometrika 16(3):297–334
Dehghani H, Siami A, Haghi P (2017) A new model for mining method selection based on grey and TODIM methods. J Min Environ 8(1):49–60
Fu Z, Wu X, Liao H, Herrera F (2018) Underground mining method selection with the hesitant fuzzy linguistic gained and lost dominance score method. IEEE Access 6:66442–66458
Ghazdali O, Moustadraf J, Tagma T, Alabjah B, Amraoui F (2021) Study and evaluation of the stability of underground mining method used in shallow-dip vein deposits hosted in poor quality rock. Min Miner Deposits 15(3):31–38
Ghorbani Y, Nwaila GT, Zhang SE, Bourdeau JE, Cánovas M, Arzua J, Nikadat N (2023) Moving towards deep underground mineral resources: Drivers, challenges and potential solutions. Resour Policy 80:103222
Gupta S, Kumar U (2012) An analytical hierarchy process (AHP)-guided decision model for underground mining method selection. Int J Min Reclam Environ 26(4):324–336
Hamedi H, Mehdiabadi A (2020) Entrepreneurship resilience and Iranian organizations: application of the fuzzy DANP technique. Asia Pac J Innov Entrep 14(3):231–247
Hartman HL, Mutmansky JM (1987) Introductory mining engineering, 2nd edn. John Wiley & Sons
Heidarzadeh S, Saeidi A, Rouleau A (2020a) Use of probabilistic numerical modeling to evaluate the effect of geomechanical parameter variability on the probability of open-stope failure: a case Study of the Niobec Mine, Quebec (Canada). Rock Mech Rock Eng 53(3):1411–1431
Heidarzadeh S, Saeidi A, Rouleau A (2020b) Use of probabilistic numerical modeling to evaluate the effect of geomechanical parameter variability on the probability of open-stope failure: a case Study of the Niobec Mine, Quebec (Canada). Rock Mech Rock Eng 53:1411–1431
Iphar M, Alpay S (2019) A mobile application based on multi-criteria decision-making methods for underground mining method selection. Int J Min Reclam Environ 33(7):480–504
Janiszewski M, Pontow S, Rinne M (2022) Industry survey on the current state of stope design methods in the underground mining sector. Energies 15(1):240
Kang B, Wei D, Li Y, Deng Y (2012a) Decision making using Z-numbers under uncertain environment. J Comput Inf Syst 8(7):2807–2814
Kang B, Wei D, Li Y, Deng Y (2012b) A method of converting Z-number to classical fuzzy number. J Inf Comput Sci 9(3):703–709
Karadogan A, Kahriman A, Ozer U (2008) Application of fuzzy set theory in the selection of underground mining method. J S Afr Inst Min Metall 108(2):73–79
Karimnia H, Bagloo H (2015) Optimum mining method selection using fuzzy analytical hierarchy process–Qapiliq salt mine, Iran. Int J Min Sci Technol 25(2):225–230
Khan A, Akram M, Ahmad U, Al-Shamiri MMA (2023) A new multi-objective optimization ratio analysis plus full multiplication form method for the selection of an appropriate mining method based on 2-tuple spherical fuzzy linguistic sets. Math Biosci Eng 20:456–488
Kiani M, Hosseini SH, Taji M, Gholinejad M (2021) Risk criteria classification and the evaluation of blasting operations in open pit mines by using the FDANP method. Mini Miner Deposits 15(2):70–81
Krekula S (2017) Evaluation of the rock support system subjected to dynamic loads in Kiirunavaara. M.Sc. Thesis. Luleå University of Technology
Laubscher D (1981) Selection of Mass Underground Mining Methods. Design and Operation of Caving and Sublevel Stoping Mines. New York, AIME
Langford JC (2013) Application of reliability methods to the design of underground structures. Queen’s University (Canada), Kingston
Li S, Huang Q, Hu B, Pan J, Chen J, Yang J, Zhou J, Wang X, Yu H (2023) Mining method optimization of difficult-to-mine complicated orebody using Pythagorean fuzzy sets and TOPSIS method. Sustainability 15(4):3692
Article CAS Google Scholar
Lin C-J, Wu W-W (2008) A causal analytical method for group decision-making under fuzzy environment. Expert Syst Appl 34(1):205–213
Mahrous Ali Mohamed A, Jong-Gwan K (2021) Selection mining methods via multiple criteria decision analysis using TOPSIS and modification of the UBC method. J Sustain Min 20(2):49–55
Meech J, Clayton C, Pakalnis R (2002) A knowledge-based system for selecting a mining method. International conference on Intelligent Processing and Manufacturing of Materials (IPPM), Canada
Mijalkovski S, Despodov Z, Mirakovski D, Adjiski V, Doneva N (2022) Aplication of USB methodology for underground mining method selection. Undergr Min Eng 40:15–26
Mikaeil R, Naghadehi MZ, Ataei M, Khalokakaie R (2009) A decision support system using fuzzy analytical hierarchy process (FAHP) and TOPSIS approaches for selection of the optimum underground mining method. Arch Min Sci 54(2):341–368
Milne DM (1997) Underground design and deformation based on surface geometry. University of British Columbia
Mishra R, Kiuru R, Uotinen L, Janiszewski M, Rinne M (2019) Combining expert opinion and instrumentation data using Bayesian networks to carry out stope collapse risk assessment. In: MGR 2019: proceedings of the first international conference on mining geomechanical risk. Australian Centre for Geomechanics
Morrison RGK (1976) A philosophy of ground control. rev. edn. Department of Mining and Metallurgical Engineering, Montreal, McGill University, p 182
Mottahedi A, Ataei M (2019) Fuzzy fault tree analysis for coal burst occurrence probability in underground coal mining. Tunn Undergr Space Technol 83:165–174
Muhafidzah A, Ramli K (2022) Interdependency and priority of critical infrastructure information (Case Study: Indonesia Payment System). Jurnal RESTI (rekayasa Sistem Dan Teknologi Informasi) 6(3):403–411
Mutambo V, Kangwa S, Fisonga M (2022) Mining method selection for extracting moderately deep ore body using analytical hierarchy process at mindola sub-vertical shaft, Zambia. Cogent Eng 9(1):2062877
Naghadehi MZ, Mikaeil R, Ataei M (2009) The application of fuzzy analytic hierarchy process (FAHP) approach to selection of optimum underground mining method for Jajarm Bauxite Mine, Iran. Expert Syst Appl 36(4):8218–8226
Namin FS, Shahriar K, Bascetin A, Ghodsypour SH (2009) Practical applications from decision-making techniques for selection of suitable mining method in Iran. Gospodarka Surowcami Mineralnymi 25:57–77
Namin FS, Ghadi A, Saki F (2022) A literature review of Multi Criteria Decision-Making (MCDM) towards mining method selection (MMS). Resour Policy 77:102676
Nicholas D (1992) Selection procedure. In: Hartman HL (ed) SME mining engineering handbook, vol 42. Society for Mining Metallurgy and Exploration, Colorado, pp 2090–2105
Nicholas D, Mark J (1981) Feasibility study-selection of a mining method integrating rock mechanics and mine planning. In: 5th Rapid Excavation and Tunneling Conference, San Francisco, vol 2, p 1018–1031
Pakalnis R, Miller L, Poulin R (1995) UBC mining method selection. University of British Columbia, Vancouver, Canada
Palanikkumar D, Upreti K, Venkatraman S, Suganthi JR, Kannan S, Srinivasan S (2022) Fuzzy logic for underground mining method selection. Intell Autom Soft Comput 32(3):1843–1854
Palmstrom A, Stille H (2007) Ground behaviour and rock engineering tools for underground excavations. Tunn Undergr Space Technol 22(4):363–376
Pender M, Free M (1993) Stability assessment of slopes in closely jointed rock masses. In: ISRM International Symposium-EUROCK 93. OnePetro
Peele R, Church J (1941) Mining engineering hand. John Wiley & Sons, INC
Popovic G, Djordjevic B, Milanovic D (2019) Multiple criteria approach in the mining method selection. Industrija 47(4):47–62
Rafiee R, Ataei M, Khalokakaie R, Jalali SME, Sereshki F (2015) Determination and assessment of parameters influencing rock mass cavability in block caving mines using the probabilistic rock engineering system. Rock Mech Rock Eng 48:1207–1220
Samimi Namin FS, Ghadi A, Saki F (2022) A literature review of Multi Criteria Decision-Making (MCDM) towards mining method selection (MMS). Resour Policy 77:102676
Selerio E Jr, Caladcad JA, Catamco MR, Capinpin EM, Ocampo L (2022) Emergency preparedness during the COVID-19 pandemic: modelling the roles of social media with fuzzy DEMATEL and analytic network process. Socio-Econ Plan Sci 82:101217
Shohda AM, Ali MA, Ren G, Kim JG, Mohamed MAEH (2022) Application of cascade forward backpropagation neural networks for selecting mining methods. Sustainability 14(2):635
Sjöberg J, Lundman P, Nordlund E (2001) Analys och prognos av utfall i bergschakt, KUJ 1045. Slutrapport. LKAB Utredning, pp 01–762 (in Swedish)
Skrzypkowski K, Gómez R, Zagórski K, Zagórska A, Gómez-Espina R (2022a) Review of underground mining methods in world-class base metal deposits: experiences from Poland and Chile. Energies 16(1):148
Skrzypkowski K, Zagórski K, Zagórska A, Sengani F (2022b) Access to deposits as a stage of mining works. Energies 15(22):8740
Tahmasebinia F, Yang A, Feghali P, Skrzypkowski K (2022) A numerical investigation to calculate ultimate limit state capacity of cable bolts subjected to impact loading. Appl Sci 13(1):15
Valmohammadi C, Khaki MM (2019) Determinants for selection of projects for exploitation of mines in Iran. Resour Policy 63:101424
Wang J, Apel DB, Xu H, Wei C, Skrzypkowski K (2022) Evaluation of the effects of yielding rockbolts on controlling self-initiated strainbursts: a numerical study. Energies 15(7):2574
Yavuz M (2015) The application of the analytic hierarchy process (AHP) and Yager’s method in underground mining method selection problem. Int J Min Reclam Environ 29(6):453–475
Yazdani-Chamzini A, Haji Yakchali S, Kazimieras Zavadskas E (2012) Using a integrated MCDM model for mining method selection in presence of uncertainty. Econ Res Ekonomska Istraživanja 25(4):869–904
Zadeh LA (1965) Fuzzy sets. Inf Control 8(3):338–353
Zadeh LA (2011) A note on Z-numbers. Inf Sci 181(14):2923–2932
Zeller RA (2005) Measurement error, issues and solutions. In: Kempf-Leonard K (ed) Encyclopedia of Social Measurement. Elsevier, New York
Zheng Y, Zhang Q, Zhao J (2016) Challenges and opportunities of using tunnel boring machines in mining. Tunn Undergr Space Technol 57:287–299
Download references
No funding was received for conducting this study.
Author information
Authors and affiliations.
Department of Mining Engineering, Amirkabir University of Technology, Tehran, Iran
Zeinab Jahanbani & Majid Ataee-pour
School of Mining and Geosciences, Nazarbayev University, Astana, Kazakhstan
Ali Mortazavi
You can also search for this author in PubMed Google Scholar
Contributions
All authors contributed to the study conception and design. Material preparation, data collection and analysis were performed by Zeinab Jahanbani, Ali Mortazavi and Majid Ataee-pour. The first draft of the manuscript was written by Zeinab Jahanbani and all authors commented on previous versions of the manuscript. All authors read and approved the final manuscript.
Corresponding author
Correspondence to Majid Ataee-pour .
Ethics declarations
Conflict of interest.
The authors declare that they have no known competing financial interests or personal relationships that could have appeared to influence the work reported in this paper. The authors declare the following financial interests/personal relationships which may be considered as potential competing interests.
Additional information
Publisher's note.
Springer Nature remains neutral with regard to jurisdictional claims in published maps and institutional affiliations.
Rights and permissions
Springer Nature or its licensor (e.g. a society or other partner) holds exclusive rights to this article under a publishing agreement with the author(s) or other rightsholder(s); author self-archiving of the accepted manuscript version of this article is solely governed by the terms of such publishing agreement and applicable law.
Reprints and permissions
About this article
Jahanbani, Z., Mortazavi, A. & Ataee-pour, M. A Causal Analysis of the Influential Criteria in Underground Mining Method Selection. Rock Mech Rock Eng (2024). https://doi.org/10.1007/s00603-024-03864-z
Download citation
Received : 22 October 2023
Accepted : 13 March 2024
Published : 02 June 2024
DOI : https://doi.org/10.1007/s00603-024-03864-z
Share this article
Anyone you share the following link with will be able to read this content:
Sorry, a shareable link is not currently available for this article.
Provided by the Springer Nature SharedIt content-sharing initiative
- Influential factors
- Causal relationship
- Fuzzy DEMATEL technique
- Find a journal
- Publish with us
- Track your research
IMAGES
VIDEO
COMMENTS
Revised on June 21, 2023. Data collection is a systematic process of gathering observations or measurements. Whether you are performing research for business, governmental or academic purposes, data collection allows you to gain first-hand knowledge and original insights into your research problem. While methods and aims may differ between ...
Data collection is the process of gathering and collecting information from various sources to analyze and make informed decisions based on the data collected. This can involve various methods, such as surveys, interviews, experiments, and observation. In order for data collection to be effective, it is important to have a clear understanding ...
PDF | Learn how to choose the best data collection methods and tools for your research project, with examples and tips from ResearchGate experts. | Download and read the full-text PDF.
Data collection is the process of gathering information from various sources via different research methods and consolidating it into a single database or repository so researchers can use it for further analysis. Data collection aims to provide information that individuals, businesses, and organizations can use to solve problems, track progress, and make decisions.
While we focus on primary data collection methods in this guide, we encourage you not to overlook the value of incorporating secondary data into your research design where appropriate. 3. Choose your data collection method. When choosing your data collection method, there are many options at your disposal.
Data collection methods are important, ... Textual analysis can be used as the main method in a research project or to contextualize findings from another method. The choice and number of documents has to be guided by the research question, but can include newspaper or research articles, governmental reports, organization policies and protocols ...
Data Collection, Research Methodology, Data Collection Methods, Academic Research Paper, Data Collection Techniques. I. INTRODUCTION Different methods for gathering information regarding specific variables of the study aiming to employ them in the data analysis phase to achieve the results of the study, gain the answer of the research
Data collection is an essential part of the research process, whether you're conducting scientific experiments, market research, or surveys. The methods and tools used for data collection will vary depending on the research type, the sample size required, and the resources available.
There are actually two kinds of mixing of the six major methods of data collection (Johnson & Turner, 2003). The first is intermethod mixing, which means two or more of the different methods of data collection are used in a research study. This is seen in the two examples in the previous paragraph.
We offer best-practice recommendations for journal reviewers, editors, and authors regarding data collection and preparation. Our recommendations are applicable to research adopting different epistemological and ontological perspectives—including both quantitative and qualitative approaches—as well as research addressing micro (i.e., individuals, teams) and macro (i.e., organizations ...
Data Collection Methods. Data collection is a process of collecting information from all the relevant sources to find answers to the research problem, test the hypothesis (if you are following deductive approach) and evaluate the outcomes. Data collection methods can be divided into two categories: secondary methods of data collection and ...
The importance of data collection methods cannot be overstated, as they play a key role in the research study's overall success and internal validity. Types of Data Collection Methods. The choice of data collection method depends on the research question being addressed, the type of data needed, and the resources and time available.
6 methods of data collection. There are many methods of data collection that you can use in your workplace, including: 1. Observation. Observational methods focus on examining things and collecting data about them. This might include observing individual animals or people in their natural spaces and places.
Step 2: Choose your data collection method. Based on the data you want to collect, decide which method is best suited for your research. Experimental research is primarily a quantitative method. Interviews, focus groups, and ethnographies are qualitative methods. Surveys, observations, archival research, and secondary data collection can be ...
The Combination Research method involves two or more data collection methods, for instance, interviews as well as questionnaires or a combination of semi-structured telephone interviews and focus groups. The best tools for combination research are: Online Survey - The two tools combined here are online interviews and the use of questionnaires ...
Data collection is the process of collecting and evaluating information or data from multiple sources to find answers to research problems, answer questions, evaluate outcomes, and forecast trends and probabilities. It is an essential phase in all types of research, analysis, and decision-making, including that done in the social sciences ...
This chapter concerns research on collecting, representing, and analyzing the data that underlie behavioral and social sciences knowledge. Such research, methodological in character, includes ethnographic and historical approaches, scaling, axiomatic measurement, and statistics, with its important relatives, econometrics and psychometrics. The field can be described as including the self ...
Data collection is the process of gathering and measuring information on variables of interest, in an. research design in the world but if you cannot collect the required data you will be not be ...
INTRODUCTION. In an earlier paper, 1 we presented an introduction to using qualitative research methods in pharmacy practice. In this article, we review some principles of the collection, analysis, and management of qualitative data to help pharmacists interested in doing research in their practice to continue their learning in this area.
Data collection: experiments and focus groups 167 Flexibility of design In qualitative research, the research design is as flexible as the methods, allowing for modification in order to adjust it to the data. In quantitative research the design is developed at the beginning of the project and deviations of any kind are not
Questionnaires & Schedule method of data collection : The questionnaires are the fundamental instrument for gathering information in review research. Fundamentally, it is a bunch of standardized questions, frequently called items, which follow a decent plan to gather individual information around at least one explicit theme.
Critical Path Method. Project managers use the Critical Path Method to define the critical and non-critical tasks for timely delivery. After listing every activity and task required for completion, they will note dependencies and write a sequence of times for each.. Planning with the Critical Path Method allows teams to pinpoint opportunities to shorten task times and flag potential shifts ...
A research design is a strategy for answering your research question using empirical data. Creating a research design means making decisions about: Your overall research objectives and approach. Whether you'll rely on primary research or secondary research. Your sampling methods or criteria for selecting subjects. Your data collection methods.
AI approaches are increasingly an essential component in new research. NIST scientists and engineers use various machine learning and AI tools to gain a deeper understanding of and insight into their research. At the same time, NIST laboratory experiences with AI are leading to a better understanding of AI's capabilities and limitations.
Abstract: The Butler Institute for Families will plan and implement a mixed-methods process and summative evaluation of an ACF-funded grant to improve collaborations across early childhood and child welfare systems in Wyoming. This study will involve analysis of administrative data and primary data collection with key partners.
The information collection method and the data collection method are through library studies and questionnaires, respectively. Also, the use of the Z-NT makes it possible to reduce the uncertainties associated with these effective factors and to decrease the uncertainties in the reliability of the expert's opinions.
Did data collection and outcomes benefit the community? Seven papers (35%) demonstrated the benefits of data collection and outcomes to the community. Although the simple act to collect data and publish the findings is inherently valuable to the community, few papers demonstrated more direct transformative benefits of their research.